THESIS FOR THE DEGREE OF DOCTOR OF PHILOSOPHY
Solid Fuel Conversion in Dual Fluidized Bed Gasification
−
Modelling and Experiments
LOUISE LUNDBERG
Department of Space, Earth and Environment CHALMERS UNIVERSITY OF TECHNOLOGY
Solid Fuel Conversion in Dual Fluidized Bed Gasification – Modelling and Experiments LOUISE LUNDBERG
ISBN 978-91-7597-788-1 © LOUISE LUNDBERG, 2018.
Doktorsavhandlingar vid Chalmers tekniska högskola Ny serie nr 4469
ISSN 0346-718X
Department of Space, Earth and Environment Chalmers University of Technology
SE–412 96 Göteborg Sweden
Telephone + 46 (0)31–772 1000
Printed by Chalmers Reproservice Göteborg, Sweden 2018
i
Solid Fuel Conversion in Dual Fluidized Bed Gasification
−
Modelling and Experiments
LOUISE LUNDBERG Division of Energy Technology Department of Space, Earth and Environment
Chalmers University of Technology
Abstract
Dual fluidized bed gasification (DFBG) is the initial step towards the transformation of ligno-cellulosic materials into a raw gas, which can be further upgraded into transportation fuels, such as substitute natural gas, Fischer-Tropsch diesel, dimethyl ether, and methanol. DFBG units can be operated in two distinctly different ways, depending on whether the main product is a gas (to be refined into a transportation fuel) or heat and power (with gas as a by-product). For efficient operation in either mode, the degree of char conversion in the gasification chamber needs to be controlled and optimised. For this purpose, extensive knowledge is required regarding how the degree of char gasification is affected by different parameters.
The aim of this thesis is to identify and fill key knowledge gaps regarding how different parameters influence solid fuel conversion in the gasification chamber of a DFBG unit, using a combination of laboratory-scale experiments and semi-empirical modelling. In addition, the possibility of ensuring adequate fuel conversion for either of the target modes described above is investigated. The results of the experiments presented in this thesis confirm that the laboratory-scale conditions applied in the experimental determination of reactivity data aimed at modelling fluidized bed gasification should, as much as possible, mimic the conditions of the end-scale reactor to be modelled. In particular, the effects of fuel axial mixing and of catalytic bed materials on char gasification were found to be significant.
A validated semi-empirical 1D model of the gasification chamber of a DFBG unit has been formulated that: 1) accounts for the effect of fuel axial mixing on the char gasification rate; and 2) introduces a computationally efficient method for describing fuel conversion in fluidized beds. The modelling results show that the dominance of fuel convection over fuel dispersion increases with scale. Satisfactory fuel conversion is easily achieved when heat and power are the main products, with gas as a by-product. However, when the main goal is to improve the efficiency of gas production, a combination of baffles, properly chosen operational conditions, and/or the use of an active bed material is likely necessary to achieve sufficient fuel conversion.
Keywords: dual fluidized bed gasification, biomass, fuel conversion, char gasification rate, char reactivity, fuel mixing, semi-empirical modelling, active bed material
iii
List of Publications
This thesis is based on the following papers, which are referred to in the text according to their Roman numerals:
Paper I Lundberg, L., Johansson, R., Pallarès, D., Thunman, H. A Conversion-class model for describing fuel conversion in large-scale fluidized bed units. Fuel, 2017, 197, 42–50.
Paper II Lundberg, L., Pallarès, D., Thunman, H. Upscaling effects on char conversion in dual fluidized bed gasification. Energy & Fuels, 2018, 32, 5933–5943.
Paper III Lundberg, L., Soria-Verdugo, A., Pallarès, D., Johansson, R., Thunman, H. The role of fuel mixing on char conversion in a fluidized bed. Powder Technology, 2017, 316, 677–686.
Paper IV Lundberg, L., Tchoffor, P.A., Pallarès, D., Johansson, R., Thunman, H., Davidsson, K. Influence of surrounding conditions and fuel size on the gasification rate of biomass char in a fluidized bed. Fuel Processing Technology, 2016, 144, 323–333.
Paper V Lundberg, L., Tchoffor, P.A., Pallarès, D., Thunman, H., Davidsson, K. Influence of bed material activation and fuel moisture content on the reactivity of biomass char in a fluidized bed gasifier. Under preparation.
Related papers not included in this thesis:
Lundberg, L., Pallarès, D., Johansson, R., Thunman, H. A 1-Dimensional Model of Indirect Biomass Gasification in a Dual Fluidised Bed System. 11th International Conference on Fluidized Bed Technology, CFB 2014, Chemical Industry Press, Beijing, 2014, pp. 607-612. Not included in the thesis because Paper II covers the contents.
Lundberg, L., Tchoffor, P.A., Johansson, R., Pallarès, D. Determination of Kinetic Parameters for the Gasification of Biomass Char Using a Bubbling Fluidised Bed Reactor. 22nd International Conference on Fluidized Bed Conversion, Turku, Finland, 2015. Not included in the thesis because
iv
Contributions
Louise Lundberg is the main author of Papers I–V. She is responsible for the modelling work in
Papers I–III (except for the particle model in Paper I), and for the data evaluation and part of the experimental work in Papers IV and V.
Professor Henrik Thunman (main supervisor) contributed with ideas, concepts, discussions, and guidance, as well as with the editing of Papers I–V. Associate Professor David Pallarès (assistant supervisor) contributed with ideas regarding the design of the experiments and the model, discussions and guidance, and with the editing of Papers I–V. Dr. Robert Johansson (assistant supervisor during the first four years of the PhD studies) contributed with discussions about modelling, guidance, and with the editing of Papers I, III, and IV. He also supplied the particle model used in Paper I.
Associate Professor Antonio Soria-Verdugo conducted the experiments in Paper III and contributed with its editing. Dr. Placid Atongka Tchoffor assisted in the experimental work in
Paper IV, is responsible for part of the experimental work in Paper V (the experiments using wood pellets and forest residue pellets, as well as the SEM-EDX and line-scanning analyses), and assisted, together with Dr. Kent Davidsson, in the editing of Papers IV and V.
v
Acknowledgements
I would like to start by expressing my sincere gratitude to my supervisors. Henrik, thank you for helping me see the broader perspective of things and for all your ideas and inputs on the modelling work and on writing papers. David, thank you for your help with developing the model and with the writing. I greatly appreciate all our discussions and that it is so easy to talk to you about anything. Robert, I’m really thankful for all your help with the modelling work, with writing papers and for all our discussions during the first four years of my PhD studies.
Malin, I can’t imagine a better roomie than you! Thank you for all our discussions (both work-related and private) and for being such a good friend. I will miss seeing your face every morning, but I know we will always stay friends, no matter what life brings us.
Placid and Kent, thank you for welcoming me into your lab, for interesting discussions and for valuable inputs regarding the papers. Antonio, thank you for providing me with important experimental data and for your assistance in writing one of the papers.
Thanks to everyone in the gasification group, both current and previous members. A special thanks to Erik, Anton, Mikael, and Teresa for providing me with essential experimental data and helpful discussions.
Thanks to the A-team, you guys are awesome! And to everyone at Energy Technology, thank you for making our division such a nice place to work at.
I doubt I would have come this far without my family and friends. Mum and dad, thank you for all your support and for always believing in me. Karin, thank you for your advice on whether or not I should do a PhD and on what I needed to consider. It was very good advice! Lina, thank you for taking my mind off work when I needed a break. Harry, thank you for being the best kid ever and for finally sleeping really well! And Simon, thank you for your love, help, support, and for being strong when I need you the most. You’re the best!
This work has been financed by the Swedish Gasification Centre (SFC) within the framework of the Centre for Indirect Gasification of Biomass (CIGB); and Energiforsk, the Swedish Energy Agency, and Göteborg Energi within the framework of the project Koksomvandling i indirekt förgasning i fluidiserade bäddar (39972–1).
vii
Table of Contents
Abstract ... i
List of Publications ... iii
Acknowledgements ... v
Table of Contents ...vii
Artwork ... ix
1. Introduction ... 1
1.1. Aim and Scope ... 4
1.2. Methodology ... 4
1.3. Thesis Outline ... 5
2. Background ... 7
2.1. Parameters Affecting the Fuel Conversion ... 7
2.2. Up-scaling and Control of DFBG Units ... 10
2.3. Modelling of Solid Fuel Conversion in Fluidized Beds ... 11
3. Theory ... 13
3.1. Fuel Residence Time ... 13
3.2. Char Gasification Rate and Reactivity ... 14
4. Experiments Conducted within this Thesis ... 15
5. Modelling ... 17
5.1. Model of the Gasifier ... 17
5.1.1. Mass Balances ... 19
5.1.2. Heat Balance ... 20
5.2. Conversion-Class Discretisation Method –Formulation ... 20
5.3. Modelled Cases ... 22
5.3.1. Validation Data ... 24
6. Results and Discussion ... 27
6.1. Results from the Laboratory-Scale Experiments ... 27
6.2. Results from the Modelling Work ... 31
6.2.1. Performance of the Proposed Discretisation Method for Fuel Conversion ... 31
viii
6.2.3. Scaling Simulations ... 34
6.3. Discussion ... 37
6.3.1. Process Optimisation ... 37
6.3.2. Model Assumptions ... 38
6.3.3. Analysis of the Papers over Time ... 39
7. Conclusions ... 41
8. Future Work ... 43
Notation ... 45
ix
Artwork
The figures in this thesis are all original artwork/result figures by the author with the following exceptions:
Figure 2.2 Artwork taken from Larsson et al. [1], modified by the author
Figure 4.1 Original artwork by Dr. Placid Atongka Tchoffor, modified by the author Figure 5.1b Original artwork by Dr. Erik Sette, modified by the author
1
1. Introduction
A strong societal and political drive for the implementation of a circular economy that will be independent of fossil fuels is underway worldwide. The combustion of fossil fuels results in CO2
emissions and is to a large part responsible for the increased levels of greenhouse gases in the atmosphere. This in turn has led to an increase in global temperature and, consequently, climate change [2]. According to the Paris agreement, the increase in global average temperature should be kept “well below 2°C above pre-industrial levels” [3].
The Government of Sweden has set the goal that the domestic transportation sector should be fossil-independent in Year 2030. Since one-third of Sweden’s greenhouse gas emissions originate from the transportation sector [4], achieving this goal would result in climate benefits due to a substantial reduction in CO2 emissions, as well as in a significant weakening of Sweden’s dependence on fossil
fuels.
Biomass, which is an abundant resource in several countries (e.g., Sweden), is predicted to play a role in achieving the abovementioned climate goals [5]. Biomass can be considered to be climate neutral, with several possible areas of application such as in district heating, replacing oil in plastic manufacturing, and in the production of heavy-vehicle transportation fuels [5]. Furthermore, the combination of biomass combustion and carbon capture and storage (BECCS) is put forward as an efficient way to achieve negative CO2-emissions (i.e., decreasing the concentration of CO2 in the
atmosphere) [6].
Biomass gasification is a key technology for the transformation of lignocellulosic materials into a raw gas, which can thereafter be upgraded to transportation fuels, such as substitute natural gas (SNG), Fischer-Tropsch diesel, dimethyl ether (DME), and methanol [7, 8]. There are currently three major gasification techniques: 1) entrained-flow gasification (EFG), in which very fine fuel particles are gasified in a high-velocity flow of O2 or in an O2/H2O mixture [8, 9]; 2) direct fluidized
bed gasification (FBG) [8, 9], in which the fuel, bed material, and fluidizing medium (pure O2 or a
mixture of O2 and H2O) are introduced together into a single fluidized bed; and 3) indirect fluidized
bed gasification (also known as dual fluidized bed gasification, DFBG), which consists of two fluidized bed reactors, one combustor and one gasifier [7, 9]. In EFG and FBG, the heat required to sustain the endothermic gasification reactions is supplied by burning part of the fuel, whereas in DFBG this heat is supplied by circulating the bed material between the combustor and the gasifier (Figure 1.1). Table 1.1 summarises the main characteristics of the three techniques.
2
Table 1.1 Operational conditions, advantages, and disadvantages associated with EFG, FBG, and DFBG [7-9].
EFG FBG DFBG O2 production/dilution with N2 Yes Yes No
Maximum temperature >1600ºC* 800º–1000ºC 750º–1000ºC Yields of tars and by-products Low High High
Fuel grinding required Yes No No
Suitable for pressurisation Yes Yes No
Fuel burnout Yes No Yes
*High temperatures are needed to avoid extensive soot formation [9], and to produce pure syngas that
consists exclusively of CO, H2, H2O, and CO2.
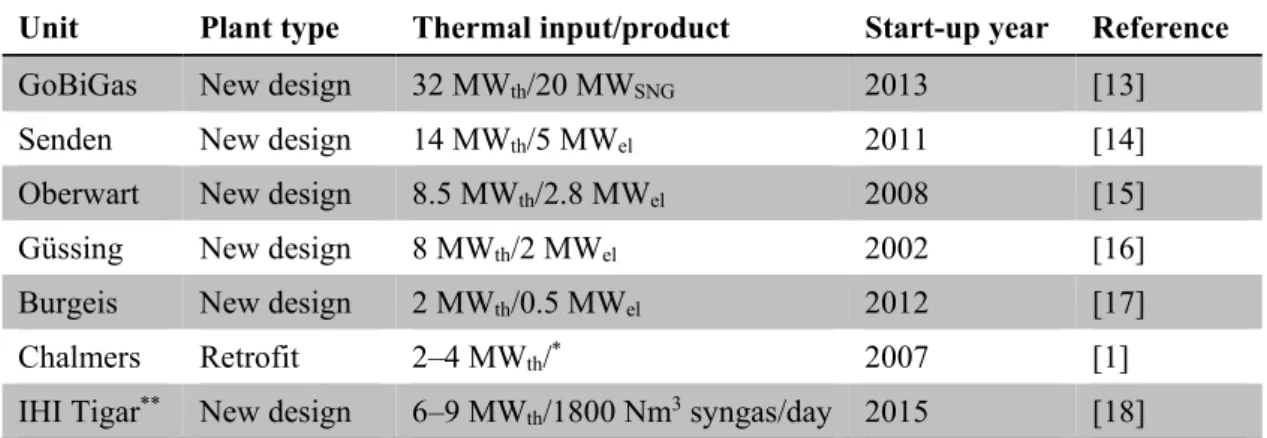
While EFG and FBG are mature techniques for coal gasification, with commercial-scale plants operating worldwide (see for example, [10] and [11], respectively), the up-scaling of DFBG is in progress (Table 1.2). Of the different combinations of fluidized bed types used in DFBG, the most popular is the one in which the combustor is a circulating fluidized bed (CFB) and the gasifier is a bubbling fluidized bed (BFB) [12], and it corresponds to the design of the operational state-of-the-art biomass DFBG units given in Table 1.2. Two of the units listed in Table 1.2 are considered in this thesis: the Chalmers DFBG unit [1] (see Section 5.3.1), and the GoBiGas plant [13], which is an industrial DFBG unit for transforming biomass to SNG.
Table 1.2. Operational biomass DFBG units with a CFB combustor and a BFB gasifier. Unit Plant type Thermal input/product Start-up year Reference
GoBiGas New design 32 MWth/20 MWSNG 2013 [13]
Senden New design 14 MWth/5 MWel 2011 [14]
Oberwart New design 8.5 MWth/2.8 MWel 2008 [15]
Güssing New design 8 MWth/2 MWel 2002 [16]
Burgeis New design 2 MWth/0.5 MWel 2012 [17]
Chalmers Retrofit 2–4 MWth/* 2007 [1]
IHI Tigar** New design 6–9 MW
th/1800 Nm3 syngas/day 2015 [18]
*The raw product gas is torched in the CFB boiler.
**Ready for commercialisation in 2018.
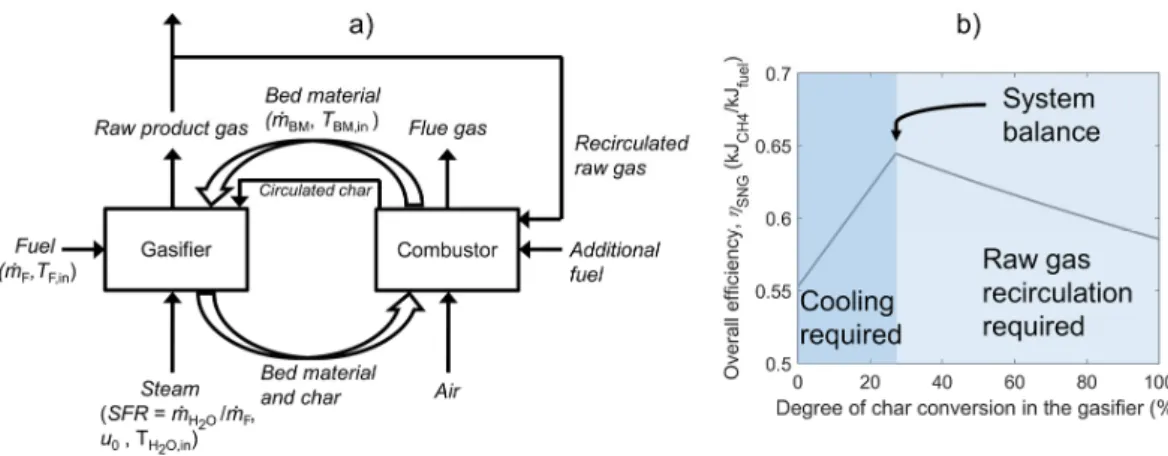
This thesis focuses on the DFBG technology using a BFB gasifier. A DFBG unit (Figure 1.1a) can be designed/operated in two distinctly different modes, depending on whether the main product is: 1) a gas, to be refined into a transportation fuel; or 2) heat and power, with gas as a by-product. The combustor in a DFBG system converts the char that remains after passage through the gasification chamber, and the thermal power in the combustor is thus given by Eq. (1.1). (All the variables, parameters, and constants that are used in the equations, figures, and tables of this thesis are described in the Notation on page 45.)
3
F 1 ,
1 ,
F
(1.1)
If the target is gas production, the optimum overall efficiency of the system occurs when a thermal balance is achieved between the combustor [Pcomb in Eq. (1.1)] and the internal heat demand of the
DFBG unit (i.e., there is no additional fuel input to the combustor; see Figure 1.1a). This occurs when the degree of char conversion in the gasification chamber, Xchar,g in Eq. (1.1), is at its optimal
value, , . Below this value cooling must be supplied, and above this value a part of the raw gas needs to be combusted (see Figure 1.1b). The value of , , which typically lies in the range of 10%–50% [1], depends on the applied biomass fuel, the desired end-product, and the flows and temperatures of the inputs to the gasifier. For SNG production, the degree of char gasification should be slightly above the optimal value, so as to ensure that additional cooling is not needed, without burning excessive amounts of the raw gas. However, for certain end-products (e.g., Fischer-Tropsch diesel), it is desirable to gasify as much char as possible to obtain a raw gas with high concentrations of CO and H2. Thus, , can be regarded as the minimum acceptable degree
of char gasification.
Figure 1.1. a) Principle of DFBG. b) Overall efficiency as a function of the degree of char gasification, exemplified for a case with SNG as the end-product.
In contrast, if gas is a by-product of heat and power production, the produced gas is derived from pyrolysis of the fuel, and the degree of char conversion within the gasification chamber should be minimised, so as to avoid an increased heat demand in the gasifier. Furthermore, designing a DFBG plant such that its operation can be switched between these two modes (a so-called ‘poly-generation unit’) would increase the flexibility of the DFBG technology, which is proposed as a critical component of thermochemical fuel conversion units in an energy system that has an increased share of non-dispatchable heat and power.
As the time-scale for pyrolysis is much shorter than that for char gasification, it is necessary to provide sufficient heat to convert the volatiles, as well as a fuel residence time that allows sufficient char conversion. For efficient operation of either of the two aforementioned modes, it is desirable to be able to control and optimise the degree of char conversion in the gasification chamber. For
4
this purpose, improved knowledge of how different parameters affect the degree of char gasification is required (Figure 1.3).
1.1.
Aim and Scope
The aim of this thesis is to identify and fill key knowledge gaps regarding how different parameters influence solid fuel conversion in the gasification chamber of a DFBG unit. Parameters that affect the fuel residence time (e.g., fuel mixing) and the char gasification rate (e.g., active bed materials) are considered.
Furthermore, the possibility of ensuring sufficient fuel conversion for either of the two target modes (exclusively gas production or heat and power production with gas as a by-product) is investigated. The acquired knowledge is then applied to formulate methods that can be used in the design, up-scaling, retrofitting, and control/optimisation of DFBG units.
The scope of the thesis (and thus, the conclusions drawn from the modelling results) is limited to DFBG units with a BFB gasifier that has a rectangular geometry. The model includes the bottom bed of a BFB gasifier, discretised in one lateral direction (that of the solids cross-flow).
1.2. Methodology
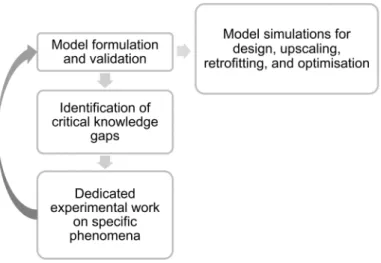
A combination of semi-empirical modelling (see Section 2.3) and laboratory-scale experiments on targeted phenomena was applied in this thesis. Figure 1.2 shows the methodology employed. In brief, the model, which is described and validated in Papers I–III, in Chapter 5, and in Section 6.2.2, has been developed and refined over time. After identifying critical knowledge gaps (see Chapter 2), laboratory-scale experiments were conducted (see Papers IV and V, Chapter 4, and Section 6.1) and the results from these experiments were then used to improve the model. Once the model simulations agreed sufficiently well with measurements from the Chalmers gasifier (see Section 5.3.1), the model was used to investigate the effects of different factors, such as operational conditions and gasifier scale, on the fuel conversion.
5
1.3. Thesis
Outline
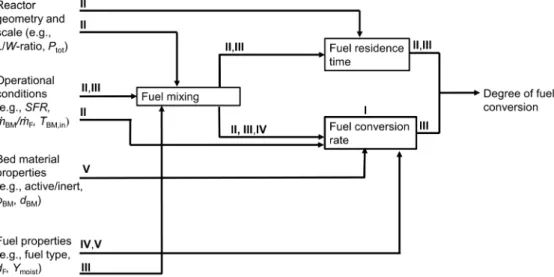
Figure 1.3 shows how the papers included in the thesis are linked to the aim of increasing the knowledge of how different parameters affect the fuel conversion in DFBG. It should be noted that only the factors considered in the papers of this thesis are included in Figure 1.3 (volatiles inhibition, for instance, which affects the char gasification rate [19], is not included). A brief description of each paper is given in Table 1.3.
Figure 1.3. Flow chart showing the influences of the investigated parameters on the degree of fuel conversion. The Roman numerals I–V indicate the papers related to the topics of the thesis.
Table 1.3. Description of the papers included in the thesis. Paper Description
I A computationally efficient method for describing fuel conversion in fluidized beds using
population balances is developed and verified.
II The effects of unit scale on the process performance and optimisation are investigated. Methods for achieving sufficient fuel conversion in large-scale DFBG units are proposed. III
The effects of lateral vs. axial mixing of the fuel on char conversion in the gasification chamber of a DFBG unit, as well as the effects of operational conditions on the dominant mixing mechanisms, are determined.
IV
The impacts on the char gasification rate of fuel axial mixing, fuel concentration, pyrolysis atmosphere, fuel structure (i.e., crushed or intact pellets), and cooling of the char after pyrolysis are investigated and quantified.
V The influences of the bed material and the fuel moisture content on the char reactivity in a fluidized bed are investigated for wood chips of different sizes. Furthermore, the specific effect of bed material activation on the char gasification rate is investigated and quantified.
7
2. Background
2.1.
Parameters Affecting the Fuel Conversion
As shown in Figure 1.3, the degree of fuel conversion within the gasification chamber of a DFBG unit depends on the fuel residence time and the fuel conversion rate, both of which are in turn dependent upon other factors, such as the fuel mixing, reactor geometry and scale, operational conditions, and the bed material and fuel properties.
The fuel residence time (see Chapter 3), increases with reactor size and decreases with fuel lateral mixing (which increases with an increase in fluidization velocity and/or solids cross-flow [20] and is enhanced if the fuel particles are located on the bed surface [21]). Furthermore, baffles can be used to increase the fuel residence time [9], facilitating a more compact design of the gasifier, and thereby yielding lower operational and capital costs.
The influence of operational parameters on fuel conversion through their effect on the fuel residence time is investigated in Papers II and III. Furthermore, the impacts of gasifier scale and the incorporation of baffles into the gasification chamber on the fuel residence time are considered in Paper II.
A biomass particle goes through three fuel conversion stages in a gasifier: 1) drying, during which the moisture in the fuel is evaporated; 2) pyrolysis, during which volatile gases exit the fuel particle; and 3) char gasification, where the C in the char reacts with H2O (and/or CO2 if present) to form
H2 and CO. While drying and pyrolysis depend solely on heat transfer to the fuel particle, char
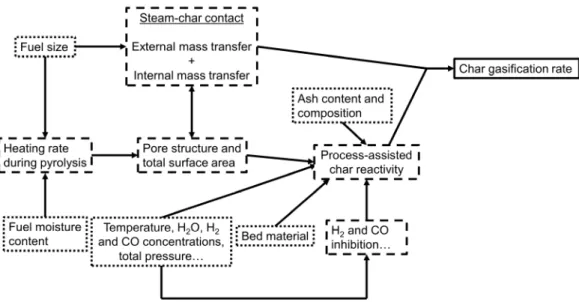
gasification is a more complex process. As shown in Figure 2.1, the obtained char gasification rate is a combination of the char reactivity and mass transfer limitations.
Reactivity studies on biomass char are often conducted with thermogravimetric analysis (TGA), using small fuel particles and relatively low heating rates [22, 23]. However, the process conditions, such as the heating rate (which for fluidized beds is in the range of 100º–1000ºC/s [24]) and the choice of bed material, can have significant effects on the char reactivity (see below). In line with this, previous studies have shown that to obtain data from laboratory-scale units that are useful for the modelling of industrial-scale processes, chemical similarity (i.e., that the conditions in the laboratory-scale reactor, such as the fuel particle temperature and the pressure inside the fuel particle, are similar to those in the industrial-scale unit) must apply [25].
Thus, the reactivity parameters determined using TGA are not applicable to the modelling of char gasification in a fluidized bed gasifier. Instead, to acquire relevant kinetic and structural data, a laboratory-scale fluidized bed gasifier should be employed. Fluidized bed gasifiers have previously been used to determine the reactivities of coal char (e.g., [26, 27]) and biomass char (e.g., [28, 29]). In this thesis, the char reactivity that results from biomass gasification in a fluidized bed is designated as the “process-assisted char reactivity” (Figure 2.1), to distinguish it from the char
8
reactivity that results from TGA. The process-assisted char reactivity is the reaction rate in the absence of mass transfer limitations.
Figure 2.1. Schematic showing how the different parameters are connected to the process-assisted char reactivity and the char gasification rate. The dotted-line boxes signify inputs (fuel and bed material data/operational conditions), the dashed-line boxes are intermediates,
and the solid-line box represents the output (the char gasification rate).
The size of the fuel particles affects the resistance to mass transfer. Furthermore, mass transfer becomes more dominant as the temperature increases. Nilsson et al. [24], who investigated the gasification of chars from dried sewage sludge with different sizes (1.2–3.4 mm) in a laboratory-scale fluidized bed, found that mass transfer was the limiting factor for all but the smallest particles (1.2 mm) at 900°C. In contrast, at 850°C, the observed char gasification rates were similar for all the fuel particle sizes. Thus, by choosing a sufficiently small fuel particle size for the determination of the process-assisted char reactivity, mass transfer limitations can be avoided. The effect of fuel particle size on the char gasification rate is investigated for wood pellets (crushed and intact) and for wood chips in Papers IV and V, respectively.
The char reactivity increases with temperature and steam concentration. There exists substantial variability in the reported kinetic parameters for biomass char gasification, both between different biomasses [22] and within a batch of a given biomass [30]. When TGA is used, the found variability in biomass reactivity is mainly attributed to the intrinsic heterogeneity of the ash content and composition [22]. In particular, K and Ca have been shown to catalyse char gasification [31, 32]. As mentioned above, in addition to the aforementioned intrinsic heterogeneity of biomass, several process-related parameters can affect the char reactivity, including the heating rate, the steam-char contact, and the choice of bed material (these three parameters are described in more detail below), as well as the time of pyrolysis [26, 33, 34], total pressure during char gasification [34], char cooling prior to char gasification [24], inhibitory effects of H2 and CO [19, 28], and the gasification
9
atmosphere [28, 35]. In Paper IV, the effects of char cooling, pyrolysis atmosphere, and fuel concentration are considered for steam gasification of wood pellets.
The heating rate affects the pore structure of the char. The morphology of chars formed at low heating rates remains relatively unchanged due to the slow outflow of volatile gases [36, 37]. In contrast, the rapid outflow of volatile gases that is the consequence of a high heating rate leads to a loss of the original cellular structure of the particle, yielding a more porous char [38]. Several authors have shown that chars formed at high heating rates are 2–3-fold [22] more reactive than those produced at low heating rates [36, 39-42], and this phenomenon has been attributed to a larger total surface area and a more reactive pore structure [36, 42]. Furthermore, the recombination of C, which can occur over time, is reduced by the rapid outflow of pyrolysis gases that results from high heating rates [40].
The moisture content of the fuel affects the heating rate of the fuel particles (a wet fuel takes longer to heat than does a dry fuel), and thus possibly the resulting char structure and reactivity. The effect of moisture content on char reactivity is investigated in Paper V by comparing the two extremes for wood chips, i.e., a dry fuel (moisture content of 0%) and a fuel that is saturated with water (moisture content of around 40%).
The fuel size also influences the heating rate (small particles are heated faster than larger particles), and could thus potentially affect the char reactivity. However, as noted above, in the study conducted by Nilsson et al. [24], no effect of fuel size on the char gasification rate was observed at 850°C.
As indicated in Figure 2.1, in addition to influencing the resistance to mass transfer to the char particle, the steam-char contact also affects the char reactivity. This is because the total surface area and pore volume increase when the char comes into contact with steam [43, 44].
The heating rate and the steam-char contact vary depending on whether the fuel particles are present on the bed surface or within the dense bed. Thus, fuel axial mixing (which has been shown to be promoted by high fluidization velocities and low solids cross-flows [45]) can affect the char reactivity. This effect is examined in Paper IV. Furthermore, the effects of operational conditions on the degree of char gasification, through their influences on fuel mixing, are investigated in
Paper III, using the results from Paper IV.
The choice of bed material has been shown to affect char conversion in the gasification chamber of a DFBG unit [46-49]. For example, Berdugo Vilches et al. [48] observed 6.6-fold, 3.0-fold, and 1.2-fold increases in Xchar,g when switching from quartz sand to bauxite, ilmenite, and olivine,
respectively. The observed effect of the bed material is explained by to the fact that some bed materials have a higher tendency than others (e.g., silica sand) to interact with the ash-species present in the fuel, such that a catalytically active ash layer is formed around the bed material particles. K, which forms gas-phase compounds such as KOH and KCl at 600°–1000°C (i.e., typical gasification temperatures) [43, 50], has been identified as being catalytically active in this process [51, 52].
10
In Paper V, the effects of bed material type on the process-assisted kinetic parameters and the shape of the conversion profile (i.e., the variation of reactivity with the degree of char gasification) are investigated by comparing the char reactivities for steam gasification of wood chips using two different bed materials: silica sand and activated olivine extracted post-operation from the GoBiGas gasifier. Furthermore, the specific effect of bed material activation on char gasification is investigated using silica sand, fresh olivine, and activated olivine as the bed materials and wood pellets and forest residue pellets as the fuels.
2.2.
Up-scaling and Control of DFBG Units
In large-scale BFB units, the bed height is limited to a few decimetres because the bubble size increases with bed height, which results in a significantly decreased mass transfer of gas between the bubble and emulsion phases [53]. This in turn leads to a reduction in the steam-fuel contact, which limits char conversion.
Thus, for commercial-scale plants, cross-sectional up-scaling (i.e., increasing the cross-sectional area of the gasifier without increasing the bed height) must be applied to limit the bubble size, as well as to maintain a constant fluidization velocity. DFBG systems also offer the possibility to use high-pressure process steam to fluidize the bed, which can help to decrease the bubble size by creating a high pressure drop over the gas distributor [54], thereby improving the gas-solids mixing. Cross-sectional up-scaling yields a larger cross-sectional area, as compared to up-scaling in all three dimensions. As a consequence, there are higher capital costs, and the circulation of bed material between the BFB gasifier with its large cross-sectional area and the comparatively small CFB combustor can create a challenge for the spatial design. Furthermore, while laboratory-scale BFB units often have a circular cross-section, for larger units, rectangular geometries would be more cost-effective because they are easier to build.
As noted in Section 2.1, the degree of char gasification in a DFBG unit is strongly dependent upon the temperature and the fuel residence time within the gasification chamber. Controlling the flow and the temperature of the solids entering the gasifier is therefore crucial for process optimisation. The temperature of the solids entering the gasifier can be controlled by installing a heat exchanger before the gasifier. Furthermore, by designing the unit such that part of the flow can bypass the gasifier, the solids flow into the gasifier can be controlled.
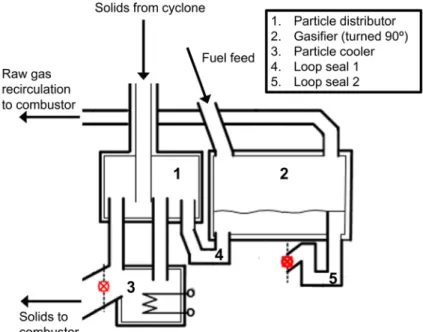
An example of this is the Chalmers system (see Section 5.3.1), which originally consisted of a 12-MW boiler with an external heat exchanger (termed the ‘Particle cooler’, see item 3 in Figure 2.2) connected to its return leg. It was subsequently retrofitted into a DFBG unit by adding a 2–4-MW BFB gasifier to the return leg. Thus, the circulating solids can be divided into three streams that flow: 1) through the external heat exchanger; 2) through the gasifier; and 3) directly back to the combustor.
11
Figure 2.2. Schematic of part of the Chalmers DFBG unit, showing the particle distributor, gasifier, particle cooler, and loop seals.
2.3.
Modelling of Solid Fuel Conversion in Fluidized Beds
Three major types of models are used for modelling solid fuel conversion in fluidized beds. These are (in increasing level of detail): 1) black-box (or zero-dimensional) models; 2) semi-empirical models; and 3) computational fluid dynamics (CFD) models [23]. Black-box models, in which the overall zero-dimensional heat and mass balances are solved using empirical correlations, have few inputs and are thus very simple to use, but they do not provide any information regarding the processes occurring inside the gasifier [23]. In CFD models, the velocity fields of the gas and solid components are given by solving the momentum balances, and critical assumptions need to be made regarding the interactions that occur between the different phases [23].
Semi-empirical modelling, in which the velocity fields are not given by solving the momentum transfer equations but by using simpler means, is the most widely used approach to modelling solid fuel conversion in large-scale fluidized beds (see for example, [55-58] for models of fluidized bed combustion, and [59-63] for gasification), as it offers reliability and a sufficient level of detail at a relatively low computational cost [23].
Due to the vigorous mixing in fluidized beds, fuel particles with different degrees of conversion can be, and often are, present in the same location. One way to deal with this, as is often applied in CFD models, is to track each particle (or parcel of particles) separately using Lagrangian Particle Tracking (LPT, see e.g., [64-66]). A less-accurate method, which is used mainly in zero-dimensional models but is sometimes also used for modelling drying and devolatilisation [57], is to solve one mass balance for each fuel field (moisture, volatiles, and char), while assuming a constant conversion rate for each fuel species.
12
A method that is more computationally affordable than LPT and that offers a higher level of detail than zero-dimensional models is the use of population balances under the assumption that fuel conversion takes place in a specific regime (e.g., the shrinking sphere regime). The fuel components (usually char) are divided into different classes based on either density or size, and one mass balance is solved for each class. In holistic modelling of CFB boilers, population balances are commonly used to model char combustion [55-58]. Population balances are used less frequently in the modelling of fluidized bed gasification, although specific cases have been reported [67]. The model presented in this thesis (for a detailed description, see Paper II and Chapter 5) uses semi-empirical modelling, and solid fuel conversion is described using population balances. The proposed model contains two new elements, as compared to the semi-empirical fluidized bed models found in the literature:
1) Instead of assuming a specific conversion regime and basing the classes in the population balance on either size or density, a new method is proposed. This computationally efficient method, described in Paper I, discretises the fuel conversion into classes based on the degree of conversion. It can be applied to different fuels with various size distributions and it is valid regardless of the fuel conversion regime.
2) The model accounts for the effect of fuel axial mixing on the char gasification rate (see Section 5.1.1). The method used for this is described in Paper III. In brief, it combines empirical correlations for the axial mixing of fuel during pyrolysis (from Sette et al. [45]) and char gasification (from Paper III) with the findings from Paper IV related to how the char gasification rate is influenced by fuel axial mixing.
The semi-empirical fluidized bed model used in Papers I–III in this thesis is based on the dimensions (width, length, and bed height) and the input data (input temperatures and mass flows, fuel and bed material properties) of the Chalmers 2–4-MWth gasifier [1]. The model is validated
using measurements of the degree of char conversion in the Chalmers gasifier, as taken from experiments conducted by Larsson et al. [1], Israelsson et al. [68], and Berdugo Vilches et al. [69] (see Section 5.3.1). For the scaling simulations conducted in Paper II, the length-to-width ratio, bed height, and superficial fuel load (in W/m2) are the same as for the Chalmers gasifier, i.e.,
13
3. Theory
3.1.
Fuel Residence Time
In this thesis, the average residence time of the fuel within the gasification chamber, τF, is estimated
according to Eq. (3.1) [70]. This equation, which assumes that the velocity field of the bed material within the gasifier is uniform, combines the time-scales of the dispersive fuel flow, τd, [Eq. (3.2)],
and the convective fuel flow induced by the cross-flow of bed material, τc [Eq. (3.3)].
F 1/ 1/ (3.1)
/ 2 F (3.2)
BM/ F BM/ F BM (3.3)
The time-scale of fuel dispersion, τd [Eq. (3.2)], depends on the reactor length, L, and the fuel
dispersion coefficient, DF. Thus, with respect to the conditions assumed in this thesis for scaling
(constant length-to-width ratio (L/W) and constant superficial fuel load in the gasifier, Qcr (W/m2),
see Section 5.3), τd increases proportionally with the scale of the gasifier.
The time-scale of fuel convection, τc [Eq. (3.3)], depends on the time-scale for the mixing of the
bed material within the gasifier, τBM, and the cross-flow impact factor,θF (see Section 5.1.1). For
constant values of ṁBM/ṁF, L/W, and Qcr, τBM is independent of the scale. However, since θF
increases with the bed material velocity (see Table 5.1), which increases with scale for the geometrical assumptions made in this thesis regarding scaling, τc decreases with an increase in
gasifier size. Thus, as the gasifier size increases, fuel convection becomes more dominant compared to fuel dispersion, i.e., the solids circulation assumes a more prominent role in the fuel residence time than does the fluidization velocity or the dense bed height.
Setting τd equal to τc and plotting DF as a function of (θFṁBM) [Eq. (3.4)] yields a straight line,
which is the boundary between the dispersion-dominant regime and the convection-dominant regime (see Figure 6.9b). Thus, Eq. (3.4) can be used to determine the dominant mixing regime for a given set of operational conditions and reactor geometry. Above this boundary [i.e.,
DF >> L2/(2mBM)·(θFṁBM)], τF is dominated by fuel dispersion as fuel dispersion is faster than fuel
convection. Below this boundary [i.e., DF << L2/(2mBM)·(θFṁBM)], fuel convection is faster than
fuel dispersion and thus becomes the dominant factor for τF.
F / 2 BM · F BM (3.4)
In Section 6.2.2, Eq. (3.4) is used to determine the dominant mixing regimes within the Chalmers gasifier for a range of operational conditions. Furthermore, in Section 6.2.3, the effect of scale on the degree of char gasification, caused by its influence on the dominant mixing regimes, is investigated based on the above-described assumptions and definitions of τF,τd, andτc.
14
3.2.
Char Gasification Rate and Reactivity
The degree of char gasification, Xchar,g, is defined as:
, C, C
C, (3.5)
In this thesis, a clear distinction is made between the char gasification rate, Rg, which includes mass
transfer limitations (resistance to external mass transfer to the fuel particle and pore diffusion within the particle) if such are present, and the process-assisted char reactivity, Rpa, for which it is
assumed that there are no such limitations.
As mentioned in Section 2.1, in a study of char reactivity in a fluidized bed conducted by Nilsson et al. [24], even for the largest fuel particles used (3.2 mm), no mass transfer limitations were detected at 850°C. Furthermore, for the ‘small’ wood chips (thicknesses of 2–4 mm) used in the reactivity study of this thesis, the Damköhler number (which compares the reaction rate to the external mass transfer rate) and the Thiele modulus (which compares the reaction rate to the internal mass transfer rate) are estimated to be in the order of 10–5 and 10–3, respectively for T = 850°C. As
both factors are << 1, in the estimation of the kinetic parameters reported in Section 6.1, it is reasonable to assume that for the small wood chips there are no mass transfer restrictions at
T≤ 850°C. Therefore, for these conditions Rg = Rpa.
In the present work, Rg and Rpa are defined using the conversion rate (i.e., normalising with the
initial carbon mass of the char particle) according to:
/ , C
C,
C
F, C, (3.6)
For simplicity, nth-order kinetics are chosen for the comparative study of how bed material
activation can affect the process-assisted char reactivity. can then be expressed according to [71]:
, H O , H O , (3.7)
In Eq. (3.7), the last term, f(Xchar,g) is a structural model that accounts for structural changes within
the char matrix as char conversion proceeds. Both purely empirical models (see for example, [24]) and models that attempt to describe changes in the porous structure of the char (such as the random pore model [16]) are available in the literature. In this thesis, only a qualitative analysis of f(Xchar,g)
is conducted. The analysis focuses on Xchar,g≈ 5%–80%, which is a relevant range for DFBG.
Within this range, changes in the shape of the conversion profile are relatively slow, as compared to during the start and end phases of char gasification.
15
4. Experiments Conducted within this Thesis
The laboratory-scale experiments conducted within the work of this thesis complement the experimental data obtained from industrial-scale units (i.e., the Chalmers gasifier and the GoBiGas unit). The experiments were carried out to investigate specific phenomena, whose effects are easier to distinguish at the laboratory scale.
The effects of the following parameters on char gasification were investigated in the experimental study conducted in this thesis: fuel axial mixing, fuel type, fuel size, fuel structure (i.e., crushed or intact pellets), fuel moisture content, fuel concentration, pyrolysis atmosphere, cooling of the char after pyrolysis, bed material type, and bed material activation (olivine).
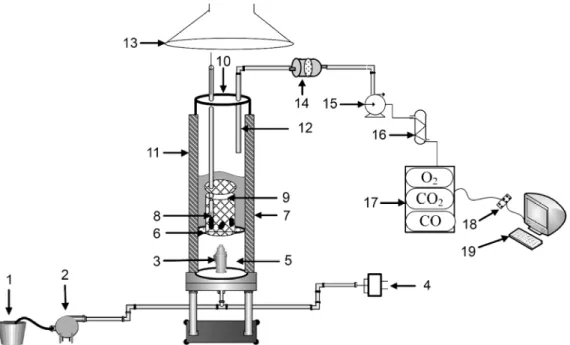
The experimental set-up (see Figure 4.1) is described in detail in Papers IV and V. In brief, it consists of a bubbling fluidized bed reactor (7 cm i.d.) that is surrounded by an oven. The bed is fluidized with pure N2 during pyrolysis, a mixture of N2 and H2O during char gasification, and air
during combustion. Fuel is either added batch-wise at the top of the reactor or by placing it in a lidded wire-mesh basketthat is subsequently inserted into the bed. After the gas has passed through a particle filter and a condenser, the concentrations of O2, CO2 and CO are logged.
16
In Paper IV (and in Section 6.1), the effect of fuel axial mixing on the char gasification rate is investigated using wood pellets as the fuel and silica sand as the bed material. The fuel particles are placed in the basket, the position of which can be adjusted so that the fuel particles are either inside the dense bed (IB) or on the bed surface (BS). Furthermore, the position of the basket can be adjusted after pyrolysis such that pyrolysis and char gasification can occur at different axial positions.
Paper V (and Section 6.1) investigates the effect of bed material activation on the char gasification rate (T = 870°C, pH2O = 0.72 bar) and the process-assisted reactivity (T = 750°–900°C, pH2O = 0.10–
0.50 bar). Three bed materials (silica sand, fresh olivine, and activated olivine taken from the GoBiGas unit) and three fuels (wood chips, wood pellets, and forest residue pellets) are considered. For the wood chips, three different fuel sizes (thicknesses in the range of 2–9 mm) are employed. Furthermore, the effect of fuel moisture content on the char gasification rate is investigated by comparing the two extremes for wood chips: a dry fuel (i.e., 0% moisture) and a fuel that is saturated with water (i.e., ≈ 40% moisture).
17
5. Modelling
The model of the gasifier and the method used to discretise the fuel conversion are presented in Sections 5.1 and 5.2, respectively, whereas the modelled cases are described in Section 5.3. The most important assumptions made in the modelling work and their potential implications for the results are discussed in Section 6.3.2.
5.1.
Model of the Gasifier
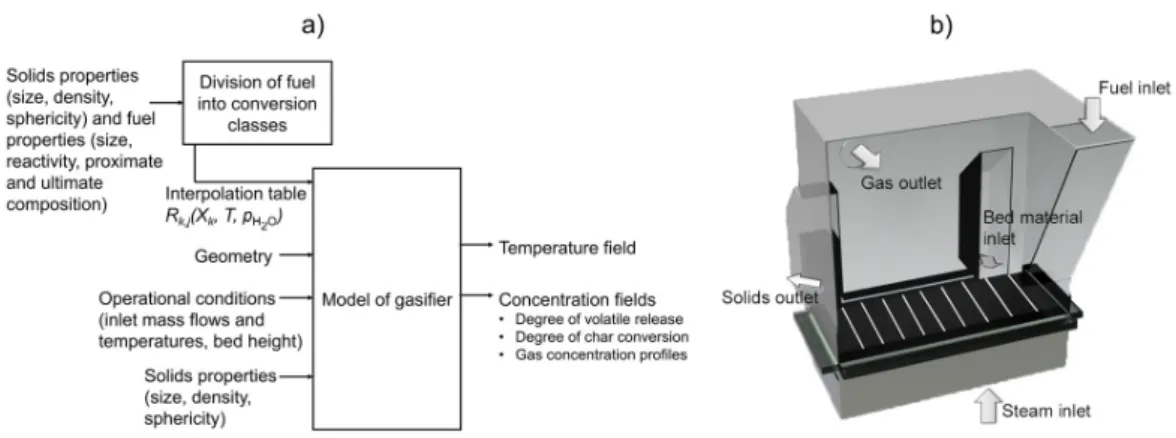
In the steady-state, semi-empirical 1D model used in this thesis (see [72] for a previous version), the dense bottom bed of the gasification chamber is discretised in the direction of the solids cross-flow. The model input/output scheme is depicted in Figure 5.1a, while Figure 5.1b shows the mass flows considered by the model, as well as the direction of discretisation. The solids are assumed to leave the gasification chamber by falling over the edge at the outlet.
Figure 5.1 a) Model structure, and b) energy and mass flows considered by the model of the gasifier, as well as the direction of discretisation (white lines).
The model solves the mass and heat balances given by Eqs. (5.1)–(5.5). The values and empirical correlations used to estimate the parameters in Eqs. (5.1)–(5.5) (e.g., dispersion coefficients), as well as additional parameters used in the model, are given in Table 5.1. Assuming that the concentration of bed material is equal to the bed density (i.e., VF << VBM), the velocity field of the
bulk solids induced by the solids cross-flow is calculated from a potential flow function, ΦBM, according to Eqs. (5.4a–b) [20].
Mass balance for gas species i in the bubble phase:
0 G, , G, , , (5.1)
Mass balance for gas species i in the emulsion phase:
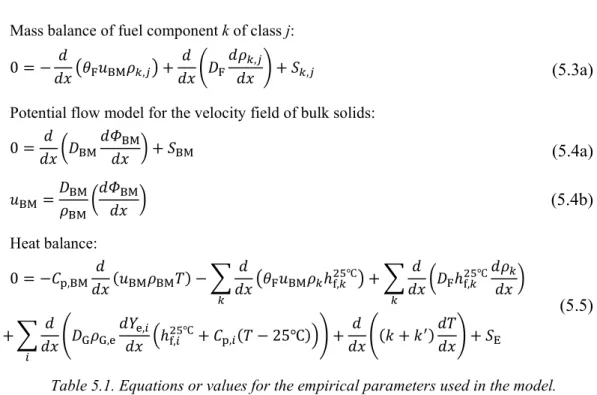
18 Mass balance of fuel component k of class j:
0 F BM , F , , (5.3a)
Potential flow model for the velocity field of bulk solids:
0 BM BM BM (5.4a) BM BM BM BM (5.4b) Heat balance: 0 ,BM BM BM F BM , F , G G, , , , 25 E (5.5)
Table 5.1. Equations or values for the empirical parameters used in the model.
Parameter Value/equation Reference
DBM (m2/s) 7.3·10–3·u0 + 1.3·10–2 [73] DF (m2/s) 3.3·10–2·u0 – 4.0·10–4 [45] DG (m2/s) 10–4 [74] θF (–) θF [0,1] 4.7·u0 – 0.52, uBM = 0.009 m/s 5.7·u0 – 0.63, uBM = 0.012 m/s [20] [20]
Kbe (1/s) 4.5· (umf/db,av)+5.85· (DG0.5g0.25/db,av1.25) [74]
db0 (m) 1.63[(u0–umf)·A0/g0.5]0.4 [75] db (m) 0.54(u0–umf)0.4·(h+4·A00.5)0.8g–0.2 [75] db,av (m) [db0+db(h = H)]/2 – Remf (m/s) (33.72 + 0.0408Ar)1/2 – 33.7 [76] εmf (–) Ar = 1.75/(εmf 3φ BM)·Remf2 +150(1–εmf)/(εmf3φBM2) ·Remf [53] δb (–) 0.534–0.534·exp(–(u0–umf)/0.413) [77] εe (–) 0.62–0.059·exp(–(u0–umf)/0.429) [77] k’ (W/(m·K)) DBM·ρBM·(1–εe) ·Cp,BM +DF·ρash,bed·Cp,ash –
19 5.1.1. Mass Balances
Gas species
The gas species considered are CO, CO2, H2, H2O, CH4, and tar (represented by C6H6O). The gas
flow is described by the two-phase model approach [78], which divides the gas into two phases: 1) the emulsion phase (containing the gas needed for minimum fluidization and all the solids); and 2) the bubble phase (containing all the excess gas fed to the bed, i.e., corresponding to a volumetric flux of u0–umf). Thus, for each gas species, two mass balances are formulated that correspond to
the bubble phase [Eq. (5.1)] and the emulsion phase [Eq. (5.2)].
The first term on the right-hand-side (RHS) of Eqs. (5.1) and (5.2) describe mass transfer between the bubble phase and the emulsion phase, which is governed by the bubble-emulsion interchange coefficient, Kbe. The second term in Eq. (5.2) describes the lateral gas transport within the emulsion
phase, which is governed by the lateral gas dispersion coefficient, DG. The final term in Eqs. (5.1)
and (5.2) are the source terms, which include reactions (the water-gas-shift reaction) and transport into and out of the gasifier, i.e., the gas entering the reactor and that leaving at the bed surface. It is assumed that drying and pyrolysis occur on the bed surface, which means that the gases released by these processes do not enter the bottom bed region. This behaviour has been confirmed for industrial-scale beds in the Chalmers gasifier using a hot-temperature camera probe [45], and it can to some extent be attributed to the lifting force of the endogenous bubbles formed around the fuel particles during pyrolysis [79].
Fuel
The reactive fuel components (moisture, volatiles, and char), k, are each divided into a number of classes, j, based on the degree of conversion (see Section 5.2), for all of which a mass balance [Eq. (5.3a)] is solved. Equation (5.3a) is also used to calculate the concentration field of ash within the gasifier, using only one class and no reaction terms.
Equation (5.3a) includes both convective and dispersive mass transport, as well as a source term that includes reactions and transport into and out of the gasifier. The convective transport is governed by the cross-flow impact factor, θF, which represents the extent to which the fuel particles
follow the velocity field of the bed material induced by the solids cross-flow. For the cases in which a baffle-equipped gasifier (see Section 5.3) is used, the baffles are modelled by setting the dispersion coefficient, DF, to a low value (DF,low = 10–6 m2/s) and the cross-flow impact factor, θF,
to zero at a certain grid surface.
As shown in Figure 5.1a, for a given fuel, a sub-model (see Section 5.2) is used to generate an interpolation table with values for the conversion rate of conversion class j of fuel component k
(Rk,j) for a range of steam concentrations and/or temperatures, prior to the gasifier model
simulations. In the gasifier model, the conversion rate of fuel species k of class j is then given at the cell steam concentration and/or temperature through interpolation.
20
The model of the gasifier takes into account the effects of operational conditions on the char gasification rate based on their influence on the axial distribution of fuel. This is achieved by determining the fraction of fuel particles that undergoes pyrolysis on the bed surface and char gasification inside the dense bed, FBS/IB, according to the method described in Paper III, and by
setting the char gasification rate at 50% lower than for all other fuel particles (results from
Paper IV, see Section 6.1). The probability that pyrolysis occurs on the bed surface, and thus the value of FBS/IB, increases with bed material velocity [45], which increases with scale (see
Section 3.1). Thus, the char gasification rate will decrease with scale until FBS/IB reaches unity.
5.1.2. Heat Balance
In the gasifier model, a single heat balance [Eq. (5.5)] is solved, which includes both the gas and the solids (bed material and fuel). The difference in temperature between the fuel and the surroundings is accounted for with the particle model-based sub-model (described in Section 5.2). Furthermore, in Eq. (5.5), it is assumed that the reacting fuel components remain at the fuel inlet temperature until they are converted, whereas the ash and bed material are heated to the temperature of the bed.
The first and second terms on the RHS of Eq. (5.5) describe convective heat transfer by the bed material and the fuel, respectively. The third and fourth terms represent the heat transported by fuel and gas dispersion, respectively, whereas the fifth term designates the heat transfer due to temperature gradients, i.e., conduction, k, and that related to the dispersive mixing of bulk solids and ash, k’ (see Table 5.1). The final (source) term represents the energy flows into and out of the gasifier, i.e., the feeding and outlet flows of fuel, bulk solids, and gas.
5.2. Conversion-Class
Discretisation
Method
–Formulation
For each fuel components, Eq. (5.3a) can also be written in the form of a population balance according to: 1 (5.3b)
In Eq. (5.3b), the term on the left-hand side designates the rate of mass accumulation of a fuel component of class j within a computational cell. In this thesis, the focus is on steady-state conditions, so this term is set equal to zero. The first term on the RHS describes the net transport of class j of the fuel component due to mass transfer mechanisms, i.e., fuel convection and dispersion, or due to point sources/sinks (e.g., fuel feeding or draining).
In this thesis, the population balances used are based on the degree of conversion rather than on the size or density of the fuel particle. Thus, the second term on the RHS of Eq. (5.3b) describes how class j–1 of the fuel component (i.e., a class with a lower degree of conversion) enters class j
21
as a result of conversion, whereas the third term on the RHS designates the amount of the fuel component that leaves class j for a higher class, j+1, due to conversion.
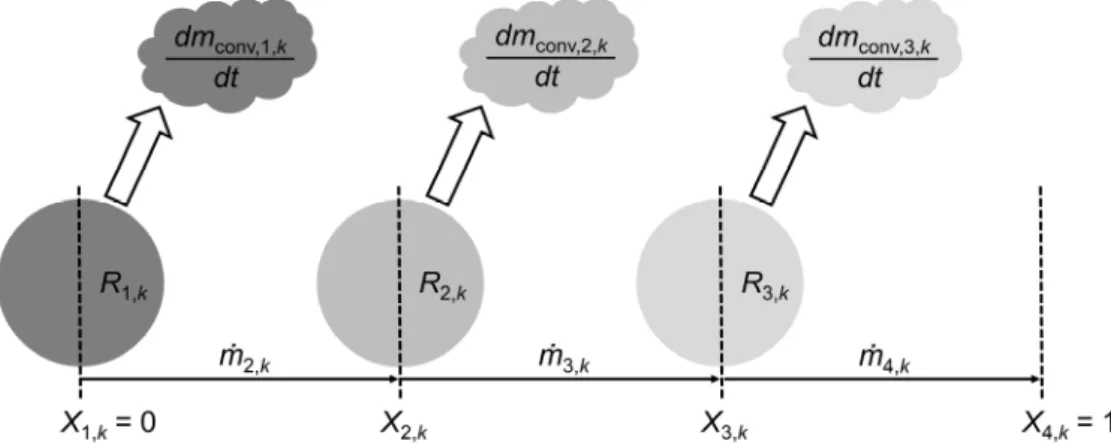
Figure 5.2 outlines the principle of the conversion-based classes. Here, ṁj+1,k designates the mass
flow of fuel component k that has reached a certain degree of conversion, Xj+1,k, and thus leaves
class j for class j+1.
Figure 5.2. Principle of the conversion-based classes for three classes.
The mass flow of fuel component k leaving class j is given by:
, , , ·
1 ,
, , , ,
1 ,
, , (5.6)
In this thesis, the conversion of a single fuel particle is simulated using a 1-dimensional transient model, which solves the energy and gas species transport equations and takes into account both the fuel conversion and shrinkage due to drying and pyrolysis. Moreover, the transfer coefficients in the particle model are corrected to account for the outflow of gases.
Running the particle model described above yields curves for the degree of conversion as a function of time. These curves can be discretised into a number of classes based on the conversion degree, for which each class (of size ΔXj,k,) has an individual conversion rate, Rj,k. Figure 5.3a shows the
degree of pyrolysis at 800°C as a function of time, as given by the particle model, χk, and a linear
approximation, Xlin,k, given by discretising the conversion process into three equally large classes, ΔXj,k = 33% for j = 1–3. The shaded areas, Aj,k, signify the errors for classes j = 1–3.
22
Figure 5.3. Degree of conversion as a function of time for the conversion of volatiles given by the particle model and a linear approximation using: a) three equally large classes; and b) the proposed discretisation method. The shaded areas represent the
inaccuracies of the linear approximations.
As shown in Figure 5.3a, when three equally large classes are used, Aj,k becomes very large for
classes 1 and 3, and very small for class 2, resulting in a poor description of the conversion process. To decrease the error and distribute it uniformly along the conversion process, the areas between the curves for each class should be equally large. This is achieved using the discretisation method proposed in Paper I, which is based on making Aj,k equal for all classes, as illustrated in
Figure 5.3b.
The total error for fuel component k is defined according to Eq. (5.7), where Pk is a piece-wise
polynomial representation of χk: , , | | , (5.7)
5.3. Modelled
Cases
The cases modelled in this thesis can be divided into two categories: 1) cases that employ the dimensions and input data of the Chalmers gasifier; and 2) up-scaling and down-scaling simulations, for which the length-to-width ratio, bed height, and superficial fuel load in the gasifier (W/m2) are the same as for the Chalmers gasifier (i.e., cross-sectional scaling is applied; see
Section 2.2). The model input data for both types of simulations are given in Table 5.2.
The simulations of the Chalmers gasifier are used for model validation, as well as for investigating how operational conditions affect the dominant fuel mixing mechanisms (Papers II and III and Section 6.2.2). The validation data used are taken from Larsson et al. [1], Israelsson et al. [68], and Berdugo-Vilches et al. [69], all of whom conducted measurements in the Chalmers gasifier (see Section 5.3.1).
23
Table 5.2. Model input data.
Input parameter Chalmers gasifier Scaling simulations
Ptot 1.4–1.9 MW 1–420a MW
Qcr = ṁFLHVF/Across 1.0–1.3 MW/m2 2 MW/m2
L/W 2.25 2.25
Δpbed 4–6 kPa 6 kPa
TBM,in 700°–950°C 700°–900°Cb TH2O,in 107°–250°C 200°–800°Cb TF,in 25°C 25°C SFR 0.2–1.4 0.3–1.0 ṁBM/ṁF 30–60 2–25 Fuel
Type Wood pellets
Ymoist (as received) 9%
Yash (as received) 0.5%
Ychar (daf) 19% YC,char (ash-free) 96%–100% YC,F (daf) 51% YH,F (daf) 6% YO,F (daf) 43% LHVF (as received) 16.9 MJ/kg LHVchar (ash-free) 30.5 MJ/kg dF 8 mm ρF 1105 kg/m3
Char reactivity From Lundberg et al. [80] and Paper V
Bed material
Type Silica sand & activated olivine
ρBM 2700 kg/m3 & 3300 kg/m3
dBM 292 µm & 490 µm
φBM 0.86 (from Leva [81])
aP
tot = 420 MW corresponds to the retrofit of a 100-MW combustor into a DFBG unit, given by Eq. (1.1)
with , = 30% and the remaining parameters taken from Table 5.2.
bUnless stated otherwise, T
BM,in = 900°C and TH2O,in = 200°C for the scaling simulations.
In the simulations used to investigate the effect of scale, DFBG units with capacities in the range of 1–420 MWth are modelled. Both new designs and retrofits of existing boilers into DFBG units
24
are considered. The effects of scale on the dominant fuel mixing regimes and the possibilities for process optimisation of DFBG units with different targets (solely gas production or heat and power production with gas as a by-product) are investigated (see Section 6.2.3). Two different gasifier designs are considered: 1) a base-case gasifier without any baffles; and 2) a baffle-equipped gasifier with baffles at x/L = 0.2 and 0.8.
All of the model simulations presented in the papers of this thesis were conducted using wood pellets and silica sand, as the available validation data at the time were based on this fuel and bed material, respectively. More recently, validation data have been obtained from experiments in the Chalmers gasifier using wood pellets and activated olivine as the fuel and bed material, respectively ([69], see Table 5.3). In this thesis, in addition to the studies described in the papers, the influences of an active bed material (activated olivine) on the degree of char gasification of wood pellets in the Chalmers gasifier (used for model validation) and in large-scale DFBG units are investigated. As there are no available reactivity data for the gasification of wood pellets in a bed of activated olivine, the process-assisted reactivity data for wood chip char in a bed of activated olivine, as determined in Paper V (see Table 6.2), are used. The structural parameters are set as being equal to those for fluidized bed steam gasification of wood pellets in silica sand, as given by Lundberg et al. [80].
5.3.1. Validation Data
Three sets of measurements conducted by Larsson et al. [1], Israelsson et al. [68], and Berdugo-Vilches et al. [69], respectively, in the Chalmers DFBG unit (see Figure 5.4) are used to validate the semi-empirical 1D model of the bottom bed of a BFB gasifier (described in Section 5.1). The unit consists of a 12-MW CFB combustor and a 2–4-MW BFB gasifier. Experimental data from the three aforementioned studies are listed in Table 5.3.
The degree of char gasification taken from Larsson et al. [1] was calculated from the carbon balance. The confidence interval (0%–10%) reflects uncertainties, primarily in the char yield (see Table 5.3). For the experiments conducted by Israelsson et al. [68] and Berdugo Vilches et al. [69],
, was estimated from the carbon in the raw gas, which was measured after letting the raw gas
pass through a high-temperature combustion reactor [82] that converted the gas to a mix of exclusively CO, CO2, H2, and H2O:
, 1 F, · G
C, (5.8)
The uncertainty related to the char yield, as well as to the amount of carbon in the char (96% ± 4% [83]) yields a certain confidence interval for the values obtained using Eq. (5.8) (see Table 5.3). The amount of char circulated from the combustor to the gasifier is ignored, since it has been estimated as being rather low (0–0.12 kgchar,circ/kgfed char,gasifier ) [1].
25
26
Table 5.3. Experimental data from the studies used to validate the gasifier model.
Larsson et al. [1] Israelsson et al. [68] Berdugo-Vilches et al. [69] No. of measurements
used for validation 1 6 5
Tg,av 830°C 782°–823°C 804°–829°C
TH2O 140°C 110°C 106°C
SFR 0.78 kgH2O/kgF 0.44–0.64 kgH2O/kgF 0.54 kgH2O/kgF
ṁBM/ṁF 58 kgBM/kgF 31–35 kgBM/kgF 34–57 kgBM/kgF
Fuel Wood pellets Wood pellets Wood pellets
Bed material Silica sand Silica sand Activated olivine
Char yield 16% ± 2% (from [1]) 19% ± 1% (from Paper IV) 19% ± 1% (from Paper IV)
, 2% (from [1]) Calculated from Eq. (5.8) Calculated from Eq. (5.8)
Confidence interval , = 0–10% , ± 9% , ± 9%
27
6. Results and Discussion
6.1.
Results from the Laboratory-Scale Experiments
Experiments were conducted in the laboratory-scale BFB gasifier (described in Section 4) to determine the effects of different parameters on char gasification. The results from the experimental work are summarised in Table 6.1. The uncertainties in the experimental data, as indicated by the error bars in Figure 6.1, are due to repetitions and uncertainties in the gas analysers and char yields. While these uncertainties are present for all the experimental results in this section, they are not shown in the remainder of the figures and tables in order to simplify the qualitative comparisons of different experiments.
Table 6.1. Summary of results from the experimental work. The third column gives the effect of the studied parameter on the char gasification rate, Rg, at Xchar,g = 20%.
Investigated
parameter Details Effect on R
g(Xchar,g = 20%) Paper/Figure in thesis
Pyrolysis
atmosphere N2 vs. mixture of N2 and H2O Negligible IV/–
Batch size 5 vs. 10 wood pellets Some effect, with Rg slightly
higher for five pellets IV/–
Fuel axial
mixing Four cases investigated, see Figure 6.1 Up to 2.0-fold lower for the BS/IB case IV/Figure 6.1 Cooling after
pyrolysis Cooled char vs. non-cooled char Up to 1.5-fold higher for non-cooled fuel IV/–
Bed material Silica sand vs. fresh olivine Negligible V/–
Bed material Silica sand vs. activated olivine Up to 2.0-fold higher for activated olivine Vand 6.3 /Figures 6.2 Bed material
activation Fresh vs. activated olivine Up to 2.0-fold higher for activated olivine V/– Fuel moisture
content Moisture content (0%–40%) Negligible V/–
Fuel size
‘Large’, ‘medium’, and ‘small’ wood chips (see Paper V), with silica sand or activated olivine as bed material
Up to 2.0-fold higher for the
small fuel particles V/Figure 6.3
Fuel structure Intact vs. crushed wood pellets Up to 1.5-fold higher for crushed pellets IV/Figure 6.4
As is evident from Table 6.1, the pyrolysis atmosphere, the fuel moisture content, and switching the bed material from fresh silica sand to fresh olivine all had negligible effects on the char gasification rate. The batch size had some effect on the char gasification rate, which is in line with previous studies (according to Qin and Thunman [30], at least 10 randomly picked pellets should be used to avoid batch variations). Cooling of the fuel after pyrolysis resulted in significantly lower
28
gasification rates compared to using non-cooled char, which is in agreement with previous studies (see for example, [24]).
Figure 6.1 shows the effects of fuel axial mixing during pyrolysis and char gasification on the char gasification rate. Pyrolysis on the bed surface and char gasification inside the dense bed (Case 3) result in a char gasification rate that is up to 2-fold lower than the corresponding rates for the other three cases. This is likely due to that the heat transfer to the fuel particles during pyrolysis is lower on the bed surface than inside the dense bed, whereas the level of steam-char contact during char gasification is lower inside the dense bed than on the bed surface. The combination of these two effects results in chars that are less porous and thus less reactive than chars that experience the conditions of any of the other three cases in Figure 6.1.
Figure 6.1. Effect of fuel axial mixing on the char gasification rate for wood pellets.
Figures 6.2 and 6.3 show the conversion profiles of wood chip chars at four temperatures and for three fuel particle sizes (large, medium, and small, see Paper V for size definitions), respectively, using silica sand or activated olivine as bed material. As shown in Figure 6.2, the char gasification rate is higher for activated olivine at all the temperatures applied owing to the catalytic effect of the ash layer covering the activated olivine particles.