Procedia - Social and Behavioral Sciences 96 ( 2013 ) 881 – 885
1877-0428 © 2013 The Authors. Published by Elsevier Ltd. Open access under CC BY-NC-ND license. Selection and peer-review under responsibility of Chinese Overseas Transportation Association (COTA). doi: 10.1016/j.sbspro.2013.08.100
ScienceDirect
13th COTA International Conference of Transportation Professionals (CICTP 2013)
Development of traffic safety evaluation method based on
simulated conflicts at signalized intersections
Huanyun Zhou
a, Fei Huang
b*
aSchool of Transportation, Southeast University, Sipailou #2, Nanjing, 210096, P. R. China bTransportation Plan Design & Research Institute, Southeast University, Nanjing, 210096, P. R. China
Abstract
In this study simulated conflicts were used to pre-evaluate the safety performance of signalized intersections. A signalized intersection was selected and the traffic operation was simulated in VISSIM simulation system according to the field traffic information. Then the output vehicle trajectory file was analyzed by Surrogate Safety Assessment Model (SSAM) to identify simulated conflicts. Simulated conflicts generated by the VISSIM simulation and identified by SSAM were compared to the traffic conflicts measured in the field, and a two-stage calibration procedure was carried out to improve the goodness-of fit between these two conflicts. After calibration and validation, the remedial measure for this intersection, reducing the speed limit from 60 km/h to 50 km/h, were applied in the VISSIM simulation model. Comparing the simulated conflicts under different speed limits, it was found that the safety performance of this intersection was improved after reducing the speed limit.
© 2013 The Authors. Published by Elsevier B.V.
Selection and/or peer-review under responsibility of Chinese Overseas Transportation Association (COTA).
Keywords: Simulated Conflicts; Traffic Safety Evaluation; Surrogate Safety Assessment Model; Calibration and Validation;
1. Background
With the increasing complexity of traffic system operation and advances in computational technology, microscopic simulation models are being widely used by traffic engineers in recent years. Microscopic simulation can be used to evaluate alternative time plans and geometric changes without disrupting existing traffic, or put people at risk. Compared with other traffic analysis tools, microscopic simulation programs can provide comprehensive results for an entire study area and on-line visualization (Milam, R.T., and Choa, F., 2000).
The majority of traffic simulation models have been specifically developed for traffic efficiency evaluation
* Corresponding author. Tel.: +1-370-514-5800.
E-mail address: [email protected]
© 2013 The Authors. Published by Elsevier Ltd. Open access under CC BY-NC-ND license.
which primary focus on capacity. Recently, there has been an interest in applying traffic simulation models to traffic safety. Traditional traffic safety analysis heavily relies on the collection of accident fatalities and injuries and their related socio-economic values. Given the infrequent and random nature of accidents, this approach takes a long time to reflect the safety effect of either the roadway design or the flow control strategy. This approach is also not applicable to assess the safety of roadway designs that have yet to be built or flow control strategies that have yet to be applied in the field. The dynamic nature of simulation, in theory at least, has the potential to provide a highly useful platform for this prospective short-term safety analysis (Archer, J., and Kosonen, I., 2000).
Since simulation has been identified as having a potential for traffic safety analysis (Lieberman E., and Rathi,
A.K., 2001), there has been little progress in the field of wha
-f variance; 2) identifying suitable and relative safety indicators which can be extracted from microscopic simulation models (Archer, J., and Kosonen, I., 2000).
More recently, a research project sponsored by the Federal Highway Administration (FHWA) of the United States investigates the potential for deriving surrogate safety measures from existing microscopic simulation models (Gettman, D. et al., 2008). The process of computing safety indicator measures, extracting the required data and summarizing the results is donated as the Surrogate Safety Assessment Methodology (SSAM).In that study, five surrogate safety measures were used in SSAM to evaluate the severity of a simulated conflict, including time to collision (TTC), post encroachment time (PET), deceleration rate (DR), maximum speed (MaxS) and the time differential (DeltaS). A conflict is recorded in SSAM when the minimum TTC and PET values exceed the predetermined threshold values, and the conflict type associated with each conflict is identified according to the link information and the angle between the two converging vehicles. In addition, the study examined nine multi-purpose microscopic simulations (MPMS) for potential use as tools for assessing traffic safety, and the following four were made compatible with the SSAM approach, namely, VISSIM, PARAMICS, TEXAS and AIMSUN.
In our previous study, we investigated the potential of using microscopic simulation models and SSAM for evaluating the safety performance of signalized intersections (Huang et al., 2012). A two-stage procedure was proposed to develop, calibrate and validate VISSIM simulation models. It was found that the two-stage calibration procedure greatly improved the goodness-of-fit between simulated conflicts and real-world conflicts. In this study, the procedure of safety evaluation based on simulated conflicts at signalized intersections was further investigated.
2. Field data collection
A two-phase signalized intersection was selected in in Nanjing area in China. The following criteria were considered in the site selection process:
The selected intersection should have little pedestrian traffic since only the conflicts between vehicles are considered in this study;
There was no on-street parking;
There was on unusual sight distance restriction. Field data collected in the field included the traffic and geometric information which would be used to setup, calibrate and validate VISSIM simulation models, as well as traffic conflicts.
Geometric characters of the selected intersections were measured using a measuring wheel. The free flow speeds upstream the intersection and the turning speeds of turning vehicles were directly measured in the field using a radar gun. Traffic volumes and traffic conflicts were extracted from the recorded video tapes in the
laboratory. According to the definition of conflict, traffic conflicts were extracted from the video tapes by identifying vehicles evasive actions, such as obvious braking and swerving. Normal stopping for red traffic signal and precautionary braking should be excluded. There are two major types of conflict observed in the selected sites, including the rear-end conflicts and the crossing conflicts.
3. Development of VISSIM simulation model
The selected intersection is a two-phase signalized intersection. The left-turning vehicles are provided during permitted phases, and obviously the left-turning drivers must yield to the right-of-way of the through traffic streams. VISSIM designates the right-of-way for conflicting movements with the use of priority rules. A priority rule consists of one stop line and one or more conflict markers that are associated with the stop line (PTV, 2006). Two parameters determine whether left-turning vehicles can cross the stop line, including headway (distance) and gap time. The headway is determined by the distance between the conflict marker and the first vehicle approaching it, while the gap time is determined every time step by the time an approaching vehicle requires to reaching the conflict marker (PTV, 2006). Using the turning speed data measured in the field, reduced speed areas for right turn (15-20km/h) and left turn movements (20-25km/h) were also included in the simulation model 3.1. Initial calibration of the VISSIM simulation model
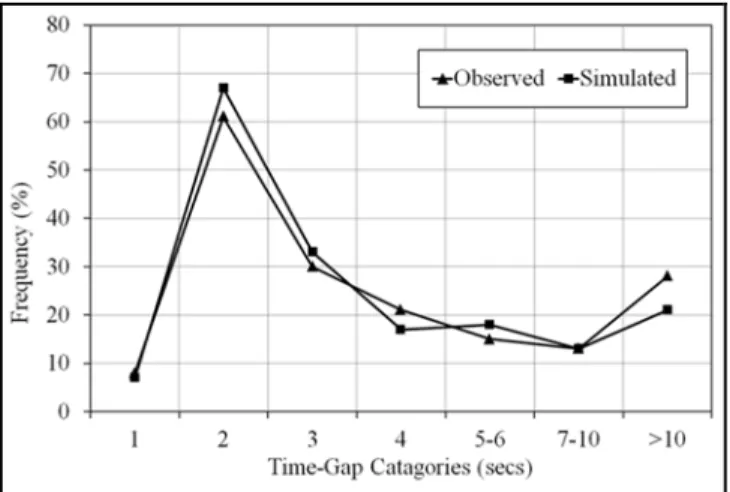
The initial calibration started from comparing the time-gap distributions observed in the field to those in the simulation models to ensure a reasonable gap-acceptance process in the simulation model. Sensitivity analysis was conducted to identify the crucial parameters in VISSIM which significantly affected the time-gap distributions. It was found that the additive and multiplicative parts of the desired safety distance in Wiedemann 74 car-following model are the most significant parameters. The Pearson chi-square test showed that the difference of time-gap distributions is minimized when the value of additive and multiplicative parts of the desired safety distance equal to 2.5 and 6 individually, as shown in Figure 1.
Fig. 1. Distributions of observed and simulated time-gaps 3.2 Second-stage calibration of the VISSIM simulation model
replicate the traffic conflicts observed in the field. The mean absolute percent error (MAPE) was used to measure the differences between the observed and the simulated conflicts. The MAPE value can be estimated by using the following equation: 1 1 i i ci c n m cf MAPE i ni c f (1)
Wherenrepresents the number of observations, FL
Prepresents the number of the simulated conflicts for time
interval i, and L I
F is the number of the traffic conflicts observed in the field during time intervali.
The overall MAPE value was found to be 35.2% for the total conflicts, indicating an inadequate consistency between the simulated conflicts generated using the initially calibrated VISSIM simulation models and the field measured traffic conflicts. According to the sensitivity analysis results, the threshold value of TTC in SSAM and the minimum gap time defined in VISSIM have great impact on the number of the simulated rear-end conflicts and crossing conflicts. An iterative procedure was then followed to find out the optimum TTC value and minimum gap time to minimize the differences between the simulated and observed conflicts.
As shown in Figure 2, when the value of TTC and minimum gap time were set to 1.6 s and 2.0s separately, the MAPE value for the total conflicts was reduced from 35.2% to 9.3%. More specifically, the MAPE value was reduced from 47.8% to 15.0% for the rear-end conflicts and from 29.0% to 6.5% for the crossing conflicts.
Fig. 2. Comparison of observed and simulated conflicts
4. Assessment of remedial measure
In order to improve the safety performance of the selected intersection, the speed limit was supposed to be reduced from 60 km/h to 50 km/h. This speed control strategy was applied into the VISSIM simulation model, and the trajectory data was used for SSAM analysis.
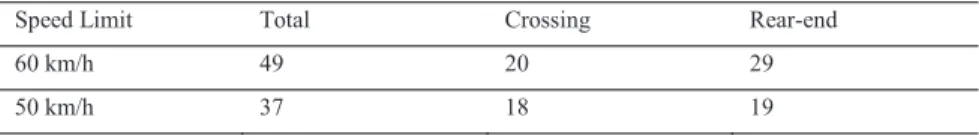
As shown in Table 1, the total number of simulated conflicts and the distribution of conflict types are affected. The total number of simulated conflicts decreased 24.5% as the speed limit is lowered. More specifically, the numbers of crossing conflicts and rear-end conflicts decreased 10.0% and 34.5% separately. Based on the
conclusion that there is a good correlation between simulated conflicts and observed conflicts in our former studies, it can be deduced that the safety performance of this intersection was improved as the speed limit is lowered.
Table 1 Simulated conflict numbers for different speed limits
Speed Limit Total Crossing Rear-end
60 km/h 49 20 29
50 km/h 37 18 19
5. Conclusion
This research presented a new way to pre-evaluate the safety performance of intersection improvement strategies using VISSIM and SSAM, and the procedure was exemplified by a signalized intersection. After a two-stage calibration, the speed limit, reducing the speed limit from 60 km/h to 50 km/h, was applied in the intersection simulation model. By comparing the simulated conflicts, it was found that the safety performance of this intersection was improved.
References
Archer, J., and Kosonen, I., (2000) The potential of micro-simulation modeling in relation to traffic safety assessment. Conference presentation, ESS Conference 2000 Proceedings, Germany.
Gettman, D. et al. (2008) Surrogate safety assessment model and validation: final report. FHWA-HRT-08-051, 2008
Huang, F., et al. (2012). tifying if VISSIM simulation model and SSAM provide reasonable estimates for field measured traffic conflicts August 2012,
Lieberman E., and Rathi, A.K. (2001). Traffic Simulation, in N. Gartner, C.J. Messner, and Rathi A.K. (Eds.) Traffic Flow Theory, Transportation Research Board Special Report.
Milam, R.T., and Choa, F., (2000). Recommended Guidelines for the Calibration and Validation of Traffic Simulation Models, Fehr and Peers Associates Inc., Roseville, CA, USA.