Validating HCS and SIDRA Software for Estimating Delay at
Signalized Intersections in Jordan
Bashar H. Al-Omari 1) and Madhar M. Ta’amneh2)
1)
PhD
,
Trafficand
Transportation Manager,
Gulf Engineering House,
P. O. Box 27108 Riyadh 11417,
Kingdom of Saudi Arabia,
Tel: + 966-14537171 Ext 307,
Fax: + 966-14539292,
Mobile: 00966500315142E-Mail: [email protected] (Corresponding Author).
2)
Graduate Research Assistant, Civil Engineering Department, University of Texas at El-Paso, Texas, USA.
ABSTRACT
The main objective of this research was to validate the Highway Capacity Software (HCS) and the Signalized and Unsignalized Intersection Design and Research Aid (SIDRA) Software which are widely used for estimating delay at signalized intersections in Jordan.
Fifty four hours of data from eighteen legs at five signalized intersections were collected from Irbid city; the second largest city in Jordan. Traffic volumes and control delay were measured during peak and off-peak periods using video cameras. Data on geometric design elements, signal timings and phasings and vehicular speeds were measured through a field survey.
The results of the analysis indicated that both models can be improved significantly by calibrating the basic saturation flow rate or bus PCE factor. However, the best improvement was obtained by calibrating both the basic saturation flow rate and the bus PCE factor simultaneously. It was also found that the two software are good predictors for control delay at signalized intersections in Jordan after calibration. However, SIDRA was found to be better than HCS 2000.
Keywords: HCS, SIDRA, Signalized Intersections, Delay.
1. INTRODUCTION
The traffic performance of a roadway network is greatly influenced by the traffic flow through intersections. Many types of traffic control are being used worldwide at intersections such as yield signs, stop signs, roundabouts and signals. Similar to other countries, many traffic signals are installed in Jordan at intersections with moderate and heavy traffic volumes.
Traffic signals are used to provide safe and efficient traffic flow through intersections, along routes and in street networks. They increase the traffic handling capacity of an
intersection, reduce traffic delay and enhance safety, reduce certain types of accidents (most notably right-angle collisions), improve the orderly movement of traffic, interrupt extremely heavy flows to permit the crossing of minor movements that could not otherwise safely pass through an intersection and help in establishing a signal progression (Maryland Roads, 2003).
Vehicle delay is perhaps the most important parameter used by transportation professionals to measure the performance of signalized intersections. The Highway Capacity Manual (HCM) uses control delay as a criterion for determining the level of service provided to motorists by the traffic signals. This is because delay is a measure of performance that a driver can directly feel and
Received on 1/8/2007 and Accepted for Publication on 1/10/2007.
react to. Moreover, both traffic professionals and the general public can easily comprehend its meaning.
There are many tarffic software that can be used for estimating delay at signalized intersections. However, traffic departments need to check the validity of these software before using them, especially developing countries which have very little work on the validity of these software.
Highway Capacity Software (HCS) and Signalized Intersection Design and Research Aid (SIDRA) are being used by the Jordanian Traffic Departments without any field validation. The main objectives of this research are: to evaluate the two software (HCS and SIDRA) for estimating delay at signalized intersections in Jordan based on field delay data to determine the most suitable software which represents the Jordanian conditions in estimating the signalized intersection delay and to find out if these models can be calibrated to better represent the Jordanian conditions.
A total of five signalized intersections were selected to perform this study. The five intersections were chosen at different locations in Irbid city. The selection process was based on intersection configuration (four and three legs) and control type (pre-timed and actuated). It should be noticed that field delay measurements were conducted for under-saturated traffic flow conditions to be consistent with the HCM standard method of field delay data measurement. The cases of saturated and over-saturated conditions were not covered by this research.
2. LITERATURE REVIEW
The Highway Capacity Software (HCS) implements signalized intersection analysis of the Highway Capacity Manual (HCM). Data input requirements include intersection geometry, traffic characteristic and signal characteristics (timing and phasing). Major outputs include average control delay and level of service at the movement, approach and intersection levels.
The 1985 and 1994 versions of the HCM used the stopped delay as a criterion for determining the LOS at signalzied intersections (TRB, 1985; TRB, 1994). The 1997 and 2000 versions of the HCM replaced the stopped
delay by the control delay (TRB, 1997; TRB, 2000). Control delay is the difference in travel time between the case when a vehicle is unaffected by the intersection control (no stopping or deceleration) and when a vehicle is affected by the intersection control. This delay includes lost time due to deceleration and acceleration as well as stopped delay.
Many researchers tried to validate the HCM using field data and/or simulation. Temply (1989) compared calculated and measured delay values using different methods and found that a perfect match between calculated and measured delay can not be expected. However, he concluded that despite these complexities, delay remains a good traffic-engineering tool, provided it is calculated, measured and used in a consistent fashion.
Braun and Ivan (1996) made a comparison between 1985 and 1994 editions of the Highway Capacity Manual (HCM) based on field measurements of average stopped delay. They found that the 1994 HCM better estimates intersection stopped delay than the 1985 HCM.
Yanaguaya (1993) studied and described the applicability of the U.K. transport models in the third world countries. He concluded that many difficulties appear when using these models in the developing countries. He referred these difficulties to the inequality in socio-economic, political and traffic-related issues between developed and developing.
Rouphail (1997) investigated the validation of a generalized delay model that was developed for vehicle-actuated traffic signals using TRAF-NETSIM and field data. He found that the generalized delay model was comparable to NETSIM and observed delay in the field. Also, he recommended using the generalized delay model as an alternative to the delay model used in the 1994 HCM.
Engelbrecht (1997) studied the validation of another generalized delay model for oversaturated conditions. He used the TRAF-NETSIM microscopic simulation model to verify the generalized delay model equation under oversaturated conditions. He compared the estimated delay with 1994 HCM delay and found that the 1994 HCM equation is valid for a degree of saturation of less than 1.0, but may be used with caution for degrees of
saturation of up to 1.2.
Taale and Zuylen (2001) evaluated the validity of the 1997 HCM delay model for Dutch intersections based on simulation and field data. Based on field data, they found that HCM gives a good estimation of delay for a degree of saturation of less than 0.8 and has a severe overestimation of delay for higher degrees of saturation.
The Signalized and Unsignalized Intersection Design and Research Aid (SIDRA) Software is an intersection-based program developed by the Australian Road Research Board (ARRB) in Australia as an aid for capacity, timing and performance analysis of isolated intersections. SIDRA is a very powerful analytical program for signalized intersections.
Latinopoulou and Mustafa (1992) evaluated the validity of HCM and SIDRA for the estimation of delay based on field data. They found that the two software can produce good delay estimates for through movements for a volume/capacity ratio of less than 1.0, while they both fail to give a good estimation of delay for a volume/capacity ratio of more than or equal to 1.0 regardless of the type of movement.
3. DATA COLLECTION AND REDUCTION
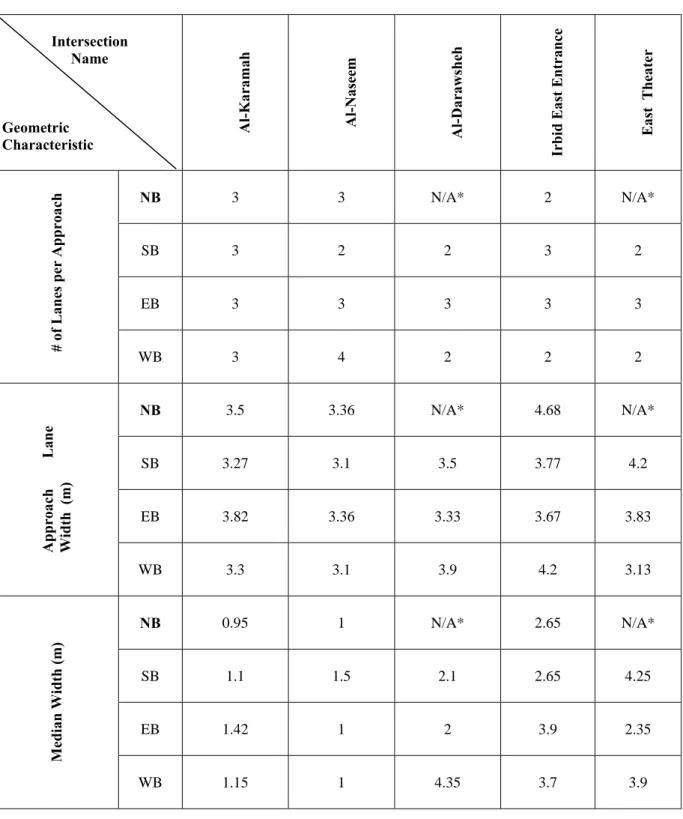
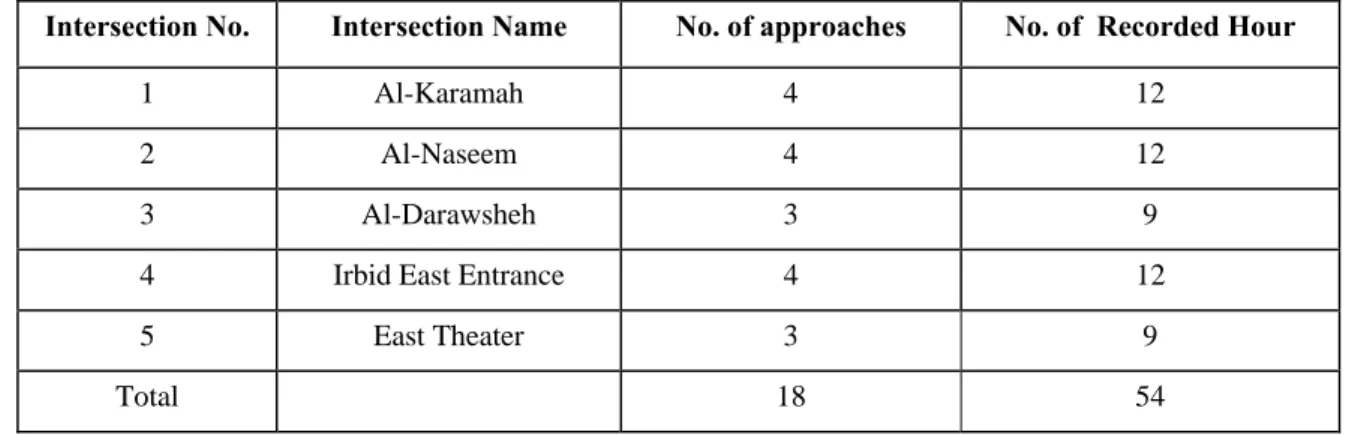
A total of 54 hours of data were collected from 18 approaches at 5 signalized intersections in Irbid city, Jordan. Intersections were selected based on the maps and traffic counts provided by Irbid Municipality. By looking at the plots of traffic volumes versus time at each intersection, it was possible to determine differnt levels of traffic volumes: low, moderate and high, in order to cover a wide range of data. Geometric characteristics were obtained through field measurements during off peak periods. Intersection geometry included number of lanes, lane width, island width, … etc. as shown in Table (1). Data were collected during the sunny days in the spring of the year 2002 from locations with good pavement conditions.
Traffic volumes and queue lengths on each intersection approach (one approach at a time) were simultaneously recorded using a video camera. A camera that was located in a position to be able to observe the
queue activity of the subject approach and the volumes of both the subject and other approaches was used to videotape each sample site. This has produced a total of 54 hours of data distributed as shown in Table (2).
Free-flow speed (85th percentile of 100 observations) was measured using radar gun for each approach of the five signalized intersections and the results are shown in Table (3). The effect of pedestrians was not taken into account in this study due to the very low pedestrians' volumes at the selected locations.
The volumes of traffic on the subject and other approaches were counted while observing the videotapes. At the same time, the queue length (number of vehicles between the stop line and the end of the standing queue) for the subject approach was measured based on a time interval of 15 seconds. A vehicle was considered as having joined the queue when it approached within one car length of a stopped vehicle and was itself about to stop (TRB, 2000). The counting process was repeated every 15 seconds during the study period using a count down-repeat timer on a digital watch to signal the count time. Observations were then averaged over 15 minutes time intervals to calculate control delay using the HCM standard procedure (TRB, 2000). All selected signals had the directional phasing system (one approach at a time), so the effect of phasing system was not considered in this study.
4. METHODOLOGY A. Software Validation
The collected traffic, geometric and timing data were used as inputs to the HCS and SIDRA software and the control delay was obtained. The software results were compared with the measured field control delay using graphs, regression analysis and paired t-test.
B. Software Calibration
The authors believe that the major sources of deficiency in the software control delay estimates come from the basic saturation flow rate value and bus PCE factor. So an effort was made to calibrate them for the Jordanian conditions as follows:
1. The basic saturation flow rate was measured following the HCM standard procedure (TRB, 2000) using the through movement on the intersection approaches that were believed to be the closest to ideal conditions. As a result, the basic saturation flow rate was averaged to 2200 pcphgpl. This high value can be explained by knowing the aggressive driver behavior in Jordan which results in reducing the vehicle headways leading to an increase in the saturation flow rate.
2. The two software treat busses as heavy vehicles without differentiating small and large busses. In Jordan and especially in Irbid city, busses constitute a large proportion of the traffic fleet and the majority of them are of the small type (around 20 passengers). It is believed that the small busses should have a lower PCE factor than the large busses and trucks. In a previous Jordanian study, Al-Omari et al. (2001) recommended using a PCE value of 1.5 for small busses. The volumes of small busses were adjusted using this PCE value to see the effect of this calibration on the accuracy of software control delay estimation.
The two software parameters were calibrated separately and simultaneously to find their effects on the estimation of control delay.
5. SOFTWARE VALIDATION AND CALIBRATION
HCS 2000 Software
The geometric, traffic and signal input data were entered into HCS 2000 software to estimate the predicted control delay to compare it to the field control delay based on the 15 minutes time interval and 216 observations.
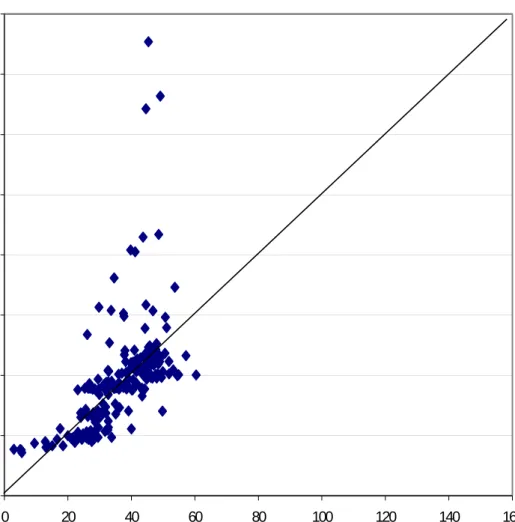
Using the default saturation flow rate and bus PCE value, the relationship between the field and predicted delays is shown in Figure (1). It can be seen that, for low delay ranges (up to 20 seconds), HCS tends to over-estimate control delay. For higher delay ranges, it has a mix of under-estimations and over-estimations, with
some points that are severely over-estimated. The measured field delays were regressed against the predicted ones producing the results shown in Table (4). The intercept is significantly different from zero and the slope is significantly different from 1.000 at 95% confidence. The R² value indicated that HCS explains only about 21.6% of the variability in control delay. The paired t-test was also used to see if the average deviations between filed and predicted control delay are significantly far from zero. The results, as shown in Table (5), showed that the mean of differences is –10.29 sec., with a P-value of 0.000, so the hypothesis that the deviations are equal to zero is rejected at 95% confidence.
Using a PCE value of 1.5, the volumes of small busses were adjusted and entered into the software. The results of the comparison between field and predicted delays are shown in Figure (2). For low delay ranges (up to 20 seconds), HCS still over-estimates control delay. For higher delay ranges, HCS has a mix of under-estimations and over-under-estimations, with some points that are severely estimated. However, the over-estimation problem has now been decreased. The measured field delays were regressed against the predicted ones producing the results shown in Table (4). The intercept is significantly different from zero and the slope is significantly different from 1.000 at 95% confidence. The R² value indicated that HCS explains about 37.9 % of the variability in the control delay. This is higher than the R² value obtained using default values. The paired t-test results, as seen in Table (5), showed that the mean of differences is –3.27 sec., with a P-value of 0.002, so the hypothesis that the deviations are equal to zero is rejected at 95% confidence. It should be noted that the mean deviation (-3.27) is smaller than that obtained using the default values (-10.29).
Another calibration was conducted for the HCS software regarding the basic saturation flow rate, which has a default value of 1900 pcphgpl. The results of the comparison between filed and predicted delays, based on a saturation flow rate of 2200 pcphgpl, are shown in Figure (3). It can be seen that the over-estimation
problem has now been decreased. The field delays were regressed against the predicted ones, producing the results shown in Table (4). The intercept is significantly different from zero and the slope is significantly different from 1.000 at 95% confidence. The R² value indicated that HCS explains about 34.5 % of the variability in the control delay. This is higher than the R² value obtained using default values and less than the value obtained using calibrated bus PCE factor. The paired t-test results, as seen in Table (5). showed that the mean of differences is –1.78 sec., with a P-value of 0.091, so the hypothesis that the deviations are equal to zero is accepted at 95% confidence.
The two calibrations (basic saturation flow rate and bus PCE factor) were also combined together to find their effect on the HCS delay estimation. The results of the comparison between measured and estimated delays are shown in Figure (4). It can be seen that for low delay ranges (up to 20 seconds), HCS slightly over-estimates the control delay. For higher delay ranges, HCS has a mix of under-estimations and over-estimations. But at this time, there are no points that are severely over-estimated. The field delays were regressed against the predicted ones producing the results shown in Table (4). The intercept is significantly different from zero and the slope is significantly different from 1.000 at 95% confidence. The R² value indicated that HCS explains about 55 % of the variability in the control delay. This is higher than the value obtained using default values. The paired t-test results, as seen in Table (5), showed that the mean of differences is 1.78 sec., with a P-value of 0.002, so the hypothesis that the deviations are equal to zero is rejected at 95% confidence.
From the previous analysis and results, it can be concluded that calibrating the basic saturation flow rate and/or bus volumes enhanced the HCS 2000 delay prediction.
SIDRA Software
Using the default saturation flow rate and bus PCE factor, the relationship between the measured field and predicted delays is shown in Figure (5). It can be seen
that, for low delay ranges (up to 10 seconds), SIDRA slightly over-estimates the control delay. In the (10 to 25) sec/veh ranges, SIDRA has a good estimation of the control delay. In the higher ranges, SIDRA has a mix of under-estimations and over-estimations with some points that are severely over-estimated. The field delays were regressed against the predicted ones producing the results shown in Table (6). The intercept is significantly different from zero and the slope is significantly different from 1.000 at 95% confidence. The R² value indicated that SIDRA explains only about 33.6 % of the variability in control delay. The paired t-test results, as shown in Table (7), showed that the mean of differences is –1.697 sec., with a P-value of 0.087, so the hypothesis that the deviations are equal to zero is accepted at 95% confidence.
Based on the 1.5 value for bus PCE factor, the results of the comparison between measured and estimated delays are shown in Figure (6). For low delay (up to 15 seconds) SIDRA slightly over-estimates the control delay. In the (15 to 25) sec/veh ranges, SIDRA has a good estimation of the control delay. In the higher delay ranges, SIDRA has a mix of under-estimations and over-estimations. It should be noted that there is a noticeable reduction of data points scattering due to bus volume reduction. The field delays were regressed against the predicted ones producing the results shown in Table (6). The intercept is significantly different from zero and the slope is significantly different from 1.000 at 95% confidence. The R² value indicated that SIDRA explains about 57.2% of the variability in the control delay. This is higher than the value obtained using default values. The paired t-test results, as shown in Table (7), showed that the mean of differences is 0.938 sec., with a P-value of 0.076, so the hypothesis that the deviations are equal to zero is accepted at 95% confidence.
The default value of the basic saturation flow rate used by SIDRA was 1950 pcphgpl. The results of the comparison between measured and estimated delays, based on saturation flow rate of 2200 pcphgpl, are shown in Figure (7). It can be seen that, for low delay ranges (up to 10 seconds), SIDRA slightly over-estimates the control
delay. In the (10 to 25) sec/veh ranges, SIDRA has a good estimation of the control delay. In the higher delay ranges, SIDRA has a mix of under-estimations and over-estimations. It should be noted that there is a noticeable reduction of data points scattering due to the use of the calibrated basic saturation flow rate. The field delays were regressed against the predicted ones producing the results shown in Table (6). The intercept is significantly different from zero and the slope is significantly different from 1.000 at 95% confidence. The R² value indicated that SIDRA explains about 52.9 % of the variability in the control delay. This is higher than the R² value obtained using default values and less than the value obtained using calibrated bus PCE factor. The paired t-test results, as shown in Table (7), showed that the mean of differences is 1.08 sec., with a P-value of 0.065, so the hypothesis that the deviations are equal to zero is accepted at 95% confidence.
The two calibrations (basic saturation flow rate and bus PCE factor) were also combined together to find their effect on SIDRA delay estimation. The results of the comparison between field and estimated delays are shown in Figure (8). It can be seen that for low delay ranges (up to 15 seconds) the SIDRA slightly over-estimates the control delay. In the (15 to 25) sec/veh ranges, SIDRA has a good estimation of the control delay. In the higher delay ranges, SIDRA has a mix of under-estimations and over-estimations. It should be noted that there is a noticeable reduction of data points scattering due to the use of the two calibrations. The field delays were regressed against the predicted ones producing the results shown in Table (6). The intercept is significantly different from zero and the slope is significantly different from 1.00 at 95% confidence. The R² value indicated that SIDRA explains about 64.3 % of the variability in the control delay. This is higher than the values obtained using default values or each calibration separately. The paired t-test results, as shown in Table (7), showed that
the mean of differences is 2.38 sec., with a P-value of 0.000, so the hypothesis that the deviations are equal to zero is rejected at 95% confidence.
From the previous analysis and results, it can be concluded that calibrating the basic saturation flow rate and/or bus volumes enhanced SIDRA delay prediction.
6. CONCLUSIONS AND RECOMMENDATIONS
Field surveys were conducted to collect data on traffic volume, traffic speed, intersection geometry, signal timing and control delay for 54 hours from 18 approaches at 5 signalized intersections in Irbid city, Jordan. Traffic volume and delay data were collected through videotaping, traffic speed data were collected using radar gun and geometric data were collected by field surveys.
The results of the analysis showed that, for low delay ranges, HCS tends to slightly over-estimate control delay; while SIDRA has a predicted control delay that is in good agreement with the field data. At higher delay levels, HCS has noticeable scattered predictions as compared to field data with more tendency to over-estimation, while SIDRA provides less scattering than HCS.
It was found that the two models can be improved significantly by calibrating bus PCE factor or the basic saturation flow rate. However, the best improvement could be obtained by calibrating both the basic saturation flow rate and bus PCE factor, simultaneously. It can be concluded that the two software can be used for traffic analysis in Jordanian conditions after calibrating both the saturation flow rate and bus PCE factor. However, SIDRA showed a better performance than HCS.
This study showed that traffic software, which are being used in the developed countries, should not be used in Jordan or other developing countries before calibrating their parameters that are believed to be different from those in developed countries such as the ones related to driver behavior.
Table 1. Geometric Characteristics of the Selected Intersections. Intersection Name Geometric Characteristic Al -K ar ama h Al-Nasee m Al -D ar aw she h Irbid Eas t En trance Ea st Thea ter NB 3 3 N/A* 2 N/A* SB 3 2 2 3 2 EB 3 3 3 3 3 # of Lane s per Ap proach WB 3 4 2 2 2 NB 3.5 3.36 N/A* 4.68 N/A* SB 3.27 3.1 3.5 3.77 4.2 EB 3.82 3.36 3.33 3.67 3.83 Appr oach Lane Width (m) WB 3.3 3.1 3.9 4.2 3.13 NB 0.95 1 N/A* 2.65 N/A* SB 1.1 1.5 2.1 2.65 4.25 EB 1.42 1 2 3.9 2.35 Media n Wid th (m ) WB 1.15 1 4.35 3.7 3.9
Table 2. The Selected Intersections and Their Number of Collected Hours of Data. Intersection No. Intersection Name No. of approaches No. of Recorded Hour
1 Al-Karamah 4 12
2 Al-Naseem 4 12
3 Al-Darawsheh 3 9
4 Irbid East Entrance 4 12
5 East Theater 3 9
Total 18 54
Table 3. Free-Flow Speed (85 Percentile) Data. Free-flow speed (Km/h) Intersection Name NB SB EB WB Al-Karamah 71 66 63 54 Al-Naseem 60 53 40 52 Al-Darawsheh N/A* 63 64 69
Irbid East Entrance 61 59 66 65
East Theater N/A* 64 47 61
* No approach lanes in this direction (T-Intersection).
Table 4. Regression Results of Actual and HCS2000 Delay Time.
Delay based on Intercept βo Slope β1 R² % SEE
(Default values) (Bus PCE Factor = 1.5) (BSFR* = 2200 pcphgpl) (50 % of buses and 2200 pcphgpl) 28.94 22.846 23.503 14.288 0.15 0.333 0.33 0.633 21.6 37.9 34.2 55.0 9.43 8.392 8.623 7.144
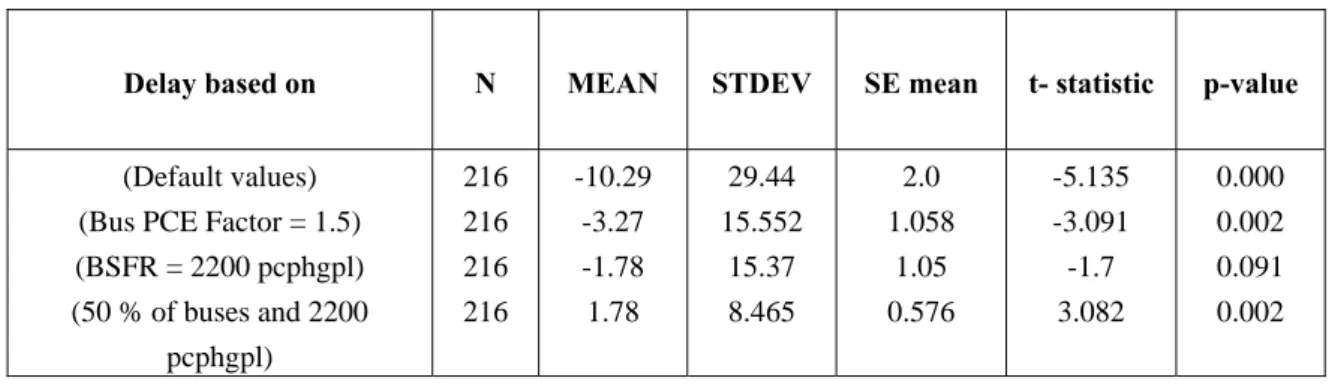
Table 5. Comparison of Actual and HCS 2000 Control Delay Prediction.
Delay based on N MEAN STDEV SE mean t- statistic p-value
(Default values) (Bus PCE Factor = 1.5) (BSFR = 2200 pcphgpl) (50 % of buses and 2200 pcphgpl) 216 216 216 216 -10.29 -3.27 -1.78 1.78 29.44 15.552 15.37 8.465 2.0 1.058 1.05 0.576 -5.135 -3.091 -1.7 3.082 0.000 0.002 0.091 0.002
Table 6. Regression Results of Actual and SIDRA Delay Time.
Delay based on Intercept βo Slope β1 R² % SEE
(Default values) (Bus PCE Factor = 1.5) (BSFR = 2200 pcphgpl) (50 % of buses and 2200 pcphgpl) 22.891 11.580 13.771 7.513 0.346 0.696 0.635 0.847 33.6 57.2 52.9 64.2 8.678 7.00 7.306 6.359
Table 7. Comparison of Actual and SIDRA Control Delay Prediction.
Delay based on N MEAN STDEV SE mean t- statistic p-value
(Default values) (Bus PCE Factor = 1.5) (BSFR = 2200 pcphgpl) (50 % of buses and 2200 pcphgpl) 216 216 216 216 -1.697 0.944 1.077 2.38 14.52 7.79 8.534 6.53 0.988 0.530 0.581 0.444 -1.718 1.782 1.855 5.352 0.087 0.076 0.065 0.000
Figure (1): HCS 2000 Vs. Field Control Delay Time.
0
50
100
150
200
250
0
50
100
150
200
250
Measured Delay (sec/veh)
HCS
Del
ay
(se
c
/veh
)
Figure (2): HCS 2000 Vs. Field Control Delay (Calibrated Bus PCE Factor).
0
20
40
60
80
100
120
140
0
20
40
60
80
100
120
140
Measured Delay (sec/veh)
H
C
S
Del
a
y
(
sec/
veh)
Figure (3): HCS 2000 Vs. Field Control Delay Time (Calibrated BSFR ). 0 20 40 60 80 100 120 140 160 0 20 40 60 80 100 120 140 160
Measured Delay (sec/veh)
HCS Del a y ( sec/ veh )
Figure (4): HCS 2000 Vs. Field Control Delay Time ( Calibrated Bus PCE Factor and BSFR ). 0 10 20 30 40 50 60 70 80 90 0 10 20 30 40 50 60 70 80 90
Measured Delay (sec/veh)
HCS Del ay ( s e c /veh )
Figure (5): SIDRA Vs. Field Control Delay Time.
0 20 40 60 80 100 120 140 160 0 20 40 60 80 100 120 140 160Measured Delay (sec/veh)
SI DRA De la y ( s ec /v eh)
Figure (6): SIDRA Vs. Field Control Delay Time (Calibrated Bus PCE Factor).
0 10 20 30 40 50 60 70 80 90 0 10 20 30 40 50 60 70 80 90
Measured Delay (sec/veh)
S IDRA De la y ( sec/ veh )
Figure (7): SIDRA Vs. Field Control Delay Time (Calibrated BSFR). 0 10 20 30 40 50 60 70 80 90 100 0 10 20 30 40 50 60 70 80 90 100
Measured Delay (sec/veh)
S IDRA Del ay ( sec/ veh )
REFERENCES
Al-Omari, B., Al-Masaeid, H. and Al-Shawabkah, Y. 2001. Development of a Delay Model for Roundabouts in Jordan, MS Thesis, Department of Civil Engineering, Jordan University of Science and Technology, Irbid,
Jordan.
Braun, S. and Ivan, J. 1996. Estimating Intersection Approach Delay Using 1985 and 1994 Highway Capacity Manual Procedures, Transportation Research Record 1555, TRB, National Research Council, Washington D. C., 23-32.
Figure (8): SIDRA Vs. Field Control Delay Time (Calibrated Bus PCE Factor and BSFR) .
0 10 20 30 40 50 60 70 0 10 20 30 40 50 60 70
Measured Delay (sec/veh)
S ID R A D e la y (sec/ veh )
Engelbrecht, R., Fambro, D., Rouphail, R. and Barkawi, A. 1997. Validation of Generalized Delay Model for Oversaturated Conditions,Transportation Research Record 1572, TRB, National Research Council, Washington D. C., 122-130.
Latinopoulou, M. and Mustafa, M. 1992. The Accuracy of Estimating Delay at Signalized Intersections: A Comparison Between Two Methods, Traffic Engineering and Control, 306-311.
Maryland Roads. 2003. Traffic Signs and Signals, http://www.Marylandroads.com.
Rouphail, N., Anwar, M., Fambro, D., Sloup, P. and Perez, C. 1997. Validation of Generalized Delay Model for Vehicle-Actuated Traffic Signals, Transportation Research Record 1572, TRB, National Research Council, Washington D. C., 105-111.
Taal, H. and Zuylen, H. 2001. Testing the HCM 1997 Delay Function for Dutch Signal Controlled Intersections, Presented at the 80th Annual Meeting of the Transportation Research Board, Washington D.C.
Temply, S. 1989. Accuracy of Delay Surveys at Signalized
Intersections, Transportation Research Record 1225, TRB, National Research Council, Washington D. C., 24-32.
Transportation Research Board. 1985. Highway Capacity Manual, Transportation Research Board, Special Report 209. Washington D.C.
Transportation Research Board. 1994. Highway Capacity Manual 1994 - Update. Transportation Research Board, Special Report 209. Washington D.C.
Transportation Research Board. 1997. Highway Capacity Manual 1997 - Update. Transportation Research Board, Special Report 209. Washington D.C.
Transportation Research Board. 2000. Highway Capacity Manual, HCM 2000. Transportation Research Board, National Research Council. Washington D.C.
TRB. 2000. Traffic Analysis Software Tools. National Research Council, Circular # E-CO14.
Yanaguaya, W. 1993. The Use of U.K. Transport Models in Developing Countries, Traffic Engineering and Control, 34: 476-479.