istat
working
papers
N.11
2015
ESSnet on Consistency of
Concepts and Applied Methods
of Business and Trade Statistics.
Work Package 3 (WP3):
Characteristics and
Definitions. Main Results and
Countries Comparisons
Roberto Gismondi, Fabiana RocciN.11
2015
ESSnet on Consistency of
Concepts and Applied Methods
of Business and Trade Statistics.
Work Package 3 (WP3):
Characteristics and
Definitions. Main Results and
Countries Comparisons
Roberto Gismondi, Fabiana Rocci
istat
working
papers
Tommaso Di Fonzo Andrea Mancini Roberto Monducci
Fabrizio Onida Linda Laura Sabbadini Antonio Schizzerotto
Comitato di redazione
Alessandro Brunetti Patrizia Cacioli Marco Fortini
Romina Fraboni Stefania Rossetti Daniela Rossi
Maria Pia Sorvillo
Segreteria tecnica
Daniela De Luca Laura Peci Marinella Pepe Gilda Sonetti
Istat Working Papers
ESSnet on Consistency of Concepts and Applied Mithods of Business and Trade Statistics. Word Pakage 3 (WP3): Characteristics and Definitions. Main results and Countries Comparisons.
N. 11/2015
ISBN 978-88-458-1841-7
© 2015
Istituto nazionale di statistica Via Cesare Balbo, 16 – Roma
Salvo diversa indicazione la riproduzione è libera, a condizione che venga citata la fonte.
Immagini, loghi (compreso il logo dell’Istat), marchi registrati e altri contenuti di proprietà di terzi appartengono ai rispettivi proprietari e
ESSnet on Consistency of Concepts and Applied Methods of
Business and Trade Statistics. Work Package 3 (WP3):
Characteristics and Definitions. Main Results and Countries
Comparisons
Roberto Gismondi, Fabiana Rocci
Sommario
L’ISTAT ha preso parte, tra il 2011 ed il 2013, al progetto europeo ESSnet Consistency. Il progetto si è articolato in 3 Work Packages (WPs), finalizzati ad approfondire diversi aspetti connessi ai rischi di non perfetta comparabilità tra i principali indicatori statistici a carattere economico pro-dotti correntemente dagli istituti nazionali di statistica. In questo contesto sono presentati e com-mentati i principali risultati ottenuti nel WP3, riferito all’analisi delle possibili inconsistenze deri-vate da problemi definitori relativi a 17 indicatori, 9 di carattere economico e 8 inerenti al merca-to del lavoro. Le inconsistenze sono state valutate sulla base di un questionario compilamerca-to da esperti di 32 stati europei, in cui il concetto di inconsistenza è stato sviluppato secondo due profili: l’inconsistenza “verticale” (divergenza tra definizione teorica di un indicatore e l’indicatore effet-tivamente calcolato) e quella “orizzontale” (divergenza tra le diverse definizioni sulla cui base lo stesso indicatore è calcolato e diffuso da fonti statistiche diverse). Elaborazioni originali hanno riguardato le modalità di presentazione dei risultati ed elaborazioni specifiche per particolari rag-gruppamenti di stati.
Parole chiave: Comparabilità, Consistenza, Criteri di valutazione, Definizioni, Statistica uffi-ciale, Unione Europea
Abstract
ISTAT took part to the European Project ESSnet Consistency, developed between 2011 and 2013. It was articulated into 3 Work Packages (WPs), aimed at analyzing risks of not perfect comparability among the main statistical economic indicators currently produced by national statistical institutes. In this framework, the main WP3 results are presented and commented: they concern the analysis of potential inconsistencies due to definition problems related to 17 characteristics, 9 economic and 8 related to labour market. Inconsistencies have been evaluated on the basis of a questionnaire filled in by experts from 32 European countries. The inconsistency concept has been split into two profiles: “vertical” inconsistency (difference between theoretical definition of characteristics and how they are calculated in practice) and “horizontal” inconsistency (divergence between different definitions on the basis of which the same characteristic is calculated by different statistical sources). Original elaborations concern the presentation of main results and specific elaborations carried out for particular subgroups of countries.
Keywords: Comparability, Consistency, Definitions, European Union, Evaluation Criteria, Of-ficial Statistics.
Indice
Pag.
1. Foreword 6
2. Field of analysis: domains and variables ... 8
3. Inconsistencies: definitions, causes and reasons ... 10
4.
The questionnaire………... 125. Evaluation criteria ... 14
6. Main results ... 16
6.1 Vertical and horizontal inconsistencies ... 16
6.2 Relationship between vertical and horizontal inconsistency ... 20
6.3 Kind and reasons for vertical and horizontal inconsistencies ... 22
7. Final proposals: system and definitions ... 25
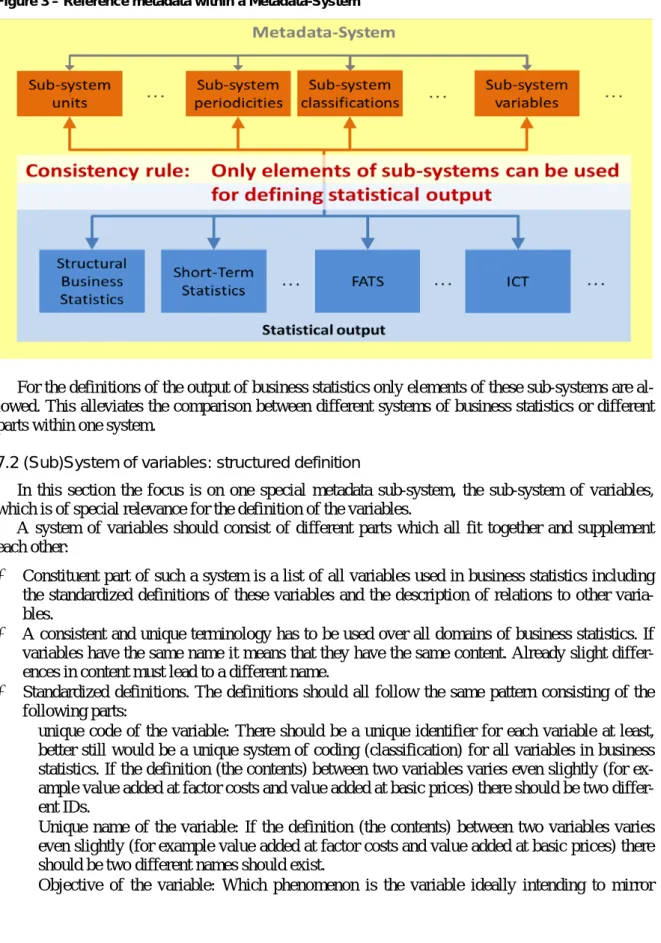
7.1 Systematic approach ... 25
7.2 (Sub)System of variables: structured definition ... 26
7.3 Resuming prospect ... 27
8. Perspective conclusions ... 32
1. Foreword
The MEETS programme is aimed at the Modernisation of European Enterprise and Trade Sta-tistics (Decision No 1297/2008/EC of the European Parliament and the Council of 16 December 2008). The ESSnet about consistency falls under objective 2 of the MEETS-programme, which aims at the "achievement of a streamlined framework for business-related statistics". Action 2.1 foresees the "integration of concepts and methods within the legal framework".
The European Statistical System has gradually evolved over the past decades, with a considera-ble increase in content and coverage taking place in the past 10 -15 years. This has been accompa-nied by a similar increase in European statistical legislation where the requirements of the single statistical domains are defined as well as the duties of the Member States in order to provide the re-spective data. It is thus not surprising that concepts, definitions and methodologies as well as prac-tices vary to some degree over the different statistical domains. This leads to a situation where the statistical outputs of these various domains cannot be compared because the application of defini-tions, concepts and methodologies is partially or even totally different. This can result in a lack of (full) “coherence”.
Further problems can be represented by the implementation by the Member States, that can re-sult in lack of consistency towards the Legal Act requirements or towards the related domains. This is especially the case when the data requirements are not fully specified or are ambiguous, and the Member States have a certain degree of freedom about the concepts or definitions they might use. This can also be observed in cases where the European concepts are less or insufficiently elaborat-ed and are not baselaborat-ed on given and agreelaborat-ed standards.
The aim of the overall ESSnet Consistency was to study specific aspects of consistency and/or co-herency in related domains of statistics on ‘business and trade-related statistics’, each of those driven by a set of European legal acts. Identifying related domains means that we are dealing with statistics which already exist as European statistics with a legal basis of their own, for which it should be possible to combine the results because they have the same object or they use a similar terminology.
differ-have analyzed several aspect of consistency and its determinants:
• same statistical unit (analyzed in WP1);
• same target population (analyzed in WP2);
• same survey frame (analyzed in WP2);
• same classification(s) and comparable aggregation levels (analyzed in WP2);
• same (or comparable) reference period(s) (analyzed in WP2);
• same (or comparable) characteristics and definitions (analyzed in WP3).
ISTAT was one of the eight EU countries which took part to the EU Project “ESSnet Consisten-cy” - Work Package 3 (WP3): characteristics and definitions, started in March 2012 and ended in December 20131.
As a matter of fact, the specific goal of WP3 was the elaboration of proposals aimed at reducing inconsistencies regarding characteristics and their definitions within the area of business and trade-related statistics. The WP3 moved from all the previous deliverables of WPs and from the pro-posals from the ESSnet on the use of Administrative and Accounts Data for Business Statistics (ESSnet Admin Data2), in particular Work Package 7 on Statistics and Accounting standards.
Its purpose was the identification and evaluation of inconsistencies in the definition and charac-teristics of variables across different statistical areas and in different Member States. Furthermore, proposals of necessary adjustments have been made on the basis of the assessment of the results of the identification and evaluation phase.
The first step of the project was to investigate the ‘as-is’ situation which involved an examina-tion of the regulaexamina-tions and manuals which refer to common characteristics. This had been under-taken in the Interim Inventory Report (ESSnet Consistency WP3. 2012), which reviewed an exter-nal study (Eurostat. 2010) that collated legal requirements in need of review.
It has been decided to take Structural Business Statistics (SBS) as the “core” of the system of business and trade-related statistics. SBS variables of common module (Annex 1 of the SBS Regu-lation3) have been further analyzed and looked upon as the “Core Variables” and they were taken as a reference point for the work of WP3.
Afterwards, the project pointed out at measuring across the member states the presence of in-consistencies. To this aim, a comprehensive and detailed questionnaire has been designed and sur-veyed among the 32 countries4, that has focused on how each domain applied the correspondent regulation. It has been surveyed whether there were any inconsistencies in applying what required by the legal acts, in the case of declared inconsistencies it has also been asked which was the kind and the reason of. The questionnaire’s data have been uploaded into a dedicated database, which allowed the evaluation and assessment phase of the project to begin.
Evaluation criteria were set up in order to resume the main questionnaire’s results, to point out most common inconsistencies, to analyze their features in terms of kind and reasons, and hence to identify possible area of intervention to find a common solution. The analysis has been based on the definition of the variable/characteristics, i.e. the name, constituents and methods.
Other activities were undertaken, as study visit to the Netherlands (finding best practices), a comparison on commodity vs activity oriented domains and an evaluation of the recommendations from ESSnet Admin Data project on economic variables. Furthermore, an inventory of the National Accounts needs, as main user of business statistics, was made and proposed adjustments to the WP3 variables/characteristics to fulfil ESA requirements were elaborated.
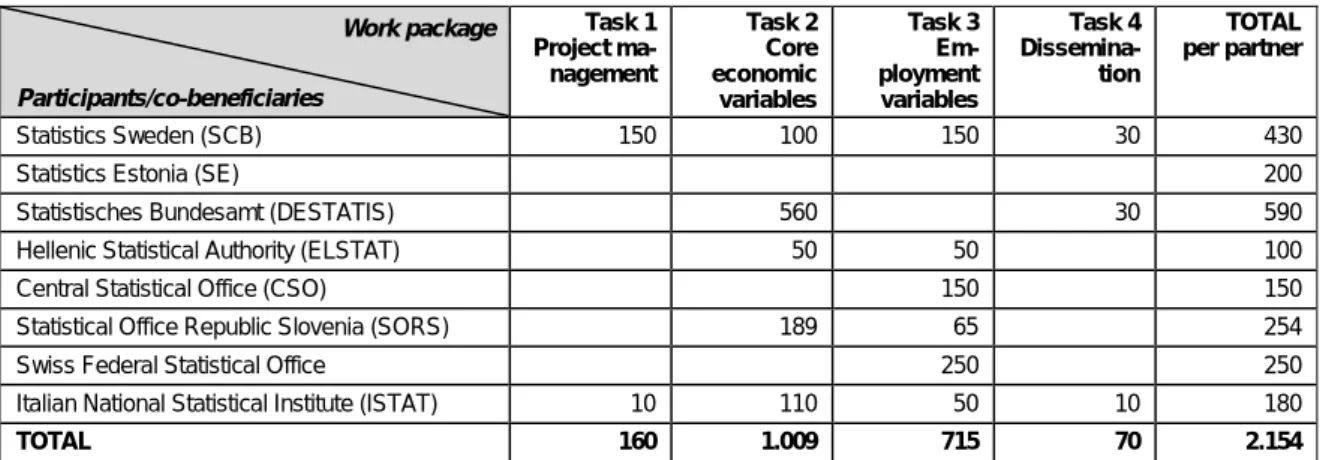
In this view, it is worthwhile to resume the breakdown of working days spent during the project by task and by country, as detailed in the following table 1.
1
The other seven countries were Sweden (Project leader), Germany, Ireland, Estonia, Slovenia, Greece and Switzerland.
2 Http://essnet.admindata.eu/. 3 European Union. 2008.
Table 1: Number of project working days by task and country Work package Participants/co-beneficiaries Task 1 Project ma-nagement Task 2 Core economic variables Task 3 Em-ployment variables Task 4 Dissemina-tion TOTAL per partner Statistics Sweden (SCB) 150 100 150 30 430
Statistics Estonia (SE) 200
Statistisches Bundesamt (DESTATIS) 560 30 590
Hellenic Statistical Authority (ELSTAT) 50 50 100
Central Statistical Office (CSO) 150 150
Statistical Office Republic Slovenia (SORS) 189 65 254
Swiss Federal Statistical Office 250 250
Italian National Statistical Institute (ISTAT) 10 110 50 10 180
TOTAL 160 1.009 715 70 2.154
This paper resumes the main WP3 results, through the selection of a subset of statistical tables derived from the above mentioned database, further ad hoc elaborations and the additional break-down of main outcomes by groups of countries5, as commented in section.
Section 2 specifies the field of analysis and section 3 the main concepts adopted as regards kind and reasons of inconsistency; section 4 deals with the questionnaire, while section 5 describes the evaluation criteria adopted for analyzing the questionnaire’s results (task managed by Italy). The main results as regards both vertical and horizontal inconsistencies have been resumed in section 6. An overall strategy for improving consistency taking into account the WP3 outcomes has been dealt with in section 7, while some perspective conclusions have been drawn in section 8.
2. Field of analysis: domains and variables
Related domains can be defined as areas of statistics which either refer to the same target popu-lation, to the same kinds of statistical units but which have a different analytical orientation (the same 'object' but a different aim), use the same (or related) characteristics in a different context, or refer to different domains (the same terminology in different legal acts).
Within the 'related domains' coherency and consistency play an important role because they are essential for combining the results of different statistical sources in a meaningful manner. The combination of statistical results of related domains is possible because they use the same or 'relat-ed' characteristics.
The External Study (ES; Eurostat. 2010)) analyzed more than 160 legal acts or manuals, to pro-vide an inventory of the legal requirements and methodologies in business and trade statistics with particular focus on cross-cutting issues. Hence, the WP3 inventory report started focusing on the legal aspects where consistency or inconsistency is determined or allowed because of differences or deficits in the definition of characteristics in the legal texts, according to different perspectives:
• the user needs: which variables should be comparable, under which circumstances it is possible and under which it is not. In the latter case, it was to be evaluated how important it was and whether it was possible to redefine characteristics, definitions and observation units to improve comparability;
• the production process of statistics: which definitions have to be checked, whether variables with the same designation were really comparable or whether they were only seemingly com-parable. In this case either terminology should be changed or characteristics should be rede-fined if comparability plays an important role.
In the later stage, the project moved to a second source of inconsistencies or incoherencies, namely the implementation of the delivery program in the national statistical systems of the Mem-ber States. From the analytical orientation, the main distinction has been done between:
• short term (or business cycle) analysis with a periodicity of less than one year;
• structural analysis with a periodicity of one or more years.
The first should deliver comparable indicators about the present state of the market economy in the business cycle; the second should give comparable information about the basic economic struc-tures in the Member States and in the EU. Coherence under this perspective means that both pic-tures should fit together using similar characteristics to describe the economy.
The Structural Business Statistics (SBS) could be looked upon as the 'core' of the system of business and trade-related statistics. They play a central role in assessing the structural develop-ment of the economy, gathering annually and in longer time intervals a detailed overview over im-portant business characteristics in the different domains.
The Foreign Affiliates Statistics (FATS) serve the goal to give a view on the economic perfor-mance of statistical units which are dependent from abroad, to present figures about globalization. Turnover, value added, employment and investment of this special group of enterprises deserved special attention. Therefore FATS could be looked upon as an evaluation for a special sub-population of SBS.
The Short Term Statistics (STS) contain indicators for the current short run development of the economy and present essential information for business cycle analysis. In principle, they look at the same object as the SBS do, but according to different analytical purposes. Therefore a relation be-tween both statistical domains should be existent but coherence requirements bebe-tween both do-mains are difficult to define, because in SBS the focus is on absolute figures while STS focuses on change rates and indicators.
The National Accounts and Balance of Payments Statistics are internal users of statistical results and their aim is to draw consistent picture of the whole economy. It would have been advanta-geous if the results of both domains were consistent with each other.
As a result of the arguments mentioned above, a set of characteristics and a set of domains have been established to be relevant for analyzing the inconsistencies and their sources.
Economic Core Characteristics were6: 11110 Number of enterprises
11210 Number of local units 12110 Turnover
12120 Production Value
12150 Value added at factor cost 12170 Gross operating surplus
13110 Total purchases of goods and services
13120 Purchases of goods and services purchased for resale in the same condition as received 15110 Gross investment in tangible goods.
Core Employment Characteristics were: 13130 Payment of agency workers 13310 Personnel costs
13320 Wages and salaries 13330 Social security costs
16110 Number of persons employed
16130 Number of employees
16140 Number of employees in full-time equivalent units 16150 Numbers of hours worked by employees.
The different statistical domains which may produce the previous characteristics included in the analysis were:
• Structural Business Statistics (SBS)
• Short Term Statistics (STS)
• Inward FATS (FATS_INW)
• Outward FATS (FATS_OUTW)
• Community Innovation Survey (CIS)
• Research & Development (R_D)
• Labour Force Survey (LFS)
• Labour Cost Survey/Structure of Earnings (SES_LCS)
• Labour Cost Index (LCI)
• Information and Communication Technology (ICT).
Basically, the knowledge advancements on consistency achieved by the WP3 have been ob-tained analyzing the degree of consistency regarding the previous characteristics, as they are cur-rently produced in one or more among the statistical domains above.
3. Inconsistencies: definitions, causes and reasons
Consistency is mentioned as a target in the European Statistics Code of Practice7 to which the NSIs are obliged within the European Statistical System (ESS). Principle 14 of the European Statis-tics Code of Practice states that “European StatisStatis-tics are consistent internally, over time and com-parable between regions and countries; it should be possible to combine and make joint use of re-lated data from different sources”.
Consistency is one of the quality standards for official statistics in the ESS. “The need for co-herent treatment of data collected in different statistical projects is explicitly stressed in Regulation (EC) No 223/2009 of the European Parliament and of the Council of 11 March 2009 on European Statistics. Article 12 addresses the issues of ‘comparability’ and ‘coherence’ as key quality crite-ria which have to be met when developing, producing and disseminating European Statistics”8.
According to this article the statistical output should serve users’ needs and comply with the fol-lowing quality standards:
• Relevance
• Timeliness and Punctuality
• Coherence and Comparability
• Accessibility and Clarity
So besides ‘consistency’ in the European Code of Practice the terms “coherence and compara-bility” are used.
Although the ESSnet has the title “Consistency of concepts and applied methods of business and trade-related statistics” unfortunately “consistency” and its relation to the terms “coherence”, “compatibility” and “comparability” is not always clear. It was however useful that all three work
7 Eurostat. 2011. 8 Eurostat. 2010, p.7.
packages used the terminology in the same manner and have the same understanding of the termi-nology. Therefore the meaning of the different terms should be clarified. The ES states that:
“In the context of the analysis the terms ‘inconsistency’ and ‘incompatibility’ always refer to a violation of the principle of coherence - that is to the comparability of results across statistical areas.“9
“Whereas comparability refers to the measurement of the impact of differences in applied statisti-cal concepts, measurement tools and procedures where statistics are compared between geograph-ical areas, sector domains or over time, coherence describes the adequacy of the data to be relia-bly combined in different ways and for various uses”.10
Hence, coherence seems to be the most important term in the context of WP3. The most obvious obstacle to consistency and coherence are different characteristics and/or differences in the defini-tions of the characteristics in related areas of business and trade-related statistics.
As a starting point, concerning the issue of consistency two dimensions must first be differenti-ated (according to the same terminology used in WP2):
• Vertical consistency is addressed to the issue of comparability between the sum of MS data and the European aggregate. Concepts developed for the national implementation may not be suited to derive the consistent European aggregate on such MS data. This may occur in statistical do-mains where the statistical objects are of cross-border nature. The issue of vertical consistency must be assessed for each single country first, as it is a “one to one” relation between every spe-cific characteristic and the concerned definition supplied in the spespe-cific EU Regulation, which rules out the production of such characteristic. As a consequence, the same National Statistical Institute may declare vertical inconsistency for turnover in STS but not in SBS, or vice versa, or for both domains, or for none.
• Horizontal consistency refers to the comparability among the same characteristic as it is pro-duced by different statistical domains. Data between statistical domains can be compared if they are elaborated using the same statistical unit, the same coverage, the same classifications, the same definitions, the same frame and the same reference time and period. This is also valid as it concerns the relationship between monthly or quarterly data and the respective annual data. The issue of horizontal consistency is a “one to many” relation between the specific characteristic dealt with (for instance, turnover in STS) and the same characteristic as produced in all the other domains concerned (turnover as produced in SBS, or in Research and Development, etc.). Let’s note that for any National Statistical Institute, a certain characteristic may be produced in the frame of k different domains (in the WP3 context k=1, 2,…, 10) with no vertical inconsistency (the characteristic is produced in full compliance with the related EU definition ruling the spe-cific domains where it is produced), but at the same time there may be several horizontal incon-sistencies if the different EU regulations applied in different domains use different definitions for the same characteristic.
Next, for both types of inconsistencies (vertical and horizontal), it has been asked to indicate the kind of inconsistency observed, i.e. which factors may have produced differences between the defi-nition according to which the data have been delivered with comparison to the legal defidefi-nition11.
9
Eurostat. 2010, p.13.
10
Eurostat. 2010, p.258.
11 Some kinds (reference time and period, coverage, observation unit) concern the reference domains covered by WP1 and WP2, they have been
asked in the WP3 questionnaire deliberately, since the WPs must be intended strictly close to each other in order to take into account their poten-tial influence on different inconsistencies.
Kinds12
1) Reference time and period 2) Coverage
3) Observation unit
4) Name
5) Use of proxy
6) Measurement concept 7) Properties included: more 8) Properties included: less 9) Properties excluded: more 10)Properties excluded: less
For both inconsistencies (horizontal and vertical), reasons for inconsistencies have been re-sumed into the following list of reasons.
Reasons
1) Historically grown statistics
2) EU legislation not consistent/unclear 3) Timeliness of data collection
4) Limited data availability 5) Multipurpose data collection 6) Reduction of external burden
7) Reduction of internal production costs 8) Lack of/limited availability of metadata 9) National information requirements 10)Use of different methods/concepts 11)Translation issue.
When analyzing inconsistencies of characteristics and their definitions, it is important to distin-guish between two causes of differences:
• differences which occurred less consciously due to a lack in coordination (as a result of the stove-pipes in the ESS);
• differences which are taken into account deliberately due to special analytical objectives and particular user needs on the output and input side (e.g. use of administrative data).
Although it might not always be easy to distinguish between these reasons in practice, it is im-portant to think about the reasons for existing inconsistencies in the evaluation process. Inconsist-encies of the first cause are only influenced by the MS and Eurostat itself and should be removed. Those of the second cause cannot be avoided completely to keep relevance of the data and to re-duce burden and costs, but they do need to be minimized where possible.
4. The questionnaire
In the framework of the WP3, the MS have been asked to fill a questionnaire, through a proper Excel file. The questionnaire has been designed to be interactive and easy to be filled in. It was
12
In particular: “4) Name” We mean that the national translation may introduce some discrepancies with respect to the original English wording (deliberately or not). “6) Measurement concepts” means that measurement tools, units, or procedures used differ across the statistical domains or from what is advocated by Eurostat.”7) Properties included: more” must be marked whenever the output definition of the variable you are investi-gating mentions elements that are not cited in the compared definition. “8) Properties included: less” the compared definition mentions elements not cited in the output definition.
vised that each domain should have been completed by the relevant MS expert, in consultation with national experts for the domains concerned.
The questionnaire included three types of sheets: the first aimed at collecting information about each characteristic and domains where it was produced; the second provided the contact infor-mation (responsible for each characteristic) and the third concerned specific questions on con-sistency.
Detailed instructions have been provided for compilation, among which the classification of dif-ferent kinds and reasons for vertical and horizontal inconsistencies. However, a certain unavoidable degree of subjectivity could not be eliminated, especially as regards horizontal inconsistency. Since the questionnaire was compiled separately by each expert responsible for each specific characteris-tic in different domains, it may have happened that, for instance, the responsible for turnover in STS declared no horizontal inconsistency with respect to turnover in SBS, but on the other hand the responsible for turnover in SBS declared horizontal inconsistency with respect to turnover in STS. Broadly speaking, for any characteristic the matrix produced for all countries which resumes horizontal inconsistencies between each domain and all the others may be not symmetric.
In order to optimize the process of collecting information asked for, every national coordinator was asked to contact experts for every statistical domain within the NSI. Each expert had to fill in the first part of the information sheet, as well as to assess vertical inconsistency. Afterwards, all experts were asked to compare their own definitions with those in the other statistical domains, as well as to assess the kind of inconsistency present and the reason for that. The need of coordination and cooperation among the different statistical domains was strongly emphasized trough detailed instructions provided by the WP3 staff.
The table 1 below resumes the statistical domains where each characteristic resulted to be pro-duced as regards the 32 countries to which the questionnaire on consistency was sent (figures range between 0 and 32). The questionnaire was fulfilled between November 2012 and February 2013.
Table 1 – Characteristics and domains analysed in 32 countries as regards consistency
Characteristics/Domains SBS STS Inw FATS
Outw
FATS CIS R&D LFS SES /
LCS LCI ICT
Number of enterprises 31 0 28 30 30 0 0 0 0 0
Number of local units 31 0 0 0 0 0 27 0 0 0
Turnover 31 30 29 30 29 0 0 0 0 32
Production Value 31 29 29 0 0 0 0 0 0 0
Value added at factor cost 31 0 30 0 0 0 0 0 0 0 Gross operating surplus 31 0 0 0 0 0 0 0 0 0 Total purchases of goods and services 31 0 29 0 1 0 0 0 0 26 Purchases of goods and services purchased for
resale in the same condition as received 30 0 29 0 0 0 0 0 0 0 Gross investment in tangible goods 31 0 27 0 0 0 0 0 0 0 Payment of agency workers 29 0 0 0 0 0 0 0 0 0
Personnel costs 31 15 29 0 0 0 0 29 30 0
Wages and salaries 31 30 0 0 0 0 0 29 28 0
Social security costs 31 11 0 0 0 0 0 30 28 0 Number of persons employed 31 27 29 24 0 30 29 0 0 31 Number of employees 31 19 26 20 0 0 27 30 0 0 Number of employees in full-time equivalent
units 27 0 0 0 0 29 24 30 0 0
5. Evaluation criteria
The logical structure of the questionnaire sent to the national Institutes of the 32 countries was founded on three main issues:
1) information on definition applied in the country and the type of data source(s) used; 2) presence of vertical inconsistency (with respect to the EU definition);
3) presence of horizontal inconsistency (among domains).
Approximately 1,800 information sheets have been created across all participating countries: each characteristic is defined in one or more statistical domains (except for ‘Gross Operating Sur-plus’ and ‘Payment for Agency Workers’), this corresponds all in all to about 60 definitions that could be found in the different statistical domains, for 32 countries. On the basis of the survey re-sults, all the data have been stocked into the dedicated database. In this way, information about the consistency of the predefined set of core economics and employment variables, with regard to their characteristics and definitions, has been fully structured to be analyzed.
The main difficulty lied in the multidimensional profile of the database, which took into account information at the level of single countries (32), characteristics (17), domains (12), kinds (11) and reasons (11) for inconsistencies, as well as the “one-to-many” feature of horizontal inconsistency.
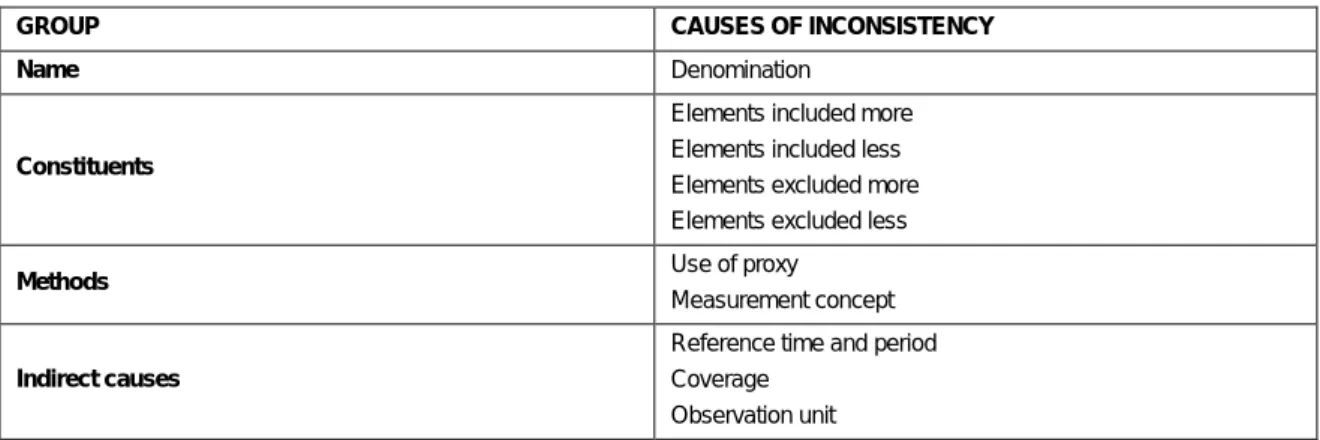
The “Evaluation criteria” are the logical framework – founded on tables and statistical indica-tors concerned – to be used for analyzing the main results. Evaluation criteria have been developed to assess, among all the potential statistical tables, which direction of analysis could be useful in order to identify the inconsistencies as well as to compile information on their importance. It should be noted that the issue of inconsistency in characteristics and definitions is not about exact numbers, but about the size and the effect of these inconsistencies on the final EU aggregates. The following re-classification of main causes has been adopted:
Table 2 –Groups of causes of inconsistency
GROUP CAUSES OF INCONSISTENCY Name Denomination
Constituents
Elements included more Elements included less Elements excluded more Elements excluded less
Methods Use of proxy
Measurement concept
Indirect causes
Reference time and period Coverage
Observation unit
Indeed, by arranging the causes of inconsistency into groups, it is much more obvious in which part of the definition the inconsistencies are located and where the proposals for reduction of in-consistency should start. The indirect causes are mainly related to other ESSnet work packages.
The EU aggregate level was the main target to be studied, hence the single country data were not analyzed in depth. Moreover, it was agreed to not apply “weights” to the single countries data in the phase of aggregation at the EU level. Weights may reflect the “importance” of the country in terms, for instance, of value added, evaluated as percentage on the total EU level. This decision allowed to assess how many countries declared specific inconsistencies, no matter their size. On the other hand, this strategy assigned the same implicit weight to each country without considering its economic importance in the EU, with the consequent risk to underestimate the real inconsistency level for some characteristics and domains.
break-of value added percent share on the overall valued added summed up for the 32 countries con-cerned. The 32 countries have been broken down in two groups13:
1. countries with a share on the whole valued added (year 2013) larger than 7% (Germany, France, United Kingdom, Italy and Spain); they represent the 63,7% of the whole valued added (Group 1);
2. all the remaining 27 countries (Group 2).
Moreover, specific analyses for Italy have been developed, in order to evaluate the profile of Italy within the previous mentioned Group 1.
The main overall results are presented in the following section 6. It is worthwhile to underline that, among all characteristics and domains analyzed over the 32 countries (from now “EU” coun-tries, even though 4 of them do not actually belong to the EU), the characteristics are produced us-ing a direct survey in the 41,1% of cases, through the combination of direct surveys and secondary (administrative) data in the 32,1% of cases, using only secondary data in the 13,3% of cases and through derivation from another variable in the remaining 13,5% of cases. On one side, direct sur-veys are used mainly for “Number of hours worked by employees” (65,4%) and “Gross operating surplus” (62,1%), on the other one characteristics as “Turnover” and “Wages and salaries” are pro-duced using exclusively direct surveys only in the 12,1% and 9,7% of cases, respectively. Overall, the use of direct surveys only characterizes more employment characteristic (40,8%) than the eco-nomic ones (33.3%).
Table 3 – Kind of sources used for producing each variable (% by rows)
Kind of source
Characteristic Total Derived
variable Direct survey Use of secondary data Direct survey and use of secondary data Number of enterprises 100,0 8,8 43,0 19,3 28,9
Number of local units 100,0 10,9 43,7 10,9 34,6
Turnover 100,0 41,4 12,1 13,8 32,7
Production Value 100,0 16,1 26,7 12,5 44,6
Value added at factor cost 100,0 7,0 42,1 16,6 34,2
Gross operating surplus 100,0 3,4 62,1 0,0 34,5
Total purchases of goods and services 100,0 5,2 41,2 14,3 39,4 Purchases of goods/services for resale….. 100,0 13,4 40,2 13,4 33,0 Gross investment in tangible goods 100,0 9,1 36,4 16,4 38,2
Economic characteristics 100,0 17,4 33,3 14,2 35,1
Payment of agency workers 100,0 17,1 26,8 18,7 37,4
Personnel Costs 100,0 32,6 26,7 10,5 30,2
Wages and salaries 100,0 41,9 9,7 0,0 48,4
Social security costs 100,0 22,0 20,7 15,8 41,5
Number of persons employed 100,0 6,3 49,2 16,2 28,3
Number of employees 100,0 4,9 52,4 14,5 28,3
Number of employees in full-time equivalent units 100,0 23,1 56,5 4,6 15,8 Number of hours worked by employees 100,0 10,3 65,4 4,7 19,7
Employment characteristics 100,0 18,5 40,8 10,5 30,2 TOTAL 100,0 13,5 41,1 13,3 32,1
Source: Elaboration on ESSnet WP3 Consistency data.
6. Main results
6.1 Vertical and horizontal inconsistency
Presence of vertical inconsistency has been evaluated in terms of percent incidence (“% Inc.” in the table 4) on the number of cases (“Cases”) for which a certain characteristic is produced (do-mains by countries). If in a country a characteristic is produced by a specific domain it counts for “1” in the column “EU-Cases” of the table. If vertical inconsistency has been stated, cases of in-consistencies taken into account in the column “% Inc.” have been counted only once, no matter how many reasons of inconsistencies have been declared for that specific case. Overall, on 1.701 cases14 for which a certain characteristic is produced by a given domain in a country (which is the largest potential amount of vertical inconsistencies and is given by the product among number of countries, number of characteristics and number of domains producing each characteristic), vertical inconsistencies have been counted for in the 27,3% of cases. The % incidence ranges from 19,0% of Number of employees to 37,3% of Personnel costs; it is almost equal as regards economic char-acteristics (27,6%) and the employment (27,0%). It is worthwhile to remark that the Group 1 coun-tries are characterized by a larger average vertical inconsistency incidence than the Group 2’s av-erage, since the percentages are 36,2% and 21,2% respectively. As a consequence, the decision to not apply country weights in the calculations at the aggregate level may have produced underesti-mation of the vertical inconsistency incidence on the EU economic figures. Italy shows small inci-dence as regards vertical inconsistency (10,6% on average), e.g. in 5 cases on 47.
Table 4 – Cases and % incidence of vertical inconsistencies by characteristic and countries
Characteristic
EU Group 1 Group 2 Italy Cases % Inc. Cases % Inc. Cases % Inc. Cases % Inc. Number of enterprises 119 32,8 48 39,6 71 28,2 4 0,0 Number of local units 58 31,0 24 37,5 34 26,5 1 100,0
Turnover 181 26,5 73 35,6 108 20,4 6 0,0
Production Value 89 29,2 38 44,7 51 17,6 3 33,3 Value added at factor cost 61 23,0 25 40,0 36 11,1 2 0,0 Gross operating surplus 31 22,6 13 38,5 18 11,1 1 0,0 Total purchases of goods and services 87 26,4 34 41,2 53 17,0 3 0,0 Purchases of goods/services for resale….. 59 27,1 23 39,1 36 19,4 1 0,0 Gross investment in tangible goods 58 24,1 24 37,5 34 14,7 2 0,0
Economic characteristics 743 27,6 302 39,1 441 19,7 23 8,7
Payment of agency workers 29 31,0 11 36,4 18 27,8 1 0,0 Personnel Costs 134 37,3 54 38,9 80 36,3 4 25,0 Wages and salaries 118 34,7 47 40,4 71 31,0 3 33,3 Social security costs 100 34,0 41 43,9 59 27,1 3 33,3 Number of persons employed 201 22,9 80 32,5 121 16,5 5 0,0 Number of employees 153 19,0 62 29,0 91 12,1 3 0,0 Number of employees in full-time equivalent units 110 24,5 47 29,8 63 20,6 3 0,0 Number of hours worked by employees 113 20,4 44 25,0 69 17,4 2 0,0
Employment characteristics 958 27,0 386 33,9 572 22,4 24 12,5 TOTAL 1.701 27,3 688 36,2 1.013 21,2 47 10,6
Source: Elaboration on ESSnet WP3 Consistency data.
Information and communication technology sector (ICT) is the domain most affected by vertical inconsistency (47,7% of cases), followed by Short-term statistics (STS, 36,0%), even though the 28,9% of cases which characterizes Structural business statistics (SBS) is the most relevant as
gards the overall number of vertical inconsistencies (149 cases). LFS is the domain less affected by vertical inconsistency (14,7%)
Table 5 – Cases and % incidence of vertical inconsistencies by domain and countries
Domain EU Group 1 Group 2 Cases % Inc. Cases % Inc. Cases % Inc. SBS 516 28,9 214 42,5 302 19,2 STS 189 36,0 76 43,4 113 31,0 FATS_INW 285 19,3 111 28,8 174 13,2 FATS_OUTW 104 31,7 42 42,9 62 24,2 CIS 60 15,0 23 17,4 37 13,5 R_D 59 20,3 24 16,7 35 22,9 LFS 136 14,7 58 24,1 78 7,7 SES_LCS 177 33,9 70 35,7 107 32,7 LCI 89 19,1 36 27,8 53 13,2 ICT 86 47,7 34 52,9 52 44,2 TOTAL 1.701 27,3 688 36,2 1.013 21,2
Source: Elaboration on ESSnet WP3 Consistency data.
Horizontal inconsistencies have been summarized in table 6.15 As already remarked, while ver-tical inconsistency can be counted through the binary variable equal to one If there is inconsistency (with respect to the specific definition concerned), horizontal inconsistency – for each country, characteristic and domain – may be present with respect to one or more different domains produc-ing the same characteristic. For this reason, we have introduced the incidence indicator “Inc.”, which is given, for each characteristic, by the ratio between the number of domains respect to which horizontal inconsistency has been declared (numerator) and the overall number of domains producing that characteristic (denominator). At the EU level the formula used for the calculation of the indicator Inch referred to the characteristic h (h=1,2,…,17) is given by16:
∑∑
∑∑∑
= = = = = = 32 1 10 1 , , 32 1 10 1 10 1 / , , ˆ c d d c h c d D D d c h h I I Inc (1)where h is a characteristic; c is a country; d and D are labels referred to domains;
I
h,c,dis the binary variable equal to one if the characteristic h is produced in the country c using the domain d and equal to zero otherwise;I
ˆ
h,c,d/Dis the binary variable equal to one if the characteristic h is produced in the country c using both domains d and D and d is horizontally inconsistent with D, and it is equal to zero otherwise. It follows that the indicator (1) may be larger than one17.15
Gross operating surplus and Payment of agency workers were excluded from the analysis since these characteristics are produced within one domain only in each country (SBS). For this reason the number of cases counted in table 6 (1.641) is lower than the overall number of cases ana-lyzed as regards vertical inconsistency (1.701).
16 Formulas for groups 1 and 2 and any specific country follow straightforwardly.
17 Formula (1) has been implemented counting only once horizontal inconsistency between domains d and D: if d is not consistent with D and
At the whole EU level (table 6), on average each characteristic produced in a given domain is horizontally not consistent with 1,36 other domains producing the same characteristics. There are two basic differences with respect to vertical inconsistency (table 4):
• vertical inconsistency affects economic and employment characteristics at the same levels (27,6% and 27,3% respectively), while horizontal inconsistency is more than twice higher for the employment characteristics (Inc=1,77) rather than for the economic ones (0,84);
• vertical inconsistency affects more the Group 1 countries (36,2%) than the Group 2 ones (21,2%); on the contrary horizontal inconsistency is more relevant in Group 2 (Inc=1,60) rather than in Group 1 (Inc=1,01), in particular as regards employment characteristics. Let’s note that Italy – even though belonging to Group 1 – presents horizontal inconsistency levels quite simi-lar to those of Group 2 (Inc=1,64).
Moreover, horizontal inconsistency is more heterogeneous than vertical inconsistency depend-ing on the specific characteristic concerned, since the Inc indicator ranges from 0,16 (Value added at factor costs, Gross investment in tangible goods) to 2,36 (Number of persons employed). More-over, the coefficient of variation by characteristic is equal to 18,9 as regards vertical inconsistency and to 61,8 as regards horizontal inconsistency.
Table 6 – Cases of horizontal inconsistencies by characteristic and countries
Characteristic
EU Group 1 Group 2 Italy Cases Inc. Cases Inc. Cases Inc. Cases Inc.
Number of enterprises 119 0,94 48 0,71 71 1,10 4 0,25 Number of local units 58 0,48 24 0,42 34 0,53 1 0,00
Turnover 181 1,66 73 1,32 108 1,89 6 1,67
Production Value 89 0,94 38 0,76 51 1,08 3 1,67 Value added at factor cost 61 0,16 25 0,16 36 0,17 2 0,50 Total purchases of goods and services 87 0,48 34 0,38 53 0,55 3 1,00 Purchases of goods/services purchased for resale….. 59 0,17 23 0,13 36 0,19 1 1,00 Gross investment in tangible goods 58 0,16 24 0,13 34 0,18 2 0,50
Economic characteristics 712 0,84 289 0,67 423 0,95 22 1,00
Personnel Costs 134 1,78 54 1,09 80 2,25 4 2,50 Wages and salaries 118 1,50 47 1,02 71 1,82 3 2,33 Social security costs 100 1,12 41 0,88 59 1,29 3 2,00 Number of persons employed 201 2,36 80 1,58 121 2,88 5 2,00 Number of employees 153 2,01 62 1,58 91 2,30 3 3,33 Number of employees in full-time equivalent units 110 1,37 47 1,26 63 1,46 3 1,67 Number of hours worked by employees 113 1,60 44 1,25 69 1,83 2 3,50
Employment characteristics 929 1,77 375 1,28 554 2,10 23 2,39 TOTAL 1.641 1,36 664 1,01 977 1,60 47 1,64
Source: Elaboration on ESSnet WP3 Consistency data.
According to table 7, the Labour force survey (LFS) is the most horizontally inconsistent do-main (Inc=2,10) overall and in both groups, even though in Group 1 Research and development (R_D) has the same horizontal inconsistency level (1,54 against 1,53). On the contrary, at the EU level the two domains which produce the largest number of characteristics (SBS: 456; FATS_INW: 285) are those more horizontally consistent (Inc is equal to 1,01 and 0,87 respectively), and this outcome contributed to limit the overall EU relevance of horizontal inconsistency.
The explanation of the different inconsistency features between the two groups of countries may be as follows. Group 1 countries are less horizontally inconsistent than the Group 2 ones because they coordinate the various data sources each other, for instance because they have already imple-mented the use of specific and efficient tools for reducing the so called “stove pipe approach”. On the other hand, the larger integration among domains in the Group 1 countries may be paid through larger vertical inconsistency, because using more similar definitions in different domains is done at
Table 7 – Cases of horizontal inconsistencies by domain and countries
Domain
EU Group 1 Group 2 Cases Inc. Cases Inc. Cases Inc.
SBS 456 1,01 190 0,79 266 1,16 STS 189 1,86 76 1,45 113 2,14 FATS_INW 285 0,87 111 0,68 174 0,99 FATS_OUTW 104 1,59 42 0,95 62 2,02 CIS 60 1,15 23 0,65 37 1,46 R_D 59 1,86 24 1,54 35 2,09 LFS 136 2,10 58 1,53 78 2,53 SES_LCS 177 1,69 70 1,36 107 1,91 LCI 89 1,34 36 0,83 53 1,68 ICT 86 1,49 34 0,91 52 1,87 TOTAL 1.641 1,36 664 1,01 977 1,60
Source: Elaboration on ESSnet WP3 Consistency data.
Anyway, actually it would not be possible to assess if certain levels of inconsistency are high or not, since there is not yet any acknowledged benchmark beyond which inconsistency may be con-sidered dangerous.
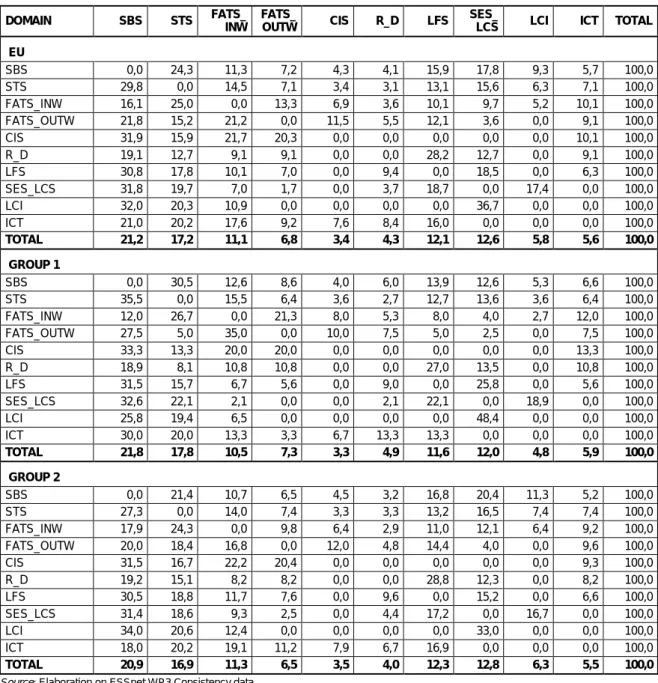
Additional details regarding horizontal inconsistency have been provided in table 8, where each domain is analyzed on the basis of its inconsistencies with the others (for the whole set of charac-teristics). That is another reading key of the outcomes derived from the questionnaire on incon-sistency: for instance, from the figures in the line “Total” at the EU level we can assess that SBS is the domain more frequently not horizontally consistent with the others (21,2% of the inconsisten-cies), followed by STS (17,2%), and that is true for both groups 1 and 2. Of course these outcomes also depend on the huge number of cases for which a characteristic is produced using SBS: for this reason the indicator Inc has been introduced just for neutralizing the “size” effect which character-izes each domain (as already seen, for SBS Inc=1,01, which is relatively small with respect to the average, equal to 1,36).
Table 8 – Horizontal inconsistencies domain to domain, rows %, by countries DOMAIN SBS STS FATS_ INW FATS_ OUTW CIS R_D LFS SES_
LCS LCI ICT TOTAL EU SBS 0,0 24,3 11,3 7,2 4,3 4,1 15,9 17,8 9,3 5,7 100,0 STS 29,8 0,0 14,5 7,1 3,4 3,1 13,1 15,6 6,3 7,1 100,0 FATS_INW 16,1 25,0 0,0 13,3 6,9 3,6 10,1 9,7 5,2 10,1 100,0 FATS_OUTW 21,8 15,2 21,2 0,0 11,5 5,5 12,1 3,6 0,0 9,1 100,0 CIS 31,9 15,9 21,7 20,3 0,0 0,0 0,0 0,0 0,0 10,1 100,0 R_D 19,1 12,7 9,1 9,1 0,0 0,0 28,2 12,7 0,0 9,1 100,0 LFS 30,8 17,8 10,1 7,0 0,0 9,4 0,0 18,5 0,0 6,3 100,0 SES_LCS 31,8 19,7 7,0 1,7 0,0 3,7 18,7 0,0 17,4 0,0 100,0 LCI 32,0 20,3 10,9 0,0 0,0 0,0 0,0 36,7 0,0 0,0 100,0 ICT 21,0 20,2 17,6 9,2 7,6 8,4 16,0 0,0 0,0 0,0 100,0 TOTAL 21,2 17,2 11,1 6,8 3,4 4,3 12,1 12,6 5,8 5,6 100,0 GROUP 1 SBS 0,0 30,5 12,6 8,6 4,0 6,0 13,9 12,6 5,3 6,6 100,0 STS 35,5 0,0 15,5 6,4 3,6 2,7 12,7 13,6 3,6 6,4 100,0 FATS_INW 12,0 26,7 0,0 21,3 8,0 5,3 8,0 4,0 2,7 12,0 100,0 FATS_OUTW 27,5 5,0 35,0 0,0 10,0 7,5 5,0 2,5 0,0 7,5 100,0 CIS 33,3 13,3 20,0 20,0 0,0 0,0 0,0 0,0 0,0 13,3 100,0 R_D 18,9 8,1 10,8 10,8 0,0 0,0 27,0 13,5 0,0 10,8 100,0 LFS 31,5 15,7 6,7 5,6 0,0 9,0 0,0 25,8 0,0 5,6 100,0 SES_LCS 32,6 22,1 2,1 0,0 0,0 2,1 22,1 0,0 18,9 0,0 100,0 LCI 25,8 19,4 6,5 0,0 0,0 0,0 0,0 48,4 0,0 0,0 100,0 ICT 30,0 20,0 13,3 3,3 6,7 13,3 13,3 0,0 0,0 0,0 100,0 TOTAL 21,8 17,8 10,5 7,3 3,3 4,9 11,6 12,0 4,8 5,9 100,0 GROUP 2 SBS 0,0 21,4 10,7 6,5 4,5 3,2 16,8 20,4 11,3 5,2 100,0 STS 27,3 0,0 14,0 7,4 3,3 3,3 13,2 16,5 7,4 7,4 100,0 FATS_INW 17,9 24,3 0,0 9,8 6,4 2,9 11,0 12,1 6,4 9,2 100,0 FATS_OUTW 20,0 18,4 16,8 0,0 12,0 4,8 14,4 4,0 0,0 9,6 100,0 CIS 31,5 16,7 22,2 20,4 0,0 0,0 0,0 0,0 0,0 9,3 100,0 R_D 19,2 15,1 8,2 8,2 0,0 0,0 28,8 12,3 0,0 8,2 100,0 LFS 30,5 18,8 11,7 7,6 0,0 9,6 0,0 15,2 0,0 6,6 100,0 SES_LCS 31,4 18,6 9,3 2,5 0,0 4,4 17,2 0,0 16,7 0,0 100,0 LCI 34,0 20,6 12,4 0,0 0,0 0,0 0,0 33,0 0,0 0,0 100,0 ICT 18,0 20,2 19,1 11,2 7,9 6,7 16,9 0,0 0,0 0,0 100,0 TOTAL 20,9 16,9 11,3 6,5 3,5 4,0 12,3 12,8 6,3 5,5 100,0
Source: Elaboration on ESSnet WP3 Consistency data.
6.2Relationship between vertical and horizontal inconsistency
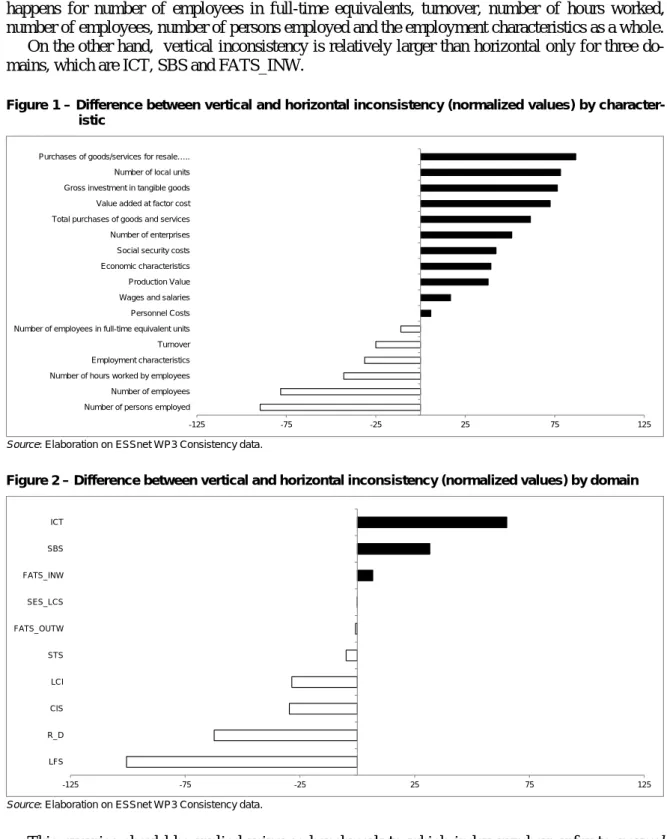
A deeper analysis of the relationship between the two kind of inconsistencies can be done through the comparison with respect to the average inconsistency at the EU level. The indicators “Inc.%” and “Inc.” are characterized by different average levels, hence it is necessary to normalize them through the simple transformation into index numbers, whose reference level “100” is the av-erage EU level. Afterwards we can calculate – for each characteristic of for each domain – the dif-ference between the two normalized values of “Inc.%” and “Inc.”. These difdif-ferences have been re-ported in figure 1 (by characteristic) and figure 2 (by domain). Positive values indicate cases for which vertical inconsistency is relatively larger the horizontal inconsistency, and vice versa18.
Provided that variability of differences is larger for characteristics than for domains, for two characteristics on three vertical inconsistency is relatively larger than horizontal, while the opposite happens for number of employees in full-time equivalents, turnover, number of hours worked, number of employees, number of persons employed and the employment characteristics as a whole.
On the other hand, vertical inconsistency is relatively larger than horizontal only for three do-mains, which are ICT, SBS and FATS_INW.
Figure 1 – Difference between vertical and horizontal inconsistency (normalized values) by character-istic
Source: Elaboration on ESSnet WP3 Consistency data.
Figure 2 – Difference between vertical and horizontal inconsistency (normalized values) by domain
Source: Elaboration on ESSnet WP3 Consistency data.
This exercise should be replied using as benchmark to which index numbers refer to normal levels of vertical and horizontal inconsistencies instead of the EU average level. Normal levels should be defined according to specific criteria agreed at the EU level, whose identification can be considered one of the future challenges after the ESSnet Consistency conclusion. In this regards, it has to be assessed whether there is an ‘acceptance’ minimum level of inconsistency – not avoidable – which can be used as reference benchmark.
-125 -75 -25 25 75 125
Number of persons employed Number of employees Number of hours worked by employees Employment characteristics Turnover Number of employees in full-time equivalent units Personnel Costs Wages and salaries Production Value Economic characteristics Social security costs Number of enterprises Total purchases of goods and services Value added at factor cost Gross investment in tangible goods Number of local units Purchases of goods/services for resale…..
-125 -75 -25 25 75 125 LFS R_D CIS LCI STS FATS_OUTW SES_LCS FATS_INW SBS ICT
6.3 Kind and reasons of vertical and horizontal inconsistency
In the vertical and in the horizontal perspective over all domains and all variables, most incon-sistencies were caused by the so-called “indirect causes” observation unit, coverage and reference time and period (table 919). “Indirect” in these context means that these causes cannot directly be influenced by the definition of the variable itself. In details, on average indirect causes explain the 55,0% of vertical inconsistencies and the 71,4% of horizontal inconsistencies, and these incidences are even higher as regards economic characteristics. The incidence of indirect causes as regards kind of inconsistencies is relevant for Payment of agency workers (76,9%), Number of local units (73.9%) and Number of enterprises (73,3%). The last two characteristics are also those for which indirect causes explain the most part of horizontal inconsistencies (79,1% and 84,5% respectively).
Table 9 – Kind of vertical and horizontal inconsistencies, % incidence by characteristic
Characteristics
Kind of vertical (total = 100%) Kind of horizontal (total = 100%) Name Consti-tuens Me-thods Indirect causes Name Consti-tuens Me-thods Indirect causes Number of enterprises 8,9 6,7 11,1 73,3 2,5 1,9 11,2 84,5 Number of local units 8,7 4,3 13,0 73,9 3,0 0,0 17,9 79,1
Turnover 1,4 28,2 21,1 49,3 1,9 4,1 18,1 75,9
Production Value 4,9 17,1 29,3 48,8 1,8 5,9 34,7 57,6 Value added at factor cost 0,0 12,5 25,0 62,5 0,0 0,0 50,0 50,0 Gross operating surplus 0,0 21,4 21,4 57,1 - - - - Total purchases of goods and services 0,0 17,2 34,5 48,3 0,0 7,4 31,5 61,1 Purchases of goods and services for resale….. 16,7 16,7 12,5 54,2 0,0 10,0 40,0 50,0 Gross investment in tangible goods 0,0 35,0 10,0 55,0 0,0 0,0 22,2 77,8
Economic characteristics 4,7 17,6 19,9 57,8 1,8 3,9 21,0 73,2
Payment of agency workers 0,0 7,7 15,4 76,9 - - - - Personnel Costs 10,9 25,0 14,1 50,0 7,5 17,8 9,6 65,2 Wages and salaries 3,2 40,3 8,1 48,4 1,8 16,6 8,1 73,5 Social security costs 8,9 22,2 13,3 55,6 2,1 13,6 9,8 74,5 Number of persons employed 4,8 21,0 22,6 51,6 2,0 9,5 17,4 71,2 Number of employees 2,2 17,4 19,6 60,9 1,6 10,2 15,5 72,7 Number of employees in full-time equivalent units 14,3 7,1 32,1 46,4 7,6 6,3 22,7 63,4 Number of hours worked by employees 6,1 18,2 21,2 54,5 2,0 6,3 16,0 75,7
Employment characteristics 6,9 22,4 17,7 52,9 3,2 11,2 14,7 70,8 TOTAL 5,6 20,8 18,6 55,0 2,9 9,6 16,1 71,4
Source: Elaboration on ESSnet WP3 Consistency data.
Regarding reasons in the vertical perspective (table 10), most inconsistencies are the results of reduction of external burden (29,0%) and limited data availability (24,5%). These reasons are par-ticularly important as regards Payment of agency workers and Value added at factor costs. This could be the effect of several national constraints. Also the use of different methods or concepts may be a significant reason for vertical inconsistency (9,8%, achieving to 12,8% as regards em-ployment characteristics), while less important reasons are timeliness of data collection, limited ac-cess to metadata and translation issues. Basically, the effect of different EU legislation has an im-pact on vertical inconsistencies lower than expected (7,0%).
From the horizontal point of view (table 11), the use of different methods or concepts (47,7%) and the timeliness of data-collection (19,6%) are the main reasons for inconsistencies. This can be seen as the result of the actually existing stove-pipe approach. As a matter of fact, the two main reasons explaining horizontal inconsistencies are completely different with respect to those which
turned out to be the most relevant as regards vertical inconsistency, and they have a quite larger weight (67,3% with respect to 53,5%). Moreover, they are more concerned with the specific re-quirements of the correspondent EU regulations in terms of contents and timeliness, while the main reasons for vertical inconsistencies depend more on issues related to the context in each country.
Table 10 – Reasons of vertical inconsistencies, % incidence by characteristic
Reasons of vertical inconsistencies (total by row = 100%) (1) Characteristic 1 2 3 4 5 6 7 8 9 10 11
Number of enterprises 6,0 4,0 2,0 34,0 12,0 16,0 6,0 0,0 4,0 12,0 4,0 Number of local units 15,8 0,0 5,3 42,1 5,3 15,8 10,5 0,0 0,0 5,3 0,0 Turnover 8,8 2,5 3,8 20,0 12,5 28,8 3,8 1,3 13,8 5,0 0,0 Production Value 12,5 16,7 0,0 20,8 6,3 31,3 8,3 0,0 0,0 4,2 0,0 Value added at factor cost 0,0 14,8 0,0 22,2 11,1 40,7 3,7 0,0 0,0 7,4 0,0 Gross operating surplus 14,3 14,3 0,0 21,4 7,1 35,7 0,0 0,0 0,0 7,1 0,0 Total purchases of goods and services 11,1 16,7 2,8 19,4 8,3 25,0 5,6 0,0 2,8 8,3 0,0 Purchases of goods and services for resale….. 3,3 16,7 0,0 30,0 6,7 30,0 3,3 6,7 0,0 3,3 0,0 Gross investment in tangible goods 5,6 0,0 0,0 27,8 11,1 33,3 5,6 0,0 11,1 5,6 0,0
Economic characteristics 8,5 8,1 2,0 26,2 9,7 26,6 5,5 0,8 5,1 6,8 0,7
Payment of agency workers 0,0 9,1 0,0 36,4 0,0 45,5 0,0 0,0 9,1 0,0 0,0 Personnel Costs 8,5 4,2 1,4 28,2 2,8 31,0 7,0 0,0 5,6 8,5 2,8 Wages and salaries 8,6 3,4 1,7 22,4 3,4 27,6 12,1 0,0 12,1 8,6 0,0 Social security costs 4,9 12,2 0,0 22,0 2,4 36,6 4,9 2,4 7,3 7,3 0,0 Number of persons employed 6,7 1,7 0,0 25,0 11,7 28,3 3,3 0,0 3,3 20,0 0,0 Number of employees 4,9 4,9 0,0 17,1 12,2 29,3 2,4 2,4 7,3 19,5 0,0 Number of employees in full-time equivalent units 5,7 5,7 2,9 17,1 5,7 28,6 2,9 0,0 11,4 20,0 0,0 Number of hours worked by employees 5,9 5,9 0,0 29,4 2,9 26,5 8,8 2,9 5,9 11,8 0,0
Employment characteristics 6,5 5,2 0,8 23,9 5,7 30,4 5,8 0,8 7,4 12,8 0,6 TOTAL 7,4 7,0 1,3 24,5 7,6 29,0 5,6 0,9 6,2 9,8 0,6
Source: Elaboration on ESSnet WP3 Consistency data.
(1) 1: Historically grown statistics; 2: Legislation not consistent; 3: Timeliness of data collection; 4: Limited data availability; 5: Multipurpose data collection; 6: Reduction of external burden; 7: Reduction of internal costs; 8: Lack of / limited metadata; 9: National information re-quirement; 10: Use of different methods/concepts; 11: Translation issue.
Table 11 – Reasons of horizontal inconsistencies, % incidence by characteristic
Reasons of horizontal inconsistencies (total by row = 100%) (1) Characteristic 1 2 3 4 5 6 7 8 9 10 11
Number of enterprises 0,0 6,9 10,4 11,1 4,9 14,6 10,4 0,0 0,0 38,9 2,8 Number of local units 0,0 6,7 23,3 6,7 0,0 0,0 0,0 0,0 0,0 63,3 0,0 Turnover 2,3 5,8 21,0 7,6 7,3 7,8 5,3 0,8 3,0 39,1 0,0 Production Value 7,6 3,4 27,7 10,9 0,0 8,4 2,5 0,0 0,0 39,5 0,0 Value added at factor cost 0,0 0,0 0,0 25,0 0,0 16,7 16,7 0,0 0,0 41,7 0,0 Total purchases of goods and services 3,4 12,1 10,3 12,1 6,9 3,4 3,4 0,0 0,0 48,3 0,0 Purchases of goods and services for resale….. 0,0 0,0 0,0 16,7 0,0 16,7 16,7 8,3 0,0 41,7 0,0 Gross investment in tangible goods 0,0 0,0 0,0 18,2 0,0 18,2 18,2 0,0 0,0 45,5 0,0
Economic characteristics 2,5 5,9 18,3 9,6 5,1 8,9 6,1 0,5 1,5 41,1 0,5
Personnel Costs 4,1 5,1 22,7 6,1 4,1 10,5 4,1 0,0 2,4 41,0 0,0 Wages and salaries 6,7 8,8 21,3 4,2 3,8 9,2 3,3 0,0 3,3 39,3 0,0 Social security costs 3,4 8,8 25,2 6,1 2,0 12,2 1,4 0,0 1,4 39,5 0,0 Number of persons employed 1,2 7,4 16,7 5,7 3,1 7,6 4,8 0,2 2,6 50,8 0,0 Number of employees 1,1 5,6 19,0 3,1 2,2 5,0 2,0 1,4 3,1 57,4 0,0 Number of employees in full-time equivalent units 1,3 5,7 19,7 1,9 0,6 2,5 0,0 0,0 0,0 68,2 0,0 Number of hours worked by employees 2,1 4,2 22,4 4,2 3,0 4,2 2,5 0,0 1,7 55,7 0,0
Employment characteristics 2,5 6,5 20,0 4,6 2,8 7,2 3,1 0,3 2,3 50,7 0,0 TOTAL 2,5 6,3 19,6 6,0 3,5 7,8 3,9 0,4 2,1 47,7 0,1
Source: Elaboration on ESSnet WP3 Consistency data. (1) See note (1) under table 10.
At first glance, the results show that the challenges with horizontal inconsistencies are signifi-cantly higher than with the vertical ones. That corresponds to the expectations, as each domain could define their variables more or less independently.
The following detailed analysis (table 12) shows the most frequent cases20 for which couples of domains are characterized by horizontal inconsistencies. For instance, the most frequent case con-cerns the couple of domains SBS and STS and the characteristic Production value (N=36 cases overall); the main reasons for that are the use of different methods/concepts (38,9%) and timeliness of data collection (27,8%). It is worthwhile to note that these two reasons are quite always the most important for explaining the series of horizontal inconsistencies.
Table 12 – The most relevant cases of horizontal inconsistencies by number of reasons (N), by charac-teristics, domains and reasons
Reasons of horizontal inconsistencies % (1) Characteristics Domain To domain N 10 3 6 4 Others
Production Value SBS STS 36 38,9 27,8 5,6 13,9 13,9
Turnover SBS STS 35 25,7 28,6 5,7 14,3 25,7
Turnover STS SBS 34 26,5 29,4 8,8 8,8 26,5
Personnel Costs SES/LCS LCI 32 25,0 15,6 12,5 15,6 31,3 Production Value FATS_INW STS 28 42,9 32,1 7,1 7,1 10,7 Turnover FATS_INW STS 28 28,6 35,7 7,1 10,7 17,9 Number of employees SES/LCS LFS 27 59,3 14,8 7,4 7,4 11,1 Number of employees LFS SBS 26 69,2 11,5 7,7 0,0 11,5 Number of employees SBS LFS 26 65,4 15,4 7,7 0,0 11,5 Personnel Costs LCI SES/LCS 26 23,1 23,1 23,1 3,8 26,9 Number of persons employed SBS STS 26 30,8 26,9 15,4 7,7 19,2 Wages and salaries SES/LCS SBS 25 32,0 16,0 16,0 4,0 32,0 Number of hours worked by employees LFS SES/LCS 25 76,0 20,0 0,0 0,0 4,0 Production Value STS SBS 25 36,0 28,0 8,0 12,0 16,0 Number of hours worked by employees STS LFS 25 56,0 24,0 0,0 4,0 16,0 Number of hours worked by employees SES/LCS LFS 24 75,0 16,7 0,0 0,0 8,3 Number of persons employed STS SBS 24 25,0 16,7 12,5 8,3 37,5 Wages and salaries LCI SES/LCS 24 25,0 33,3 20,8 4,2 16,7 Number of persons employed FATS_INW STS 24 25,0 25,0 16,7 8,3 25,0 Wages and salaries SES/LCS LCI 24 25,0 29,2 16,7 8,3 20,8 Number of hours worked by employees STS SBS 24 29,2 20,8 16,7 8,3 25,0 Personnel Costs SES/LCS SBS 23 39,1 17,4 13,0 0,0 30,4 Number of hours worked by employees LFS STS 23 65,2 17,4 0,0 0,0 17,4 Number of employees LFS SES/LCS 23 60,9 21,7 4,3 4,3 8,7 Social security costs SES/LCS LCI 23 26,1 26,1 17,4 8,7 21,7 Number of persons employed LFS SBS 22 77,3 13,6 0,0 4,5 4,5 Number of persons employed LFS STS 22 63,6 18,2 0,0 4,5 13,6 Wages and salaries SES/LCS STS 22 40,9 22,7 4,5 9,1 22,7 Number of persons employed STS ICT 22 40,9 18,2 9,1 4,5 27,3 Personnel Costs SBS SES/LCS 21 52,4 9,5 14,3 0,0 23,8 Personnel Costs LCI SBS 21 33,3 28,6 9,5 9,5 19,0 Personnel Costs SBS LCI 21 47,6 19,0 14,3 4,8 14,3 Number of hours worked by employees SES/LCS STS 21 38,1 23,8 9,5 4,8 23,8 Wages and salaries STS SES/LCS 21 42,9 23,8 0,0 0,0 33,3 Wages and salaries LCI SBS 21 38,1 23,8 14,3 4,8 19,0 Number of persons employed STS FATS_INW 21 23,8 23,8 19,0 4,8 28,6 Number of employees in full-time equiv… SES/LCS LFS 20 70,0 15,0 5,0 0,0 10,0 Number of persons employed SBS LFS 20 70,0 20,0 0,0 0,0 10,0 Social security costs LCI SES/LCS 20 30,0 35,0 15,0 5,0 15,0
Source: Elaboration on ESSnet WP3 Consistency data.
(1) 3: Timeliness of data collection; 4: Limited data availability; 6: Reduction of external burden; 10: Use of different methods/concepts.