Studies and
Research Projects
REPORT R-774 Martin Lebeau Patrice Duguay Alexandre BoucherEstimating the Costs of Occupational Injuries
A Feasibility Study in the Mining Industryof its work and the expertise of its personnel.
Mission
To contribute, through research, to the prevention of industrial accidents and occupational diseases, and to the rehabilitation of affected workers;
To disseminate knowledge and serve as a scientific reference centre and expert;
To provide the laboratory services and expertise required to support the public occupational health and safety prevention network.
Funded by the Commission de la santé et de la sécurité du travail, the IRSST has a board of directors made up of an equal number of employer and worker representatives.
To find out more
Visit our Web site for complete up-to-date information about the IRSST. All our publications
can be downloaded at no charge.
www.irsst.qc.ca
To obtain the latest information on the research carried out or funded by the IRSST, subscribe to Prévention au travail, the free magazine published jointly by the IRSST and the CSST.
Subscription: www.csst.qc.ca/AbonnementPAT
Legal Deposit
Bibliothèque et Archives nationales du Québec 2013
ISBN: 978-2-89631-667-0 (PDF) ISSN: 0820-8395
IRSST – Communications and Knowledge Transfer Division 505 De Maisonneuve Blvd. West Montréal, Québec H3A 3C2 Phone: 514 288-1551 Fax: 514 288-7636 [email protected] www.irsst.qc.ca
© Institut de recherche Robert-Sauvé en santé et en sécurité du travail, April 2013
OUR
RESEARCH
This publication is available free of charge on the Web site.
Studies and
Research Projects
Estimating the Costs of Occupational Injuries
A Feasibility Study in the Mining IndustryThis study was financed by the IRSST. The conclusions and recommendations are those of the authors. This publication has been translated; only the original version (R-717) is authoritative.
REPORT R-774
Disclaimer
The IRSST makes no guarantee regarding the accuracy, reliability or completeness of the information contained in this document. Under no circumstances shall the IRSST be held liable for any physical or
psychological injury or material damage resulting from the use of this information.
Note that the content of the docu-ments is protected by Canadian intellectual property legislation.
Martin Lebeau, Patrice Duguay, Alexandre Boucher Scientific Division, IRSST
ACKNOWLEDGEMENTS
We thank all the persons and organizations who directly or indirectly took part in the production of this report.
In particular, we want to thank Claude Fortin and Christian Simard of Xstrata Nickel’s Raglan Mine and Yvan Ouellette of Arcelor Mittal Mines Canada.
We also offer our thanks to Jean Drolet of the Association paritaire pour la santé et sécurité du travail du secteur minier and Pierre Thibault of the Québec Mining Association for their cooperation and to the member companies for taking part in the study.
ABSTRACT
This study is part of the IRSST’s effort to develop economic indicators in the occupational health and safety field on which, in combination with the indicators and other information already in use at the IRSST, decisions regarding research priorities can be based.
It attempts to clarify the feasibility of developing such indicators at the IRSST. To accomplish this, it tests, using available data, various methods for estimating the costs of occupational injuries and profiles these costs in the Québec mining industry during the years 2005 to 2007. In broad terms, the study shows that it is possible to estimate the financial and human costs associated with occupational injuries in a specific industry. However, it also indentifies certain limitations that could affect the development of economic indicators at the IRSST.
The annual cost of occupational injuries in Québec mines is estimated to be approximately $130 million dollars (in 2006) or about 5% of the mining industry’s contribution to Quebec’s GDP. Of this amount, around $50 million is attributed to financial costs and $80 million to human costs. Due to the limitations of the methodology used, this is probably an underestimation of the costs of occupational injuries in the mines.
Analysis of the results also revealed that the workers assume nearly 67% of the total costs, largely in the form of human costs. For their part, the employers assume nearly 64% of the financial costs.
Various methods drawn from the scientific literature were used to estimate some cost components. First, the human capital method was used to estimate the productivity losses. Then a health status index was used in combination with the willingness-to-pay method to estimate, in monetary terms, the human costs caused by occupational injuries.
The most significant limitation on making this type of estimate is data availability. This limitation particularly affects estimation of the costs of injuries for employers. For example, several costs not insured by the CSST were estimated using information obtained from surveys of Québec mining companies or from a study carried out in a mining company.
This limitation is especially problematic when attempting to develop economic indicators for all Québec industries. When doing so, the IRSST will need to consider whether it is necessary to carry out the most complete estimate possible of the costs of occupational injuries or whether it can limit itself to the most significant cost components that use easily available data.
CONTENTS
ACKNOWLEDGEMENTS ... i
ABSTRACT ... iii
CONTENTS ... v
LIST OF TABLES ... vii
LIST OF FIGURES ... ix
GLOSSARY ... xi
1. INTRODUCTION ... 1
2. RESEARCH DESIGN ... 3
2.1 Background ... 3
2.2 Statistical population studied ... 3
2.3 Data sources ... 3
2.4 Perspective ... 5
2.5 Classification of costs ... 5
2.6 Time dimension ... 6
2.7 Discount rate ... 7
3. QUÉBEC MINING INDUSTRY STATISTICS ... 9
3.1 Overview of the industry ... 9
3.2 Health and safety in the mines ... 10
3.3 Occupational injuries ... 11
3.4 Financial data ... 12
4. COSTS OF OCCUPATIONAL INJURIES IN MINES... 15
4.1 Medical costs ... 15 4.2 Transportation/Emergency ... 16 4.3 Funeral costs ... 17 4.4 Salary costs ... 18 4.5 Productivity losses ... 20 4.5.1 Lost wages ... 20 4.5.2 Employee benefits ... 23
4.5.3 Unpaid household work ... 25
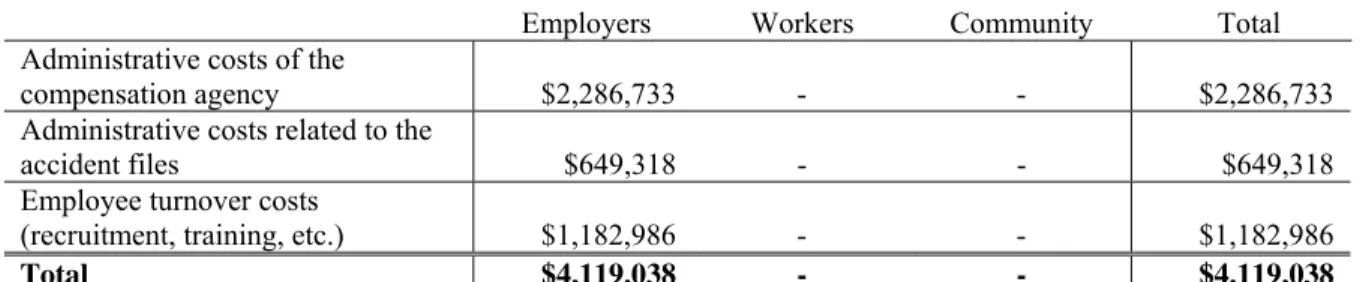
4.6 Administrative costs ... 27
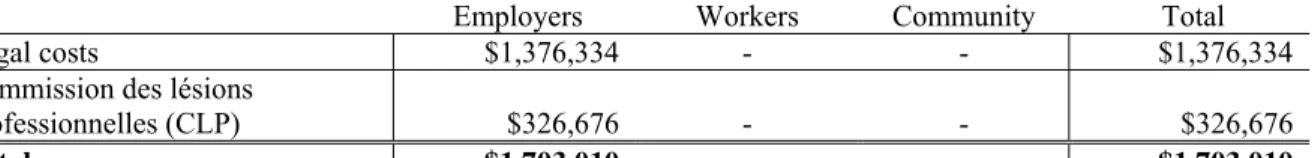
4.7 Legal costs ... 29
5. ANALYSIS OF THE RESULTS ... 37
6. LIMITATIONS ... 49
6.1 Unestimated cost components ... 49
6.2 Available data ... 51
6.3 Sensitivity analysis ... 52
6.4 Human costs ... 53
6.5 Net costs ... 54
7. CONCLUSION ... 57
8. AVENUES FOR FURTHER REFLECTION ... 59
9. BIBLIOGRAPHY ... 61
APPENDIX 1: NAICS CODE DETAILS (2002) ... 65
LIST OF TABLES
Table 2.1: List of industries (NAICS 2002) employing the statistical population studied ... 3
Table 2.2: Costs of injuries based on incidence (disbursements only) ... 6
Table 3.1: Contribution of the mining industry to the Québec economy ... 9
Table 3.2: Average number of employees in the mining industry, Québec, annual average, 2005– 2007 ... 9
Table 3.3: Average annual pay of compensated mining industry workers, Québec, 2005–2007 . 10
Table 3.4: Occupational injuries in the mining industry, Québec, 2005–2007 ... 11
Table 3.5: Profile of occupational injuries in the mining industry, Québec, total for the years 2005–2007 ... 12
Table 3.6: Insured payroll and contributions in the mining industry, Québec, 2005–2007 ... 12
Table 3.7: Average contribution rate per $100 of payroll for all CSST-insured employers, 2006 ... 12
Table 3.8: Average disbursements in the mining industry resulting from one year of injuries, Québec, 2005–2007 ... 13
Table 4.1: Medical costs associated with occupational injuries during one year in the mining industry, Québec, 2005–2007 ... 16
Table 4.2: Transportation and emergency services generated by the occupational injuries in one year in the mining industry, Québec, 2005–2007 ... 17
Table 4.3: Funeral costs associated with occupational injuries in one year in the mining industry, Québec, 2005–2007 ... 17
Table 4.4: Salary costs associated with occupational injuries in one year in the mining industry, Québec, 2005–2007 ... 20
Table 4.5: Productivity losses resulting from occupational injuries in one year in the mining industry, Québec, 2005–2007 ... 27
Table 4.6: Employee turnover costs as a percentage of annual pay ... 29
Table 4.7: Administrative costs associated with occupational injuries in one year in the mining industry, Québec, 2005–2007 ... 29
Table 4.8: Legal costs associated with occupational injuries in one year in the mining industry, Québec, 2005–2007 ... 30
Table 4.9: Relative disutility factors by injury severity level ... 34
Table 4.10: Human costs associated with the occupational injuries in one year in the mining industry, Québec, 2005–2007 ... 36
Table 5.1: Costs associated with occupational injuries in one year in the mining industry, Québec, 2005–2007 ... 37
Table 5.2: Cost of occupational injuries in the mining industry by subsector, Québec, 2005–2007 ... 39
Table 5.3: Costs of occupational injuries in the mining industry by type of injury, Québec, 2005– 2007 ... 39
Table 5.4: Cost of occupational industries in the mining industry by nature of injury or disease, in decreasing order of average cost per case, Québec, 2005–2007 ... 40
Table 5.5: Cost of occupational industries in the mining industry by event or exposure, in
decreasing order of average cost per case, Québec, 2005–2007 ... 41
Table 5.6: Costs of occupational industries in the mining industry by source of injury or disease, in decreasing order of average cost per case, Québec, 2005–2007 ... 42
Table 5.7: Cost of occupational industries in the mining industry by injured body part, in
decreasing order of average cost per case, Québec, 2005–2007 ... 43
Table 5.8: Costs of occupational injuries in the mining industry by economic agent and injury type, Québec, 2005–2007 ... 45
Table 5.9: Cost of occupational injuries in the mining industry by occupational category, Québec, 2005–2007 ... 45
Table 5.10: Costs of occupational injuries in the mining industry (employers only), Québec, 2005–2007 ... 46
Table 6.1: Range of estimated total costs as determined by a change in the value of two
parameters ... 53
LIST OF FIGURES
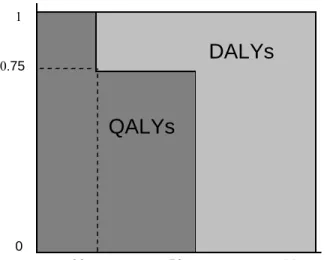
Figure 4.1: The complementarity of the QALY and DALY approaches: example of an individual with a 25% disability at age 20 and an early death at age 50 ... 32
Figure 5.1: Costs of occupational injuries in the mining industry by cost component, Québec, 2005–2007 ... 38
Figure 5.2: Average cost of occupational injuries in the mining industry by injury type and type of cost, Québec, 2005–2007 ... 39
Figure 5.3: Costs of occupational injuries in the mining industry by economic agent, Québec, 2005–2007 ... 44
Figure 5.4: Costs of occupational injuries in the mining industry by economic agent, excluding human costs, Québec, 2005–2007 ... 44
Figure 5.5: Impact of the most costly injuries on the total cost of occupational injuries in the mining industry, Québec, 2005–2007 ... 47
GLOSSARY
Accepted injuries This category of injury includes all the work accidents and occupational diseases recognized and accepted by the CSST, irrespective of whether there have been CSST-compensated days of absence from work, a PPMI, or a death resulting from the injury. Also included are cases without a CSST-compensated day of absence, only reimbursed fees and charges. In this study, the expressions accepted injuries, occupational injuries, and accepted occupational injuries are used interchangeably unless otherwise indicated.
AIAOD Act respecting industrial accidents and occupational disease.
APSM Association paritaire pour la santé et sécurité du travail du secteur
minier, a joint sector-based occupational health and safety association for the mining industry.
CLP Commission des lésions professionnelles, the administrative tribunal
of last resort for workers and employers who are dissatisfied with a CSST decision.
Compensated injuries This category of injury includes all work accidents and occupational diseases recognized and accepted by the CSST and for which there are compensated days.
Costs for employers In this report, costs for employers are the costs specific to mining industry employers with injured employees as well as some general costs assumed by the other employers in the industry or by all Québec employers.
Costs for society In this report, costs for society are defined as the total of the costs for employers, workers and the community.
Costs for the community
In this report, costs for the community are the specific costs borne by economic agents in society other than employers and workers, as well as the general costs assumed by society as a whole, including employers and workers.
Costs for workers In this report, costs for workers are the costs borne by the injured workers and their families and friends.
CSST Commission de la santé et de la sécurité du travail du Québec, the
Québec workers’ compensation board.
DALY Disability-Adjusted Life Year. DALY extends the concept of
equivalent in terms of life years in good health lost due to health problems or disabilities (WHO, 2011). One DALY equals one lost life year in good health.
Data maturity The period between the date on which the injury occurred and the date on which the data used to calculate the indicators was last updated is called the data maturity period.
Disbursement Total of all amounts paid by the CSST during the data maturity period for a claim from a worker who has submitted to the CSST an application for compensation that has been accepted.
Financial costs All costs excluding human costs.
FTE Full-time equivalent. It is either an estimate of the number of
full-time equivalent (FTE) workers based on the hours worked during a year or the identification of an indicator calculated on the basis of such a force of workers (e.g. FTE frequency). A FTE worker is equivalent to 2,000 hours worked.
Human costs The value of the change in the quality of life of the worker and those in his or her circle for the duration of such changes and, in cases of death, the potential years of life lost (e.g. pain, suffering and loss of enjoyment of life). In this report, human costs also include the indemnities paid to compensate for this type of harm; in addition, the expressions human costs and pain and suffering costs are used interchangeably unless otherwise indicated.
IRI Income replacement indemnity. These indemnities are paid by the
CSST to compensate for the loss of income when an interruption of work occurs due to an occupational injury or disease.
Manual occupations Occupations in which physical activity plays a predominant role (construction jobs, unskilled labour, specialized workers, etc.).
Mining industry In this study, the mining industry is considered to be formed of companies involved in mining and quarrying (except oil and gas extraction) as well as in support activities for mining and oil and gas extraction.
Mixed occupations Occupations that require the performance of either light and continuous or intense but occasional physical activities (nursing personnel, haircutters, technicians, etc.).
NAICS North American Industry Classification System.
occupations (administrative personnel, teachers, etc.).
Occupational category Occupations are divided into three occupational categories—manual occupations, non-manual occupations, and mixed occupations—using an IRSST-developed methodology.
Occupational disease A disease that is “contracted out of or in the course of work and characteristic of that work or directly related to the risks peculiar to that work” (AIAOD, s. 2). In this study, it refers more specifically to new occupational disease cases accepted by the CSST. Thus, recurrences, relapses and aggravations do not constitute a new occupational disease per se; instead, their consequences (days of compensation, costs, etc.) are accounted for with the original event when they are covered by a claim accepted by the CSST. In some cases, a distinction can be drawn between accepted and compensated occupational diseases. For an explanation of the difference between these two categories of occupational disease, please see the definitions for accepted injuries and compensated injuries.
OHS Occupational health and safety.
PPMI Permanent physical and mental impairment. Determination of the
PPMI rate is based on a table of damages that is uniform for Québec.
QALY Acronym for “quality-adjusted life year.” A QALY takes into
account both the quantity and quality of the life year gained. A QALY is equivalent to one life year gained in good health.
SEPH Survey of Employment, Payrolls and Hours, a Statistics Canada form
on which employers report payroll-related statistics.
VSL Value of a statistical life.
Work accident “A sudden and unforeseen event, attributable to any cause, which happens to a person, arising out of or in the course of his work and resulting in an employment injury to him” (AIAOD, s. 2). In this study, it refers more specifically to new work accident cases submitted to and accepted by the CSST. Thus, relapses, recurrences and aggravations following a submitted and accepted work accident are not considered to be a new work accident as such; instead, their consequences (days on benefits, costs, etc.) are accounted for with the original event when they are covered by a claim accepted by the CSST. In some cases, a distinction can be drawn between accepted and compensated work accidents. For an explanation of the difference between these two categories of occupational disease, please see the definitions for accepted injuries and compensated
injuries.
WTP Willingness to pay. The willingness-to-pay method consists of
estimating the amount that an individual or society is prepared to pay or receive in exchange for a marginal change in risk (injury, disease or death).
YLD Years lost due to disability, i.e. the number of years in good health
that are lost due to a disability.
1. INTRODUCTION
The mining industry is safer today than it once was. Indeed, recent years have seen a significant decline in the number of compensated occupational injuries1. However, the frequency of accidents and their seriousness continue to make it a very hazardous industry.
Although the mining industry employs only 1% of the worldwide workforce, it is the source of approximately 8% of all fatal work accidents (Jennings, 1998). In Québec, the industry accounts for approximately 0.4% of paid workers but nearly 4% of fatal accidents.2
Occupational injuries are costly not only for the companies concerned but also for society as a whole. In 2009, Québec employers paid some $2.3 billion in contributions to the Commission de la santé et de la sécurité du travail (CSST, 2010a). To that amount can be added other, more difficultly measured cost components, such as human costs.
This research project is part of an institutional effort to develop economic indicators in the occupational health and safety field, indicators on which the determination of research priorities, among other things, can be based. More specifically, this project aims to test, using available data, one or more methods for estimating the costs of occupational injuries and to develop a profile of these costs in the Québec mining industry. Analysis of the results and identification of the limitations of the relationship will cast light on the feasibility of developing economic indicators at the IRSST.
This report is divided into seven chapters. Following the introduction, the second chapter describes the research design. The third chapter provides a statistical overview of the Québec mining industry. The fourth chapter presents the cost estimates for occupational injuries in mines. The analysis of the results is presented in the fifth chapter. The sixth chapter focuses on the limitations encountered in the estimations. Lastly, the report ends, in chapters 7 and 8, with a conclusion and avenues for further reflection regarding the research design’s applicability to other industries.
1 In this report, the expression occupational injuries includes all the work accidents and occupational diseases recognized and accepted by the CSST, unless otherwise indicated. See the glossary for more details.
2.
RESEARCH DESIGN
2.1 Background
A review of the literature (Lebeau and Duguay, 2011) provided an overview of the current state of knowledge regarding estimation of the costs of occupational injuries. This work showed that there is no true consensus on either the cost components to be considered or how to classify them. Indeed, there are practically as many ways of classifying the costs as there are studies on the subject. In addition, some cost components are considered direct costs in some studies and indirect costs in other studies.
The literature review also shows that various economic approaches are used to estimate the costs of occupational injuries. By itself, none of these approaches can be used to obtain a complete estimate of the costs of occupational injuries. To overcome this problem, a combination of several methods (hybrid methods) appears to be the path taken in the most recent studies.
Thus this study aims to estimate the costs of occupational injuries in the Québec mining industry using the methods presented in the literature. Subsequently, we hope to be able to make recommendations to the IRSST regarding the development of economic indicators.
2.2 Statistical population studied
The population considered in this study consists of mining industry workers covered by Québec’s occupational health and safety plan. Specifically, these are workers from three NAICS code categories (North American Industry Classification System – 2002). The codes are presented in table 2.1.3
Table 2.1: List of industries (NAICS 2002) employing the statistical population studied NAICS NAICS code description
2122 Metal Ore Mining
2123 Non-metallic Mineral Mining
2131 Support Activities for Mining and Oil and Gas Extraction
In addition, the occupational injuries analyzed in our studies correspond to occupational injuries and diseases that were accepted by the CSST and whose causal event occurred between January 1, 2005, and December 31, 2007.
2.3 Data sources
To achieve the objectives set out in this report, various baseline data are necessary. These are data on the number of workers, the number of accepted injuries, and the financial data related to these injuries (disbursements and contributions).
As it is impossible to obtain the exact number of mining workers covered by the Québec health and safety plan, we have used the number of paid workers and the hours worked from the 2006 Census of Population (personalized tables). Taking the monthly data from Statistics Canada’s Survey of Employment, Payrolls and Hours (SEPH), we adjusted the census data to account for the monthly fluctuations of the population and hours worked during the 2005–2007 period.
The occupational injury and disbursement data come from CSST administrative records. These have an average maturity of three and a half years for injuries that occurred in 2005 and three years for injuries that occurred in 2006 and 2007.4 In other words, the data for each of the injuries that occurred in 2005, 2006, and 2007 come from an update made on December 31, 2008, June 30, 2009, and June 30, 2010, respectively. The use of three years of injuries reduces the impact of annual fluctuations in injuries, which may be caused by exceptional events. Incidentally, the mining industry is an industry that can be subject to such events.
The disbursements are grouped into five categories: - medical aid costs;
- rehabilitation costs; - death benefits;
- bodily injury indemnities; and - income replacement indemnities.
The contributions are the amounts that employers pay to cover the expenses of the occupational health and safety plan, i.e. the expenses of the CSST (CSST, 2010b). The contributions are based on the employer’s insurable payroll and a contribution rate set by the CSST.5 In this report, we will use the final contributions for all experience files associated with the NAICS codes in table 2.1 for the 2005–2007 period.6
To estimate some cost components, we use data from the Lavoie (2000) study, which was carried out in an underground gold mine in Québec. Its main objective was to measure the “direct” and “indirect” costs of occupational injuries in the mine over an approximately one-year period. The author measured the actual costs of occupational injuries using a questionnaire that was filled out by the employer whenever injuries occurred in the company.
Data were also obtained through meetings and discussions with Québec mining company stakeholders and by distributing a questionnaire to various members of the Québec Mining Association (AMQ). We found that the mining companies surveyed had very little information about the costs of occupational injuries not insured by the CSST. None of the consulted companies had precise data on this subject. However, the data obtained from these companies did enable us to formulate hypotheses for estimating some cost components.
4 This difference in maturity stems from the fact that the IRSST began to extract disbursement data only from 2009 onward. We do not feel that this will have a significant impact on the estimates obtained.
5 The CSST classifies each employer into a unit depending on the nature of all the activities it performs. In some cases, companies that perform activities of a varied nature may be classified in several units, which may result in a given company having several different contribution rates. In addition, some companies are subject to a personalized rate, which varies according to the risk related to the company’s activities.
Other sources were consulted in carrying out our study. These sources will be clearly identified when used in this report.
2.4 Perspective
The perspective corresponds to the level of analysis or point of view that is adopted in order to estimate the costs. All the Québec studies catalogued in the literature review (Lebeau and Duguay, 2011) estimate only the costs of occupational injuries for employers. In the scientific literature, however, the majority of studies opt instead for the societal perspective. As the IRSST works in the interest of workers as well as employers, we will examine the cost of occupational injuries from the societal perspective. It should be noted that the social perspective is not a mere tallying of the costs for workers and employers. Attention must also be paid to transfer payments, such as the compensation paid to the injured workers. From a societal perspective, these transfers only move sums of money from one agent to another (Hodgson and Meiners, 1982). Thus, the possibility of double-counting exists, which we have taken pains to avoid.
2.5 Classification of costs
The costs of occupational injuries are usually classified into three categories: direct costs, indirect costs, and human costs (also called pain and suffering costs). However, as mentioned in section 2.1, there appears to be no consensus in the literature regarding the cost components in each of the categories. That depends, among other things, on the chosen perspective. For example, in the Québec studies, direct costs are the costs insured by the CSST while indirect costs are all the other costs borne by the employer. We believe that the distinction between direct and indirect costs is not truly relevant to the societal perspective. We prefer a classification of costs based on who pays for them.
In Appendix 2, each cost component is defined and broken down by the economic agents that assume it.7 In this report, we attempt to estimate each of the costs while identifying the share assumed by each agent (employers, workers and the community). The costs not estimated in this report are listed in section 6.1.
The costs for employers include the CSST’s disbursements, although these are made by the CSST and not by employers. Because the CSST is funded entirely through contributions from Québec employers, it struck us as more appropriate to list these costs in the Employers column. In addition, in this study, “employers” are not just the employers that have experienced injuries. Some insured costs are sometimes also assumed by the other employers in the industry or by all Québec employers (e.g. the CSST’s administrative costs, contribution rate exceeding a certain maximum).
The costs for workers also include the costs for the worker’s family and friends. This grouping struck us as logical and is also what is done in several other studies (e.g. Access Economics, 2006; Health and Safety Executive, 1999).
7 This table is similar to the one presented in the literature review (Lebeau and Duguay, 2011) but has been adapted for our study, i.e. it takes into account only the costs associated with injuries accepted by the CSST.
The costs for the community are the specific costs assumed by society’s other economic agents and the overall costs assumed by society as a whole, including employees and workers.
2.6 Time dimension
Although an occupational injury occurs—or is reported—at a specific moment in time, it can have consequences (financial and human) for several years.8 It is therefore necessary to choose between an analysis of costs based on either incidence or prevalence.
Estimating costs based on the incidence of occupational injuries corresponds to using the new injuries that occur during a specific year and estimating the total costs of these injuries, irrespective of whether they are spread over one or more years. A prevalence-based analysis focuses solely on the costs actually incurred during a specific year, regardless of when the injury happened. In this study, we use an incidence-based approach to estimating costs.
As for CSST disbursements, they are limited to the maturities presented in section 2.3. Thus, we will total all the disbursements made from the date of the incident to the date of the corresponding update. As a result, the full picture of the costs of these injuries will not be presented: some injuries may result in disbursements over a period longer than the maturity period and, consequently, those costs will not be factored in. However, for some injuries, it is possible to predict the future compensation. These are injuries for which an income replacement indemnity is paid to a worker because he9 is unemployable due to his age.10 In these few cases, the income indemnity paid up to age 65 can be estimated.
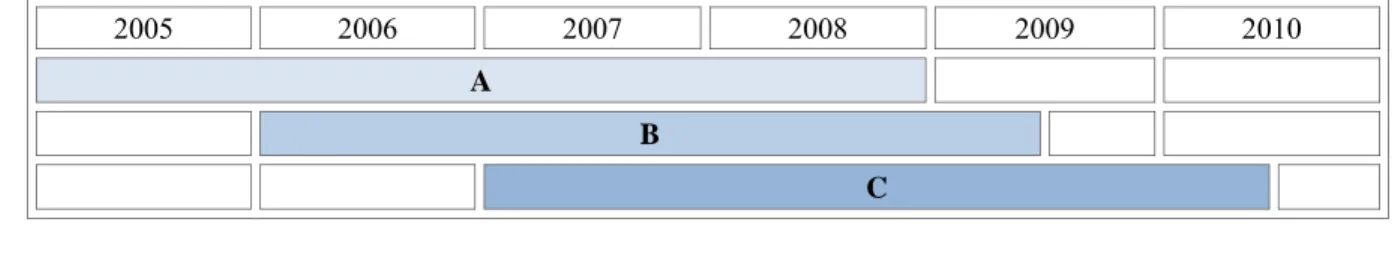
It should be noted that this limitation on the incidence of the costs of occupational injuries applies only to CSST disbursements. The other costs can be spread over a longer period, if necessary. Table 2.2 makes it easier to understand the time dimension in this study. Shaded zones A, B and C correspond to the disbursement periods for injuries that occurred in 2005, 2006, and 2007 respectively and that will be used in our estimates.
Table 2.2: Costs of injuries based on incidence (disbursements only)
8 Because occupational diseases manifest themselves only several years after exposure, it is practically impossible to obtain an event date. We are forced to use the disease report date.
9 The systematic use of the masculine gender in this document is intended solely to facilitate reading and has no
discriminatory intent.
10 Due to the worker’s age, the IRI is paid to a “…worker who is the victim of an occupational disease when 55 years of age or over or a person who suffers another employment injury when 60 years of age or over and who sustains, by reason of that disease or other injury, permanent physical or mental impairment that renders him unable to carry on his employment…” (AIAOD, s. 53).
2005 2006 2007 2008 2009 2010 A
B
2.7 Discount rate
Discounting is a mathematical operation that makes it possible to compare economic values over time. It consists of expressing the future value of a property or an expenditure as a current value (Montmarquette and Scott, 2007). Discounting is based on the concept of the value of time, which is reflected in our preference for immediate gratification. We prefer to have a dollar today instead of a dollar tomorrow. The same attitude, albeit inverted, applies to costs. We prefer to pay later instead of now.
Generally speaking, the discounting of a cash flow F can be expressed as:
n r F F ) 1 ( * + = where
- F* is the discounted value of the cash flow; - F it the cash flow;
- r is the discount rate;
- n is time, usually expressed as years, from the discounting date to the cash flow date. For continuous-time models, continuous discounting is used:
There appears to be no consensus in the literature regarding the most appropriate way to determine the discount rate. In this report, it was decided to use a real discount rate of 3%. Three arguments support this choice.
First, the discount rate is often calculated by subtracting the expected inflation rate from the rate of return for a long-term bond. The average return of Government of Canada long-term bonds for the last ten years has been around 5% and the Bank of Canada’s target inflation rate is 2%. Thus, according to this formula, the discount rate would be:
5% – 2% = 3%
Second, when the benefits are in the distant future, as is the case in the environment and preventive health fields and which is also the case in this report, the Treasury Board of Canada Secretariat recommends an approach that consists of estimating the social time preference rate based on the rate at which society discounts future consumption and on the forecast consumption growth rate. For Canada the social time preference rate has been evaluated at around 3% (Treasury Board of Canada Secretariat, 2007).
Lastly, in the literature review (Lebeau and Duguay, 2011) it is reported that the discount rates used in the 40 applied studies that were surveyed vary from 2.5% to 6%, with an average of 3.6% and a mean of 3.4%. A 3% rate is therefore similar to that used in other studies of the same type.
n r
e F F*= ⋅ −
It should also be mentioned that, unless specified otherwise, the amounts appearing in this report are in 2006 Canadian dollars. The amounts measured in later years are discounted at the 3% rate and the amounts measured in earlier years are expressed in 2006 dollars using the Québec consumer price index.11
3.
QUÉBEC MINING INDUSTRY STATISTICS
3.1 Overview of the industry
Québec is mainly a producer of iron, zinc, nickel, copper, and gold. Mining sites are found throughout the province but especially in Northern Québec, Abitibi-Témiscamingue, and the North Shore. In emergency situations, when extraction or prospecting sites are in remote areas, transportation to a hospital facility can be difficult and dependant on weather conditions.12
During the period of the study, from 2005 to 2007, the mining industry’s contribution to the Québec economy increased significantly (table 3.1).
Table 3.1: Contribution of the mining industry to the Québec economy
2005 2006 2007
GDP of the mining industry
(thousands) $1,983,203 $2,482,935 $2,900,450
Québec GDP (thousands) $252,709,585 $263,433,059 $278,768,371
Ratio 0.78% 0.94% 1.04%
Source: Institut de la statistique du Québec (2010a)
The average number of employees in the industry during the same period was 14,360 full-time equivalents (table 3.2).
Table 3.2: Average number of employees in the mining industry, Québec, annual average, 2005–2007
Subsector Paid workers FTE*
workers
Metal ore mining (2122) 6,665 7,761
Non-metallic mineral mining (2123) 3,879 3,815
Support activities for mining and oil and gas
extraction (2131) 2,212 2,784
Total 12,756 14,360
*FTE: Full-time equivalent
The cyclical character inherent in the mining industry generally results in large year-to-year
fluctuations in the value of mineral production and the number of workers.13
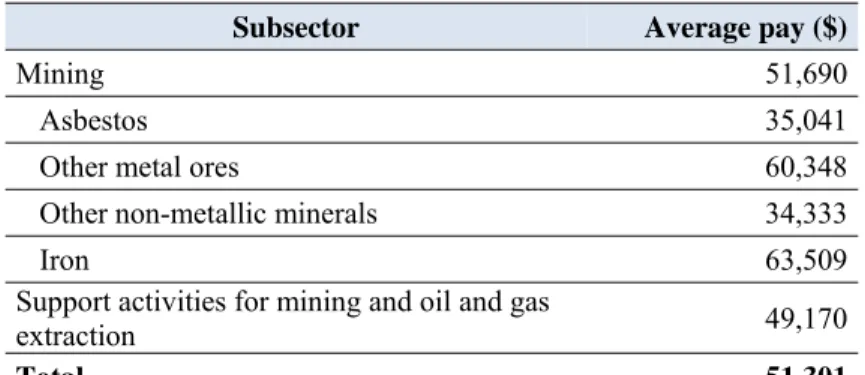
The mining industry tends to pay wages that, on average, are higher than in most other sectors of the economy. According to a Québec government document (2009), the average annual pay in the mining industry in 2006 was about $66,500, nearly twice the average for all industries. The average annual pay of the injured mining industry workers in the CSST database is $51,301. Two aspects specific to our sample explain the difference in average pay. First, our database is not representative of all the workers in the industry, only of workers compensated for an injury accepted by the CSST. It is likely that workers in some occupations, such as engineers and
12 Some mine sites even have a nurse and/or ambulance on site.
administrators, are underrepresented among the workers compensated by the CSST. In addition, pay levels recorded in the database cannot exceed $99,999. However, several mining industry workers are known to receive pay in excess of $100,000. Also, the database contains 35 injuries for which the worker’s pay is $99,999, which probably means the actual pay is higher. These two factors partly explain why the average pay of our sample may be lower than the average pay for the overall industry. Table 3.3. presents the average pay of injured workers, broken down by subsector.
Table 3.3: Average annual pay of compensated mining industry workers, Québec, 2005– 2007
Subsector Average pay ($)
Mining 51,690 Asbestos 35,041
Other metal ores 60,348
Other non-metallic minerals 34,333
Iron 63,509 Support activities for mining and oil and gas
extraction 49,170
Total 51,301
3.2 Health and safety in the mines
The mining industry is often perceived as different from other industries, as it involves very close-knit communities of workers engaged in a hard, dirty, and hazardous occupation (Jennings, 1998). The media coverage of occupational injuries in mines also contributes to the industry’s poor image. Recent years have brought improvements in miners’ working conditions and a reduction in compensated injuries, at least in industrialized countries. This is attributable to, among other things, the presence of an increasingly educated workforce and the increasingly automated extraction process, which makes miners’ work easier and safer. Nonetheless, mines are workplaces that involve certain hazards and produce a large number of occupational injuries relative to the size of the industry’s workforce.
Mines may be underground or open pit. The hazards to which workers are exposed can differ depending on the type of operation or the type of ore that is extracted. Generally speaking, health hazards in mines can be grouped into two categories: physical hazards and hazards related to airborne particulates, gases, and vapours (Weeks, 1998).
The contaminants to which miners may be exposed include airborne gases, vapours and particulate matter from diesel motor exhaust, such as carbon monoxide (CO) and nitrogen oxides (NOx), and gases naturally present in mines, such as radon (Rn) and methane (CH4). The impacts
on health may be minimal (irritation of the nose, eyes or respiratory passages) or serious (asphyxia, lung cancer). Methane, which is found mainly in coal mines, is also responsible for many mining disasters involving explosions.14
Airborne dust, silica, and asbestos are certainly among the most documented contaminants, due to their carcinogenic properties but also to the media attention they have received. The respiratory diseases that result from exposure to these airborne particulates are often diagnosed several decades after exposure. Even today, the number of cases of silicosis and asbestosis diagnosed among older or retired workers is large.
Mines are environments with numerous physical hazards: caving, flooding, fire, explosion, noise, heat, vibration, falls, etc. Some of these hazards result in injuries, others in disease (e.g. deafness, Raynaud’s disease).
3.3 Occupational injuries
Our database contains all the accepted occupational injuries for which the incident causing the injury occurred between January 1, 2005, and December 31, 2007, at the work sites of employers with NAICS codes 2122, 2123, and 2131. Table 3.4 breaks down these occupational injuries by year and by subsector. A total of 3,796 injuries were recorded during the period, giving an average of approximately 1,265 injuries a year.15
Table 3.4: Occupational injuries in the mining industry, Québec, 2005–2007 Subsectors 2005 2006 2007 Total
Mining (2122, 2123) 1,180 1,115 1,028 3,323
Iron 231 271 242 744
Other metal ores 518 495 442 1 455
Asbestos 55 68 60 183
Other non-metallic minerals 376 281 284 941
Support activities for mining and oil and gas
extraction (2131) 128 113 232 473
Total 1,308 1,228 1,260 3,796
Deaths* 15 14 5 34
* Deaths are here accounted for in the year they occurred or the year of the compensation claim, contrary to the CSST, which records them in the year the death was accepted.
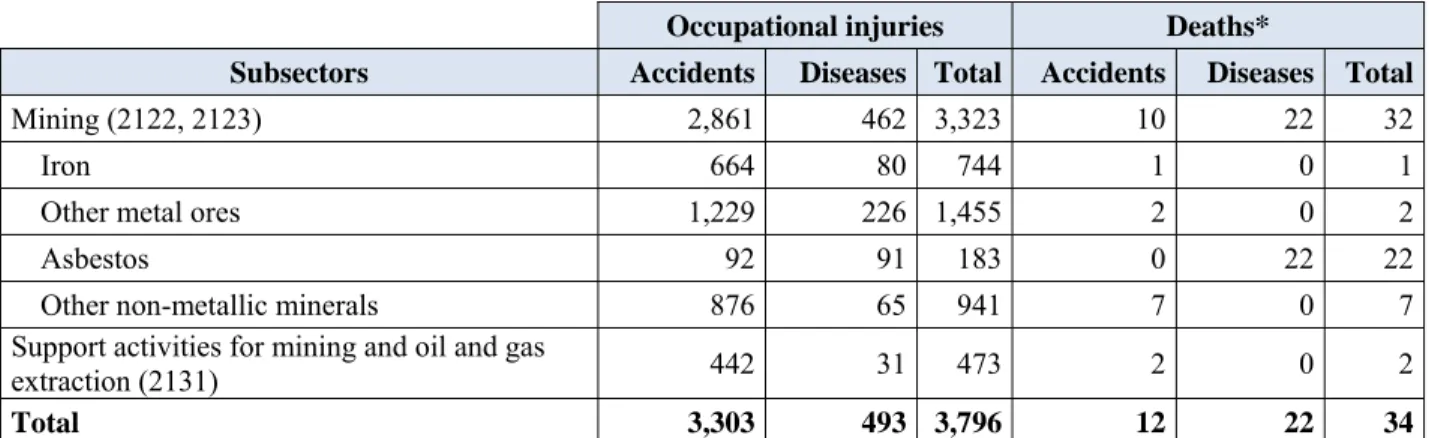
Table 3.5 presents the respective shares of accidents, occupational diseases and deaths among all recorded occupational injuries. We note, among other things, that the deaths from occupational diseases occurred entirely among asbestos industry workers.16
15 The initial database contained 3,862 injuries but 66 injuries were removed because they involved disbursements only for protheses.
16 On the other hand, a more thorough analysis shows that the average age of death of these workers was 75 years. Thus, they were probably not workers who had recently been exposed to asbestos.
Table 3.5: Profile of occupational injuries in the mining industry, Québec, total for the years 2005–2007
Occupational injuries Deaths*
Subsectors Accidents Diseases Total Accidents Diseases Total
Mining (2122, 2123) 2,861 462 3,323 10 22 32
Iron 664 80 744 1 0 1
Other metal ores 1,229 226 1,455 2 0 2
Asbestos 92 91 183 0 22 22
Other non-metallic minerals 876 65 941 7 0 7
Support activities for mining and oil and gas
extraction (2131) 442 31 473 2 0 2
Total 3,303 493 3,796 12 22 34
* Deaths are here accounted for in the year they occurred or the year of the compensation claim, contrary to the CSST, which records them in the year the death was accepted.
3.4 Financial data
The contributions that employers are required to pay to the CSST are a very large expenditure for them. The contributions are often defined by employers as being the “direct” costs of occupational injuries. Table 3.6 shows the annual insured payroll and the annual contributions paid by mining companies during the 2005–2007 period. The average annual contributions paid by mining companies during the period were $37,017,564.
Table 3.6: Insured payroll and contributions in the mining industry, Québec, 2005–2007
Annual insured payroll $653,352,334
Annual contributions $37,017,564
Average contribution rate (per $100) 5.67
These contributions are used to fund the occupational health and safety plan. They therefore include several cost components not directly related to the injuries but inherent in administering the plan. To make clearer what is included in these contributions, table 3.7 breaks down the average contribution rate decreed per $100 of insurable payroll in 2006 based on the contribution rate component (CSST, 2006).
Table 3.7: Average contribution rate per $100 of payroll for all CSST-insured employers, 2006
($) (%)
Compensation programs 1.42 61.2
For a Safe Maternity Experience program 0.15 6.5
Prevention programs 0.10 4.3
Administrative expenses and other expenses 0.35 15.1
Funding of administrative tribunals 0.05 2.2
Deficit amortization 0.25 10.8
Total 2.32 100.0
The compensation programs are the disbursements related to the accepted occupational injuries. These disbursements are the sum of all the amounts paid in a claim file for a worker who has suffered an accepted occupational injury. It is the only component of table 3.7 that is available in the CSST’s administrative data and the only element that we can individually link to each of the injuries.
Table 3.8 details the average disbursements paid by the CSST for the injuries that occurred during a year of the 2005–2007 period.
Table 3.8: Average disbursements in the mining industry resulting from one year of injuries, Québec, 2005–2007
Average annual disbursement
Medical aid costs $2,639,852
Rehabilitation costs $497,877
Death benefits $1,081,054
Bodily injury indemnities $1,931,394
Income replacement indemnities (IRI) $10,236,624
Total disbursements $16,393,690
We note that the occupational injuries during one year in the mining industry resulted in an average disbursement by the CSST of $16,393,690, which corresponds to approximately 44% of the contributions paid. Some 1.5% of the accepted injuries did not involve a disbursement. Among those that involved a disbursement, the average disbursement was $13,154 ($10,071 for work accidents and $33,882 for occupational diseases).
The other components of table 3.7 cannot be obtained for each injury but can be estimated based on tables 3.6 and 3.7.17
17 It should be noted that the expenditures for prevention programs include prevention services and follow-up by the Québec health and social services department’s occupational health teams, the IRSST’s grant, grants from joint sector-based associations, grants from union and employer associations, and other traning and information grants (CSST, 2010b).
4.
COSTS OF OCCUPATIONAL INJURIES IN MINES
As presented in this report, the costs of occupational injuries are not classified as direct or indirect costs. Instead, they are presented successively, specifying the share assumed by each of the economic agents concerned. It should also be noted that they are annual average costs expressed in 2006 dollars.
To make this section less cumbersome to read, the cost components not estimated in this report but included in the table in appendix 2 are listed in section 6.1.
4.1 Medical costs
Medical costs are all the expenditures made to treat and rehabilitate an injured or sick worker. Besides the amounts spent on medical personnel, medical equipment, and medications, transportation expenses and administrative expenses (hospitals) are often included under this heading.
Medical costs for employers
The main medical costs incurred to treat and rehabilitate workers suffering from a work accident or occupational disease are borne by employers through their CSST contributions. These are mainly medical aid costs and rehabilitation costs.
Medical aid costs comprise several elements. Generally speaking and with reference specifically to section 189 of the Act respecting industrial accidents and occupational diseases (AIAOD), medical aid consists of the following:
1. the services of health professionals;
2. the care or treatment provided by a health care institution; 3. medicines and other pharmaceutical products;
4. prostheses, orthoses, tissues, etc.;
5. other care, treatment, or technical aid determined by regulation by the Commission (chiropractic, psychology, acupuncture, etc.).
In the CSST’s administrative records, medical aid costs also include other elements, such as transportation and lodging expenses, administrative expenses, and expenses for property damage caused to workers during the accident. In these same administrative records, we note that rehabilitation costs include household production costs (home-care service, babysitting, house cleaning, etc.).
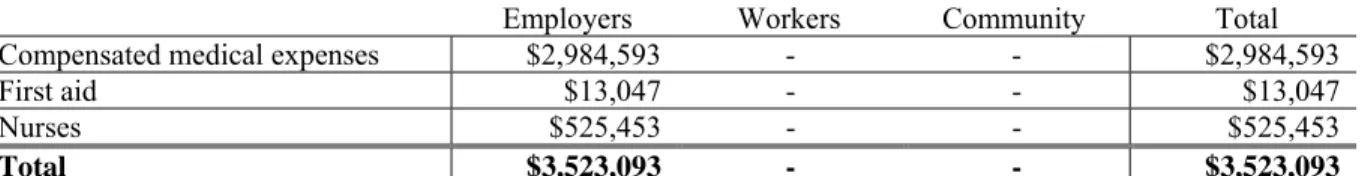
The medical costs assumed by the employers are obtained by adding together the medical aid costs and the rehabilitation costs in table 3.8. However, as the household production costs are estimated in another section of this report (section 4.5.3) and as it was possible to separate them from the rehabilitation costs, we have subtracted those amounts. Thus, the compensated medical expenses total $2,984,593.
Other costs associated with the first aid provided to injured workers are assumed by employers. The first aid supplies and equipment used at the time of the accident and the time devoted by a nurse on the mine’s payroll are the main costs. As these costs are not insured by the CSST, they have to be estimated.
Lavoie (2000) figures the average costs per injury for the first aid provided in response to occupational injuries in a Québec gold mine to be $10.44 (in 2000 Canadian dollars). In 2006 dollars, the costs totalled $11.85. Applying these costs to all work accidents gives us annual costs of $13,047.
Most mining companies have at least one on-staff nurse at the mine site. The nurses do not usually devote all their time to occupational injuries. Based on questionnaires filled out by stakeholders in the industry, we were able to estimate both the number of nurses employed at Québec mines and the percentage of their workload devoted to occupational injuries. On average, there is a single nurse per mine, who devotes 34.4% of his workload to occupational injuries. Taking an average salary of $58,681 and assuming that nurses are found only at Québec’s active mines (26 in 2011 according to the Québec department of natural resources and wildlife), the cost of the nursing personnel at Québec mines is estimated at $525,453.18
Table 4.1 presents all the medical costs that were estimated.
Table 4.1: Medical costs associated with occupational injuries during one year in the mining industry, Québec, 2005–2007
Employers Workers Community Total
Compensated medical expenses $2,984,593 - - $2,984,593
First aid $13,047 - - $13,047
Nurses $525,453 - - $525,453
Total $3,523,093 - - $3,523,093
4.2 Transportation/Emergency
Transportation expenses for employers
Some injuries require that the injured workers be taken to a hospital centre. The transportation may be due to an emergency or in order to obtain a medical opinion. These costs are usually borne by the employer. To estimate the costs, we used the average transportation cost for all injuries obtained by Lavoie (2000). In 2006 dollars, that is $177.03. Applying this amount to all occupational injuries, we obtain an estimated cost of $194,910 for one year of injuries (table 4.2). When the extraction or prospecting site is in a remote area, which was not the case for the mine in the Lavoie (2000) study, transportation to a hospital centre may require the use of an emergency air service (e.g. Medivac). This can generate transportation costs much higher than those used.
18 The average salary of a nurse working in the private sector in Québec is used. This datum comes from a report published by the Institut de la statistique du Québec and titled Résultats de l'Enquête sur la rémunération globale au Québec – Collecte 2007. The salary is expressed in 2006 dollars using the Québec consumer price index.
Table 4.2: Transportation and emergency services generated by the occupational injuries in one year in the mining industry, Québec, 2005–2007
Employers Workers Community Total
Transportation of
injured workers $194,910 - - $194,910
4.3 Funeral costs
Some work accidents and occupational diseases may result in death. These deaths entail funeral costs.
Funeral costs for employers
Part of the funeral costs paid by the victims’ families may be reimbursed, up to a maximum amount, through a death benefit paid to the individual who paid them. The monies are used to pay for funeral costs and transportation of the corpse. The CSST’s administrative records show that these payments totalled $25,077 annually over the study period.
As these amounts are listed as death benefits in table 3.8, care must be taken to avoid counting them twice in subsequent estimations.
Funeral costs for workers
Based on our examination of a large number of websites dealing with the subject, we estimate the average funeral costs to be approximately $7,500. These costs are borne by the deceased’s family but may be partially compensated by the CSST. The amounts of the funeral costs assumed by the victims’ families are estimated as the difference between $7,500 and the funeral costs reimbursed by the CSST.
The deaths that occurred in the mines during one year resulted in funeral costs estimated at $85,000 (table 4.3). Of this amount, $25,077 is paid by employers in the form of benefits to families and $28,333 by the community in the form of death benefits from the Régie des rentes du Québec (RRQ). The remainder, $31,590, is assumed by the deceased workers’ families.
Funeral costs for the community
As mentioned earlier, the funeral costs assumed by the community are limited to the death benefits granted by the RRQ to the person who paid the funeral costs. The death benefit is a lump sum payment of $2,500 and is granted if the deceased made a sufficiently large contribution to the RRQ. We assume that is the case for all the deaths in our sample.
Table 4.3: Funeral costs associated with occupational injuries in one year in the mining industry, Québec, 2005–2007
Employers Workers Community Total
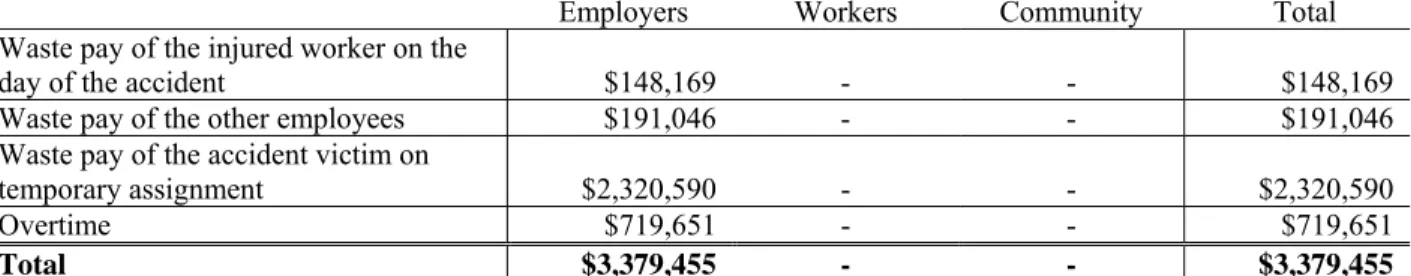
4.4 Salary costs
First, it is important to clearly define what we mean by salary costs. In the literature, the terms “productivity losses” and “salary costs” are often used to identify very similar cost components. In this report, salary costs are defined as being unworked (or non-productive) hours that employers nonetheless pay in the form of wages and employee benefits.
The day of the accident, the employer is required to pay full wages for the day and the corresponding employee benefits to an employee who suffers an injury on the job and is unable to work the rest of the day. However, it is impossible for us to know at what point in the day the injury occurred. We assume that, on average, at the time of the injury, a half-day of work remained to be done. Thus, a salary cost equal to a half-day’s wages plus the employee benefits has been assigned to all work accidents.19 These costs are estimated to be $148,169 a year.
Workplace accidents can also have repercussions on the work of other, uninjured workers. These workers may be ones who assisted the accident victim, supervisors, or others whose work is related to that of the injured employee. This type of cost can be more difficult to measure and can depend on the severity of the injury and on the company’s production structure. We refer to the Lavoie (2000) study, which obtains average costs of $152.93 (in 2000 Canadian dollars) for the time lost by the other workers and the supervisors. That corresponds to $173.52 in 2006 Canadian dollars, the amount we assigned to each work accident.20 These costs total $191,046 a year.
In our discussions with various mining companies, it emerged that the mining industry is inclined to use temporary assignment whenever possible.21 Indeed, in the Lavoie (2000) study, the author notes that 92.3% of accidents resulted in a temporary assignment in the mining company being studied. Although the use of temporary assignments allows compensation costs to be reduced, it is costly in terms of waste pay. However, it is very difficult to accurately assess the cost of this waste pay. The consulted mining companies do not know how much it may cost them. Nonetheless, some of them told us that the costs must be very high.
To calculate the cost of temporary assignment, two statistics are required: the number of cases of temporary assignment and the average cost of temporary assignments. To obtain the number of cases, data from the Association paritaire pour la santé et sécurité du travail du secteur minier (APSM) were used. The APSM records about 485 temporary assignments a year. These data probably underestimate the actual number of temporary assignments. First, because the APSM is not the joint sector-based association for all the companies associated with the NAICS codes listed in appendix 1, the data provided to us by the APSM do not cover our entire sample. Moreover, not every mining company provides data to the APSM (the data are provided to the APSM on a voluntary basis). Lastly, the APSM data concern only work accidents. Thus,
19 Employee benefits increase workers’ compensation by 35% (see section 4.5.2 for more details). 20 Employee benefits are included in the Lavoie (2000) estimates.
21 Temporary assignment allows the employer to assign a job to an employee even if he hasn’t fully recovered from the injury, while waiting for the employee to become able to return to his job or to perform a suitable job (CSST, 2002). When a worker is on temporary assignment, he is paid his full salary even though he is usually not as productive as he was before the injury. The worker is often assigned to training or to tasks that take into account his reduced ability to work.
temporary assignments resulting from occupational diseases are unaccounted for. However, the data do include the temporary assignments for injuries that were not declared to the CSST.
Once again, we refer to the Lavoie (2000) study in order to estimate the average cost of temporary assignments in the mining industry. One of the important contributions of the Lavoie study was the development of a grid that shows the waste share of the pay ascribable to each temporary assignment task in the mine.22 This allows the author to measure the waste pay of each worker on temporary assignment. The author obtains an average cost of $4,214 (in 2000 Canadian dollars) per accident with a temporary assignment. That corresponds to $4,781 per temporary assignment in 2006 dollars. Multiplying this amount by the number of temporary assignments in the period gives an annual cost for temporary assignments of $2,320,590.
In some cases, employers may assume other salary costs. More specifically, with the goal of returning productivity to the level it was at prior to the accident, the co-workers may do overtime. This overtime is also a salary cost for the employer. To estimate the portion of the workload compensated for by overtime, we submitted questions to a number of mining companies. The companies use multiple strategies to make up the workload of injured workers, including distributing the work among the company’s other workers, overtime, the hiring of temporary resources, the hiring of permanent resources, and not performing the work.
Before making the estimates, several hypotheses based on comments obtained from the various stakeholders were developed. In this report, we have used the assumption that, during the first two months of absence, half of the workload will be made up by overtime and the other half will be shared among the other workers at no additional cost to the employer. Accordingly, for the first two months of absence and using an overtime bonus of 50%, the cost of overtime is calculated as follows: % 50 salary annual 365 60) of (maximum days d compensate 2 1 overtime of Cost ⎟× ⎠ ⎞ ⎜ ⎝ ⎛ × × =
For any absence longer than two months, the injured worker will be replaced by a contract worker at no additional salary cost for the employer. Only in rare cases will a permanent regular worker be hired (see section 4.6). Overtime has also been assigned in cases of death due to a work accident. In such cases, the overtime cost is calculated using the same formula but assigning 60 days of compensation.
Based on these assumptions, mining companies would have spent $719,651 annually in overtime due to occupational injuries.
Table 4.4 presents the various salary costs that have been estimated in this section.
22 This grid was prepared with the assistance of the OHS managers and the heads of the departments concerned with the temporary assignments.
Table 4.4: Salary costs associated with occupational injuries in one year in the mining industry, Québec, 2005–2007
Employers Workers Community Total
Waste pay of the injured worker on the
day of the accident $148,169 - - $148,169
Waste pay of the other employees $191,046 - - $191,046
Waste pay of the accident victim on
temporary assignment $2,320,590 - - $2,320,590
Overtime $719,651 - - $719,651
Total $3,379,455 - - $3,379,455
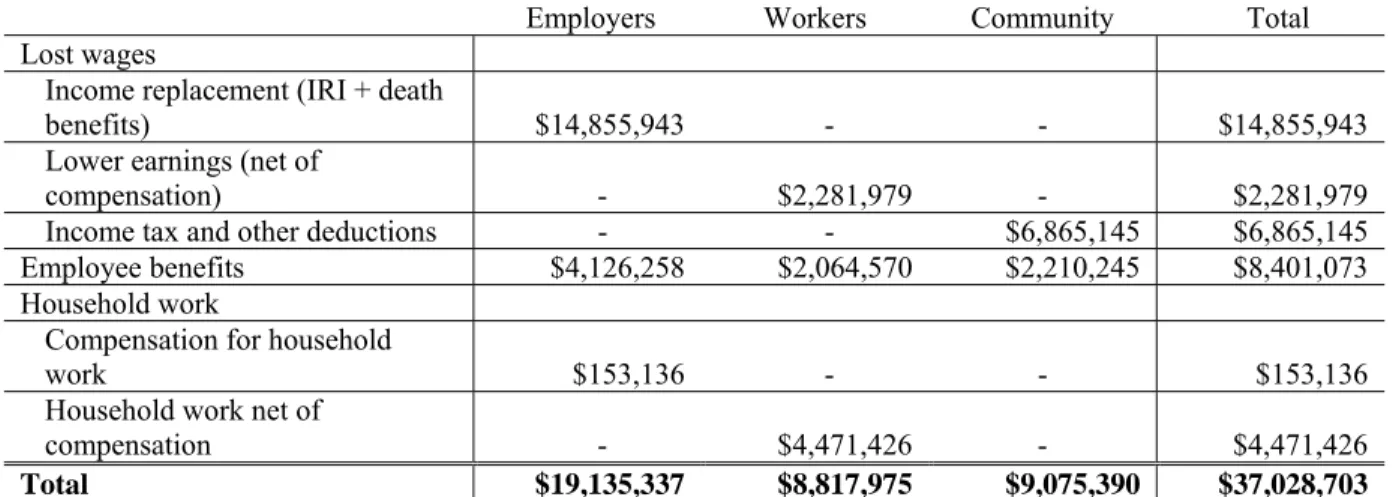
4.5 Productivity losses
In this report, the productivity lost due to occupational injuries corresponds to the value of the paid and unpaid work that is no longer performed by the injured worker. In the following sections, we describe how it was possible to arrive at these estimates.
4.5.1 Lost wages
The estimation of productivity losses with respect to paid work is based on the principles of the human capital method, i.e. that an individual’s contribution to society can be measured by his contribution to the gross domestic product (GDP).23 In other words, the decrease in productivity corresponds to the decrease in GDP. From this standpoint, it is society’s capacity for producing goods and services that is of primary interest. In addition, the worker’s contribution to GDP can be estimated as his gross earnings (before income tax), which corresponds to the marginal productivity of his work. Therefore, we multiply the worker’s gross pay by his time away from work.
To produce these estimates, the injuries were separated into two categories: non-fatal injuries and fatal injuries. For the non-fatal injuries, the worker’s daily gross pay was simply multiplied by the number of compensated days.
For the fatal injuries, the human capital method was used. This method accounts for the future gross earnings from the year of death to the expected year of retirement. Inspired by Rice et al. (1989), the overall model is as follows:
(1) where
- PV is the present value of future earnings;
- Ps,y,n is the probability that a person of sex s and of age y will survive to age n;
- S is the worker’s annual pay before the injury;
23 Statistics Canada defines GDP as an aggregate measure of economic activity that corresponds to the unduplicated value of the goods and services produced in the economic territory of a country or region during a given period.
∑
= − ⎟ ⎠ ⎞ ⎜ ⎝ ⎛ + + × × = 60 , , 1 1 y n y n n y s r g S P PV- g is the rate of increase of labour productivity; - r is the real discount rate.
The retirement age used was 60 years. This figure comes from the Institut de la statistique du Québec (2009), which estimates the average retirement age of Québec employees in 2008 as 60.2 years old.24 The probability of survival comes from the mortality tables published by Statistics Canada (2006). The rate of wage growth attributable to productivity was set at 1%.25 Lastly, the discount rate used was 3% (see section 2.7).
The total lost wages resulting from injured or deceased workers’ withdrawal from the labour market amount to $24,003,067. This loss may be defined as equivalent to the lost production capacity for society. As will be discussed in the remainder of this section, each of the three main economic agents identified in this report assumes part of these costs.
Lost wages assumed by employers
The lost wages resulting from the injured employee’s withdrawal from the labour market are partly covered by employers through income replacement indemnities (IRI) and death benefits paid to the employee and his family. The amount of the income replacement indemnities and death benefits paid by the mining companies during the period under study totalled $10,236,624 and $1,055,977 respectively.26 To this can be added the income replacement indemnities anticipated up to age 65 for injuries for which an IRI has been paid to an unemployable worker or to a worker due to his age (see section 2.6). These indemnities amount to $3,563,342. The total of the income replacement indemnities and death benefits assumed by the employers is thus $14,855,943.
Lost wages assumed by workers
For the worker, the lost wages correspond to the difference between his pay before and after the injury. First, during the benefit period, these lost wages are measured as the difference between the income replacement indemnity that the worker received and his take-home pay. Then, once the injury is “repaired”, the worker may change career paths, which can have an impact on his pay. Lastly, when a work accident results in the death of a worker, the deceased’s family has to absorb a drop in family income.
At the CSST, the income replacement indemnity corresponds to 90% of net employment income up to the maximum annual insurable earnings.27 During the indemnization period, the workers
24 This is the most recent datum published by the ISQ when this report was written. We preferred not to make any assumptions about changes in the retirement age.
25 According to a document published by the Institut de la statistique du Québec (ISO, 2010b), labour productivity grew at an annual average rate of 0.9% in Québec over the 2000–2009 period. In addition, the productivity growth rate usually assigned in the literature is 1%.
26 To avoid double-counting, the compensated funeral expenses have been subtracted from the death benefits.
27 The maximum insurable gross earnings for 2005, 2006, and 2007 are $56,000, $57,000, and $59,000
respectively. .
therefore have to absorb lost wages equivalent to 10% of their net income. This 10% of net income can be estimated using a simple calculation:
(2) These costs amount to $1,533,330. However, they correspond to only a part of the lost wages assumed by workers during the indemnity period. Actually, in the mines there are many workers with earnings higher than the maximum insurable earnings. For these workers, the lost wages can be much greater. To estimate these costs, we first measured the amount of gross income that exceeded the insurable maximum.28 Then, assuming an income tax rate of 50%, the loss of net earnings corresponds to 50% of the overage. These losses total $473,197. Thus, the total lost wages for workers during the indemnity period are $2,006,527.
When a worker dies, the family’s income decreases by an amount equivalent to the worker’s total net income up to the expected age of retirement. To estimate this loss, we used equation (1) above. However, to measure the loss only for the deceased’s family and not for society as a whole requires using the net earnings, which are not included in the CSST database. To obtain the net earnings, we converted the gross earnings using the Table des indemnités de remplacement du revenu [income replacement indemnity table] published by the CSST in 2006. In making the conversions, we assumed that the deceased workers were all bachelors without dependants.29 The table allows gross earnings to be estimated up to the insurable maximum for the year 2006 ($57,000). For gross earnings above the insurable maximum, we applied an income tax rate of 50%. The lost wages resulting from the deaths of mining workers and assumed by the victims’ families are estimated at $1,331,429. However, from that amount must be subtracted the death benefits received from the CSST. Thus, the lost wages assumed by the victims’ families total $275,452.30
The total lost wages assumed by workers and their families are therefore $2,281,979.
Lost wages assumed by the community
The loss of wages can also have an impact on the community. First, there is a decrease in government tax revenues. For example, the income replacement indemnities received by the worker in lieu of lost wages are not taxable. Thus, lost wages entail a loss of income tax (Gosselin, 2004). In addition, the worker receiving the income replacement indemnity is not required to contribute to employment insurance, the Québec parental insurance plan, or the Québec pension plan. Not contributing does not penalize the worker, who retains his rights with respect to these plans and programs. Thus, it is everyone who contributes to these plans and programs who has to absorb the related costs.
28 We have used the average maximum insurable earnings for the period, i.e. $57,333.33.
29 As the database used contains no information of a personal nature (marital status, number of dependants, etc.), these assumptions had to be made. They may have entailed an underestimation of the net earnings and thus of the losses of pay for the victims’ families.
30 It should be noted that this type of cost applies only to deaths of workers age 60 or under.
10% 90% IRI income net of 10% = ×