Laboratoire Environnement Ressource des Pertuis charentais, Ifremer, La Tremblade
Laboratoire de Génétique et Pathologie, Ifremer, La Tremblade
Jean-François Pépin Avril 2013 - RST/LER-PC/13-04
SHORT TECHNICAL REPORT
for
OsHV-1 detection and quantification
by Real Time Polymerase Chain Reaction
using OsHV-1 DNA polymerase sequence
SHORT TECHNICAL REPORT
for
OsHV-1 detection and quantification
by Real Time Polymerase Chain Reaction
using OsHV-1 DNA polymerase sequence
The present report completes a previously described procedure routinely used for the detection and quantification of OsHV-1 by Sybr green Real Time Polymerase Chain Reaction targeting the OsHV-1 DNA polymerase sequence.
This report can be considered as an appendix of the Standard Operating Procedure (SOP) “OsHV-1 detection and quantification by Real Time Polymerase Chain Reaction using OsHV-1 DNA polymerase sequence”.
Fiche documentaire
Numéro d'identification du rapport :
Diffusion : libre : restreinte : interdite : Validé par : Arzul Isabelle
Adresse électronique : [email protected]
date de publication : avril 2013 nombre de pages :
bibliographie : oui illustration(s) : figures langue du rapport : ENG Titre de l’article : SHORT TECHNICAL REPORT for OsHV-1 detection and quantification by Real Time Polymerase Chain Reaction targeting the OsHV-1 DNA polymerase sequence
Contrat no Rapport intermédiaire Rapport définitif
Auteur(s) principal (aux) : Pepin J.F.
Organisme / Direction / Service, laboratoire
Ifremer / Laboratoire Environnement Ressource des Pertuis charentais, Ifremer, La Tremblade
Contributeur(s) : Jean-François Pépin, Delphine Tourbiez
Laboratoire Environnement Ressource des Pertuis charentais, Ifremer, La Tremblade
Laboratoire de Génétique et Pathologie, Ifremer, La Tremblade
Cadre de la recherche : Destinataires : Ifremer
Résumé
Abstract : The present report completes a previously described procedure routinely used for the detection and quantification of OsHV-1 by Sybr green Real Time Polymerase Chain Reaction targeting the OsHV-1 DNA polymerase sequence.
More particularly, this document brings information about analytical sensitivity, quantitation limit, assay precision, reproducibility of the technique.
Mots-clés : PCR quantitative HDP-F/R, virus OsHV-1, diagnostic, DNA polymerase, validation
4
The present report completes a previously described procedure routinely used for the detection and quantification of OsHV-1 by Sybr green Real Time Polymerase Chain Reaction assay targeting the OsHV-1 DNA polymerase sequence.
This report can be considered as an appendix of the Standard Operating Procedure (SOP) “OsHV-1 detection and quantification by Real Time Polymerase Chain Reaction using OsHV-1 DNA polymerase sequence” (available on the website of the EURL for mollusc diseases).
This appendix presents unpublished information about analytical sensitivity, quantitation limit, assay precision, reproducibility of the technique.
Ifremer, Laboratoire de Génétique et Pathologie, Av. de Mus de Loup, 17390 La Tremblade, France .
http://www.eurl-mollusc.eu/
OsHV-1 detection and quantification by Real Time Polymerase Chain Reaction (1st edition, March 2011)
http://www.eurl-mollusc.eu/content/download/42545/578238/file/OsHV-1%20RTPCR_1.pdf
5
Technical appendix of to the Standard Operating Procedure (SOP) for OsHV-1 detection and quantification by Real Time Polymerase Chain Reaction targeting the OsHV-1 DNA polymerase sequence
Preamble:
Sybr green Real Time Polymerase Chain Reaction targeting the OsHV-1 DNA polymerase sequence.
Additional specific assays were carried out in order to define the analytical sensitivity, quantitation limit, assay precision, reproducibility of the Sybr green Real Time PCR assay targeting the OsHV-1 DNA polymerase sequence using primers HDPF - HDPRFR (forward,
HVDP-F 5’ATTGATGATGTGGATAATCTGTG 3’, reverse, HVDP-R 5’ GGTAAATACCATTGGTCTTGTTCC 3’).
In the context of this work, fluorescence threshold was determined based on the background noise by selecting the Background-based threshold option in our setup software.
Cycle threshold (CT) values were calculated by determining the point at which the fluorescence exceeded a threshold limit (10 times the standard deviation of the baseline of the background signal).
1- Determination of the detection limit, LOD:
Quantitation limit of the Real Time PCR assay was determined according to the following standards: experimental standard XPT 90-471 for Legionnella DNA PCR detection and/or XP U47-600-1 «Requirements and recommendations for the implementation of PCR in animal health».
The detection limit, LOD or Analytical sensitivity, was defined as the lowest number of GU, genomic unit, generating a positive result (amplification); in 9 out of 10 cases related to XPT 90-471, or in 8 out of 8 related to XP U47-600-1.
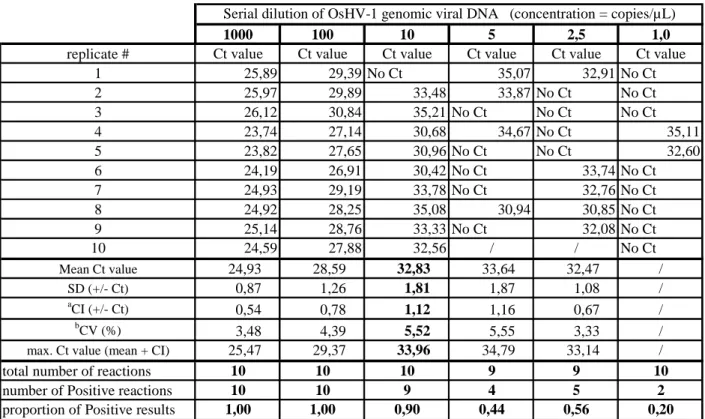
In order to determine the LOD, 2 independent assays were performed as follows: serial dilutions of OsHV-1 genomic DNA from 1000 to 1 DNA copies/µL were tested in 10 replicates.
Results are presented in Table 1: 9 positive amplification reactions were obtained from 10 replicates for the dilution corresponding to 10 DNA copies/µL while less than 50% positive detection was observed for dilution corresponding to 5 DNA copies/µL. In our conditions, the limit of detection of the method was thus estimated to be 10 DNA copies/µL.
Erreur ! Il n'y a pas de texte répondant à ce style dans ce document. 6
Table 1: Results of the Real Time PCR tests of serial dilutions of OsHV-1 genomic DNA
a
CI: Confidence Interval, calculated from Ct values to determine confidence limits using: alpha-risk is 5%, standard deviation, n =10.
bCV: Coefficient of Variation, calculated from Ct values, dimensionless measure of variability (relative standard deviation) defined as standard deviation divided by the arithmetic mean, reported as a
percentage.
2- Determination of the quantitation limit, LOQ:
The quantitation limit, LOQ, was defined as the lowest number of GU, genomic unit that can be reliably quantified with an acceptable level of precision and accuracy.
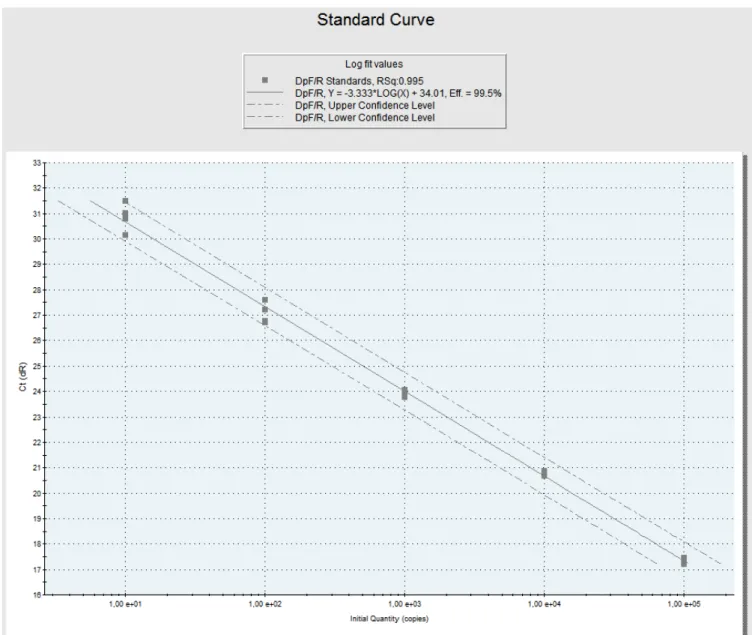
PCR efficiency (E) was calculated from standard curves as the percentage of template molecules that was doubled during each cycle ([10(−1/slope) −1]×100), with requirements that it fell into the range 95–105% and that the coefficient of determination (R2) was >0,98.
To determine the analytical sensitivity of the assay, serial dilutions of viral genomic DNA were tested in the context of six different experiments including triplicates for each dilution (data not shown). A linear relationship was observed between the input copy number of viral DNA template (X) and the associated Ct values (Y) (Fig. 1; Y = -3,333*LOG(X) + 34,01; E = 99,5%; R2 = 0,995). Accurate quantification of 10 DNA copies/µL was obtained associated with a mean CT value ~ 32,0 +/- CI 5% = 0,97 and an acceptable coefficient of variation CV = 4,8%.
1000 100 10 5 2,5 1,0
replicate # Ct value Ct value Ct value Ct value Ct value Ct value
1 25,89 29,39 No Ct 35,07 32,91 No Ct 2 25,97 29,89 33,48 33,87 No Ct No Ct 3 26,12 30,84 35,21 No Ct No Ct No Ct 4 23,74 27,14 30,68 34,67 No Ct 35,11 5 23,82 27,65 30,96 No Ct No Ct 32,60 6 24,19 26,91 30,42 No Ct 33,74 No Ct 7 24,93 29,19 33,78 No Ct 32,76 No Ct 8 24,92 28,25 35,08 30,94 30,85 No Ct 9 25,14 28,76 33,33 No Ct 32,08 No Ct 10 24,59 27,88 32,56 / / No Ct Mean Ct value 24,93 28,59 32,83 33,64 32,47 / SD (+/- Ct) 0,87 1,26 1,81 1,87 1,08 / a CI (+/- Ct) 0,54 0,78 1,12 1,16 0,67 / b CV (%) 3,48 4,39 5,52 5,55 3,33 / max. Ct value (mean + CI) 25,47 29,37 33,96 34,79 33,14 /
total number of reactions 10 10 10 9 9 10
number of Positive reactions 10 10 9 4 5 2
proportion of Positive results 1,00 1,00 0,90 0,44 0,56 0,20
Erreur ! Il n'y a pas de texte répondant à ce style dans ce document. 7
The dynamic range for the real-time PCR was estimated from several standard curve assays. A linear relationship was obtained between input copy number of the viral DNA template and CT value for over 5 log10 dilutions. It was possible to quantify OsHV-1 DNA copy numbers at least from 10 to 1×10⁵ copies/µL (Fig. 1).
Quantitation limit of the technique in our conditions is thus 10 DNA copies/µL
Figure 1: Linearity and sensitivity of SYBR® Green real-time PCR using HDPF -HDPR primer pair and dilutions of viral genomic DNA. A linear regression plot of the SYBR® Green assay standard curve is shown (X, log10 copy number; Y, CT value) for the standard curve.
Erreur ! Il n'y a pas de texte répondant à ce style dans ce document. 8
3- Specificity of the assay
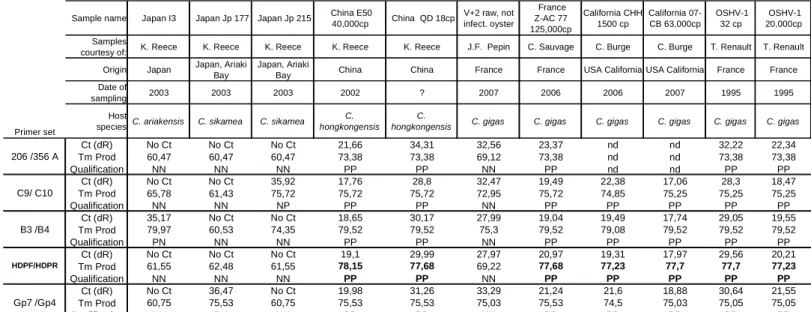
In order to determine the ability of the assay to amplify only OsHV-1 DNA, the Tm value of amplified products from the melt curve was systematically checked. In our conditions (device, settings, reagents), standard and positive samples gave a specific peak at Tm= 77.2 ±0.4 °C. Samples yielding non-specific amplicons were considered to be negative. The NTCs (no template control) had Ct values over 37 cycles or ‘No Ct’ and no specific peak was observed. The size of real-time PCR amplicons was checked by agarose gel electrophoresis, and bands were observed at the expected size (197 bp). In addition, OsHV1 infected samples from various locations and different hosts were tested in duplicate to compare the specificity of the present Real Time PCR assay with previously published data obtained using other primer sets (C9/C10, Barbosa-Solomieu et al, 2004 ; B3/B4, Arzul et al, 2001; Gp7/Gp4, Pepin et al. 2008; 206/356A, Burge et al. 2008; HDPF/HDPR, Webb et al, 2007 ).
All tested samples showed concordant results whatever the primer set was (Table2).
Table 2 : Comparison of results obtained for infected samples of different origin and host using different primer sets (1st column)
Sample name Japan I3 Japan Jp 177 Japan Jp 215 China E50
40,000cp China QD 18cp V+2 raw, not infect. oyster France Z-AC 77 125,000cp California CHH 1500 cp California 07-CB 63,000cp OSHV-1 32 cp OSHV-1 20,000cp Samples
courtesy of: K. Reece K. Reece K. Reece K. Reece K. Reece J.F. Pepin C. Sauvage C. Burge C. Burge T. Renault T. Renault Origin Japan Japan, Ariaki
Bay
Japan, Ariaki
Bay China China France France USA California USA California France France
Date of
sampling 2003 2003 2003 2002 ? 2007 2006 2006 2007 1995 1995
Primer set
Host
species C. ariakensis C. sikamea C. sikamea
C. hongkongensis
C.
hongkongensis C. gigas C. gigas C. gigas C. gigas C. gigas C. gigas
Ct (dR) No Ct No Ct No Ct 21,66 34,31 32,56 23,37 nd nd 32,22 22,34 Tm Prod 60,47 60,47 60,47 73,38 73,38 69,12 73,38 nd nd 73,38 73,38 Qualification NN NN NN PP PP NN PP nd nd PP PP Ct (dR) No Ct No Ct 35,92 17,76 28,8 32,47 19,49 22,38 17,06 28,3 18,47 Tm Prod 65,78 61,43 75,72 75,72 75,72 72,95 75,72 74,85 75,25 75,25 75,25 Qualification NN NN NP PP PP NN PP PP PP PP PP Ct (dR) 35,17 No Ct No Ct 18,65 30,17 27,99 19,04 19,49 17,74 29,05 19,55 Tm Prod 79,97 60,53 74,35 79,52 79,52 75,3 79,52 79,08 79,52 79,52 79,52 Qualification PN NN NN PP PP NN PP PP PP PP PP Ct (dR) No Ct No Ct No Ct 19,1 29,99 27,97 20,97 19,31 17,97 29,56 20,21 Tm Prod 61,55 62,48 61,55 78,15 77,68 69,22 77,68 77,23 77,7 77,7 77,23 Qualification NN NN NN PP PP NN PP PP PP PP PP Ct (dR) No Ct 36,47 No Ct 19,98 31,26 33,29 21,24 21,6 18,88 30,64 21,55 Tm Prod 60,75 75,53 60,75 75,53 75,53 75,03 75,53 74,5 75,03 75,05 75,05 Qualification NN PN NN PP PP NN PP PP PP PP PP
N: reaction/well with Negative Tm P: reaction/well with Positive Tm
Tm : melting temperature from dissociation curve No Ct : no available fluorescence signal nd : not done Gp7 /Gp4 206 /356 A C9/ C10 B3 /B4 HDPF/HDPR
Erreur ! Il n'y a pas de texte répondant à ce style dans ce document. 9
DNA copies/µL Test A Test B Test C Test D Mean CT SD CV% Intra-assay variability Mean CT Mean CT Mean CT Mean CT
1,0E+05 17,68 18,12 19,02 17,29 18,03 0,74 4,1 1,0E+04 20,67 21,14 22,28 20,74 21,21 0,75 3,5 1,0E+03 23,92 25,00 25,47 23,89 24,57 0,79 3,2 1,0E+02 27,23 28,73 29,52 27,03 28,13 1,20 4,3 1,0E+01 30,69 34,06 32,98 30,81 32,13 1,66 5,2 4,06+/- 0,75 Mean±S.D. (CV%) Intra-assay variability 1 2 3 4 5 Mean (CT) SD CV % Mean±S.D. of CV% 1,0E+05 17,86 18,18 17,83 17,59 17,87 17,87 0,21 1,2 1,0E+04 21,3 21,02 21,22 20,78 20,61 20,99 0,29 1,4 1,0E+03 24,56 24,93 24,8 24,28 23,97 24,51 0,39 1,6 1,70 +/- 0,8 1,0E+02 28,34 28,32 28,38 27,55 27,96 28,11 0,36 1,3 1,0E+01 31,92 33,9 31,41 31,62 31,84 32,14 1,00 3,1 CT values DNA copies/µL 4- Assay precision
Intra-assay variability or repeatability, was estimated by testing five dilutions of viral DNA in five replicates simultaneously in the same plate (Table 3). The mean intra assay coefficient of variation calculated from the 5 replicate Ct values was 1,7% ± 0,8, which is acceptable and corresponds to high accuracy (<2,5%) (Reed al., 2002).
Inter-assay variability was estimated by testing five dilutions of viral DNA in 3 replicates in the context of four experiments carried out on different days (Table 4). The mean inter assay coefficient of variation calculated from the 4 experiments was 4,0 ± 0,7%, which is acceptable (<5%).
Table 3 :
Intra-assay variability calculated from 5 replicates of a same OsHV-1 viral DNA dilution on the same plate. SD : Standard deviation. CV: Coefficient of Variation
Table 4 :
Erreur ! Il n'y a pas de texte répondant à ce style dans ce document. 10
5- Reproducibility: Real Time Polymerase Chain Reaction targeting the OsHV-1 DNA polymerase sequence
In 2011, the National reference laboratory for mollusc diseases in France (LGPMM, Ifremer La Tremblade) organised an interlaboratory comparison (ILC) to test the competency of fourteen French laboratories to detect OsHV-1 by The Real Time PCR assay targeting the OsHV-1 DNA polymerase sequence (Garcia et al., 2012). . The test included thirty oyster tissue samples displaying various controlled levels of viral infections: non-infected, weakly and strong infected samples. Participants had to test samples in duplicate and had to report the status of each sample regarding the presence of viral DNA detection: detected, not detected or indeterminate (qualitative results).
Table 6 presents percentages of ‘good results’ obtained by participants. Specificity and sensitivity were estimated globally and for weak or strong level of infections.
The fourteen laboratories had a 100% median of good results demonstrating the strong reproducibility of the method.
Table 6: Percentages of ‘good results’ for the ILC organised in 2011 by the French NRL for Mollusc diseases. Mean 99,8% Minimum 96,7% First quartile 100% Median 100% Third quartile 100% Maximum 100% Specificity 100%
Sensitivity at strong level of infection 100% Sensitivity at weak level of infection 98,8%
11
References
Arzul, I., Nicolas, J.L., Davison, A.J., Renault, T., 2001. French scallops: a new host for ostreid herpesvirus 1. Virology 290 (2), 342–349.
Barbosa-Solomieu, V., Miossec, L., Vazquez-Juarez, R., Ascencio-Valle, F., Renault, T., 2004. Diagnosis of Ostreid herpesvirus 1 in fixed paraffin embedded archival samples using PCR and in situ hybridisation. J. Virol. Methods 119, 65–72.
Caraguel, C.G.B., H. Stryhn, N. Gagne, I. R. Dohoo, and K. L. Hammell, 2011. Selection of a cut-off value for real-time polymerase chain reaction results to fit a diagnostic purpose: analytical and epidemiologic approaches. J. Vet. Diagn. Invest. 23: 2:15.
Colleen A. Burge, Jean-François Pepin, Nicole Faury, Tristan Renault, and Carolyn S. Friedman, 2008. Using Quantitative Polymerase Chain Reaction (Q-PCR) to detect and quantify the oyster herpesvirus (OsHV). Book of Abstracts, 100th Annual Meeting, April 6–10, 2008, National Shellfisheries Association, Providence, Rhode Island. Journal of Shellfish Research, Vol. 27, No. 4: 992.
Garcia Celine, Pepin Jean-Francois, Travers Marie-Agnes, Arzul Isabelle, Joly Jean-Pierre, Omnes Emmanuelle, Tourbiez Delphine, Chollet Bruno, Robert Maeva, Haffner Philippe, Haond Christophe, Francois Cyrille, Lupo Coralie, Guichard Benjamin, Bertrand Claire, Couraleau Yann, Faury Nicole, Renault Tristan, 2012. Rapport annuel 2011 du Laboratoire National de Référence pour les maladies des mollusques marins.
Pépin J.F., Riou A., Renault T., 2008. Rapid and sensitive detection of ostreid herpesvirus1 in oyster samples by real-time PCR. Journal of Virological Methods 149, 269–276.
Reed, G.F., Lynn, F., Meade, B.D., 2002. Use of coefficient of variation in assessing variability of quantitative assays. Clinical and Diagnostic Laboratory Immunology 9, 1235–1239.
Webb, S.C., Fidler, A., Renault, T., 2007. Primers for PCR-based detection of ostreid herpes virus-1 (OsHV-1): application in a survey of New Zealand molluscs. Aquaculture 272, 126–139.