Towards Intuitive Exploration Tools
for Data Visualization in VR
Gerwin de Haan, Michal Koutek, Frits H. Post
Faculty of Information Technology and SystemsDelft University of Technology
Mekelweg 4, 26 28 CD, Delft, The Netherlands Tel. +31-15 278 2528
{g.dehaan, m.koutek, f.h.post}@its.tudelft.nl
ABSTRACT
In this paper we present a basic set of intuitive exploration tools for the data visualization in a Virtual Environment on the Respon-sive Workbench. First, we introduce the Plexipad, a transparent acrylic panel which allows two-handed interaction in combination with a stylus. After a description of various interaction scenarios with these two devices, we present a basic set of interaction tools, which support the user in the process of exploring volumetric datasets. Besides the interaction tools for navigation and selection we present tools that are closely coupled with probing tools. These interactive probing tools are used as input for complex visualization tools and for performing virtual measurements. We illustrate the use of our tools in two applications from different research areas which use volumetric and particle data.
Categories and Subject Descriptors
H.5.2 [Information Interfaces and Presentation]: User Inter-faces – Interaction styles.
General Terms
Algorithms, Design, Human Factors
Keywords
Virtual Reality, Visualization, Data Exploration, Two-handed Interaction, User Interface
1.
INTRODUCTION
Scientific visualization is widely used as a means of interpreting and understanding data and models originating from many scien-tific research areas. The use of graphical data representations ex-ploits the capabilities of the human visual system in recognizing complex patterns and features in the data. Researchers use visuali-zation systems as a tool in an effort to explore and interpret avail-able data from their experiments, measurements or simulations.
Thus the system must provide its users with tools to effectively perform the data exploration task. The interactive nature of this task implies that the man-machine interface plays a prominent role in designing effective visualization applications.
Virtual Reality has a potential to enhance this two-way communi-cation between the researcher and the visualization applicommuni-cation. In contrast to desktop-based 3D visualization applications, the use of stereoscopic, (semi-)immersive displays and spatial interaction devices provides the user with a 3D experience of datasets, al-lowing a quicker exploration. Although VR can provide us with an intensified view of datasets, and more intuitive ways of inter-action with the environment, some problems concerning data exploration tasks that already existed in desktop visualization applications have not been solved. These problems include high interactivity of the visualization system and the Virtual Environ-ment (VE), intuitive navigation in the visual representation of the data and intuitive control of visualization tools and their parame-ters.
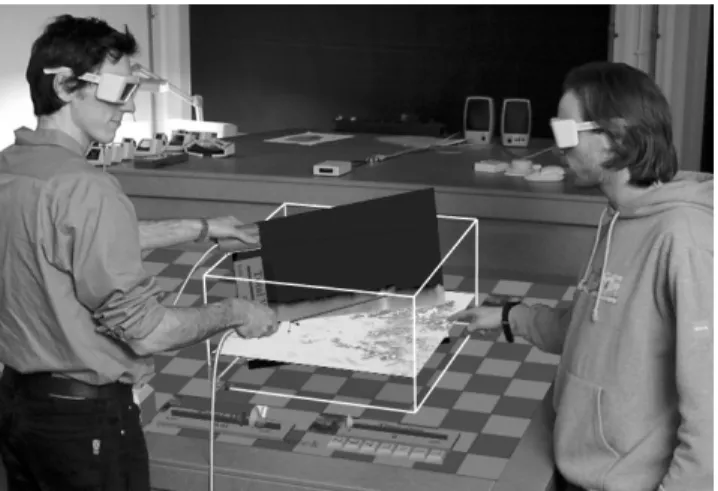
Figure 1. Two-handed exploration tools in data visualization
The datasets from simulations and measurements from various research areas are multi-modal and multidimensional, growing rapidly in size and dimensionality. Advanced visualization tech-niques such as direct volume rendering or iso-surfaces are com-putationally intensive and their performance degrades dramati-cally as the dataset size grows. In addition to these performance implications, the interactive control of the input parameters (e.g. selecting an iso-value or defining a transfer function) to achieve useful graphical representations of the data is a complex task.
Permission to make digital or hard copies of all or part of this work for personal or classroom use is granted without fee provided that copies are not made or distributed for profit or commercial advan-tage and that copies bear this notice and the full citation on the first page. To copy otherwise, or republish, to post on servers or to re-distribute to lists, requires prior specific permission and/or a fee. VRST ’02, November 11-13, 2002, Hong Kong.
Instead of concentrating on the acceleration of visualization tech-niques we focus on the intuitivity and interactivity of the explora-tion process. We use intuitive interacexplora-tion scenarios to support the interest-driven exploration. Intuitive navigation and the use of simple and fast interactive visualization tools provide a useful approach to the effective exploration of volumetric data.
We will first review some related work in the field of two-handed interaction techniques in visualization applications in VEs. Then we present the Plexipad, a transparent acrylic panel, which forms the basis for our two-handed interaction tools on the Responsive Workbench. We define appropriate interaction scenarios using both the Plexipad and the stylus. Based on these interaction sce-narios, we describe our set of implemented exploration tools and their characteristics. We focus our description on navigation and probing tools. After an overview of implementation details, ex-ample visualization applications from different research fields demonstrate the use of our tools in practice. Finally, we present our conclusions and some areas for future work.
2.
RELATED WORK
A good overview of the various challenges of scientific visualiza-tion in VR is given in [9]. One of the main challenges described in this report is to “make interaction comfortable, fast, and effec-tive”. In our paper we concentrate on this topic, focusing on the intuitivity of the interaction techniques involved in the explora-tion and visualizaexplora-tion of data. Based on promising results of working with both input devices simultaneously, we have focused on the use of two-handed interaction techniques.
Numerous studies have shown that Guiard’s framework [4] is useful as a guideline for designing a two-handed interface. His findings in the distribution of labor between two hands in every-day activities not only proved useful for 2D computer drawing interaction schemes [15,16], but was also applicable to the study of two-handed interface scenarios in VEs [1,2,3,12,13]. The fol-lowing types of interaction tasks can be distinguished:
- One-handed task: only one hand performs a task.
- Double one-handed task: each hand performs a separate one-handed task.
- Two-handed task: both hands co-operate to perform a single task.
The division of tasks between hands in the case of two-handed tasks can either be symmetric or asymmetric. A two-handed task is symmetric when both hands perform identical actions. In an asymmetric task, the most common form of two-handed tasks, each hand performs an individual action, involving a complex co-ordination between hands. The dominant hand is the preferred hand for precise movements such as writing, for most people this is the right hand; the non-dominant hand provides guidance and support. For asymmetric two-handed tasks, Guiard described the following principles:
- Dominant to non-dominant reference: the motion of the dominant hand finds its spatial reference in the results of the motion of the non-dominant hand.
- Asymmetric scales: The right and left hand are involved in different motions. The motions of the non-dominant hand tend to be of lower frequency and higher spatial amplitude. In other words, the non-dominant hand is responsible for the
infrequent large motions while the dominant hand has more movements in a smaller area.
- Non-dominant precedence: The movement of the non-dominant hand precedes the non-dominant hand. The non-dominant hand waits for the non-dominant hand to initiate and set the spatial reference before engaging action.
Most of the work in the field of two-handed interaction interfaces concentrates on object manipulation or assembly tasks [2]. In addition, most reports on two-handed interaction in VR deal with two identical input devices for each hand, like wands or gloves. Similar approaches that use a hand held panel and a stylus, are described in [3,12,13]. The use of a transparent panel on a pro-jection based table has been reported in [1], though the panel is not actively used in a visualization process. Alternative ap-proaches to the improvement of man-machine interaction use other input modalities like speech- and gesture recognition. An example of this multi-modal interface in a visualization applica-tion is described in [11].
We use the two-handed task principles to match the interaction scenarios for the tools in our system. These scenarios are reflected by various interaction tools for navigation and probing.
3.
INTERACTION METHODS
The Responsive Workbench (RWB) provides a laboratory table VE. The user stands in the real world and looks down into the virtual world. Instead of bringing the user into the virtual world, the virtual world is brought to the user [10]. The virtual work-space is usually within reach of the user’s hands, but can also be extended under the projection surface. Most of our tools are therefore designed to work both directly and remotely. The pro-jection surface of the RWB provides passive haptic feedback and is suitable for the placement of 2D/3D interaction widgets.
3.1
Input Devices
In our VR set-up we use the following two input devices which are tracked by electromagnetic trackers with six degrees of free-dom (DOF): position and orientation (Figure 2).
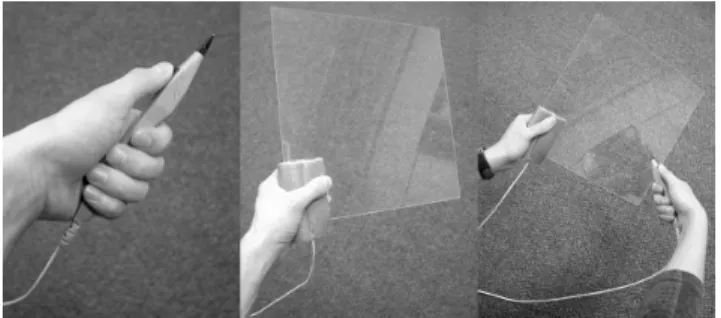
Figure 2. The stylus, the Plexipad and their two-handed use Stylus: a pen-shaped input device with a single button. The pen can define a point in space (zero-dimensional or 0D). The shape of the pen defines a directional reference axis. The pen can be used to intuitively specify a line in 3D space, extending the ac-tions from 0D to 1D. This function is often used by ray-casting selection.
Plexipad: a lightweight transparent acrylic panel (300 x 300 x 2 mm) on which the tracker is mounted. The pad can be used to intuitively position and orient a 2D plane. It defines a 2D
refer-ence plane in 3D space. In contrast to a similar prop presented in [1], the tracker is mounted under a foam handle at the edge of the panel. The handle allows a firm and comfortable palm grip, re-ducing fatigue in the fingers. With the tracker mounted close to the wrist the inconvenience of the tracker cable (obstruction of the view, weight on the panel) is reduced to a minimum.
In our two-handed interaction set-up, the dominant hand holds the stylus while the non-dominant hand holds the Plexipad. The sty-lus and Plexipad are interchangeable, and this allows both right-handed and left-right-handed persons to operate the tools.
3.2
Interaction Scenarios
Based on our input devices and Guiard’s principles of two-handed tasks we have derived the following interaction scenarios:
One-handed interaction: Either the stylus or the Plexipad is actively used to interact with the environment. The stylus is suit-able for direct (0D) or ray-casting (1D) selection and manipula-tion, where the Plexipad allows direct control (positioning and orientation) of objects which are virtually attached to the Plexipad.
Double one-handed interaction: The stylus and the Plexipad are used to perform unrelated one-handed tasks. The Plexipad and stylus each have their own separate functionality: a direct cou-pling between the tools is absent. This scenario allows a combi-nation of stylus-based and Plexipad-based one-handed interaction scenarios. Although this direct relation between the two interac-tion tasks is absent, usually there will be a higher level goal that is pursued.
Symmetric two-handed interaction: Both hands perform identi-cal tasks. This type of interaction task is not likely to be used in our scenarios, considering our use of two distinct input devices. Systems that use two identical input devices like wands or gloves do support symmetric two-handed interaction tools [2].
Asymmetric two-handed interaction: The Plexipad sets the 2D reference plane for the stylus. This combination of the two tools exploits the familiarity with the “pen and pad” metaphor. In addi-tion, the pad provides tactile feedback to the stylus’ movements. The combination of the plane shaped panel and similarly shaped virtual object proves to be very intuitive. It feels as if you are holding the virtual tool in your hand. We distinguish the follow-ing three scenarios for this asymmetric two-handed interaction: - The Plexipad serves as an object container. The Plexipad
is used as a container for 2D and 3D virtual objects or inter-action widgets, which can be manipulated or operated by the stylus.
- The Plexipad constrains the stylus. The actions of the sty-lus are projected on the reference plane defined by the Plexipad. This actively constrains the 3D actions of the sty-lus in a 2D plane (Figure 3, left).
- The Plexipad and stylus are used for a complex interac-tion task. Here the Plexipad and stylus form a pair of input devices that control a single complex interaction task. Exam-ples of this interaction scenario are the selection of a region of interest (Figure 3, right), a 3D lasso selection tool, a mod-eling tool or a cutting tool.
Figure 3. Asymmetric two-handed interaction: constrained actions (left) and complex actions (right)
The Plexipad as a passive object container is widely used and is well suited for hand-held 2D or 3D menus and object snapping. Although we use the Plexipad for this purpose too, we concentrate on more dynamic asymmetric two-handed interaction scenarios. The second scenario uses the Plexipad as a pure 2D reference plane for stylus interaction. In the third scenario however, the Plexipad actively participates in the interaction. This complex interaction has been used mainly with two 0D/1D input devices such as pens or gloves [2]. The 2D plane shape of the Plexipad can be exploited to create more expressive interaction tools. We use the concept of holding two dimensions in one hand (the Plexipad) while the other hand (the stylus) controls the third di-mension.
In the following section we will describe how these interaction scenarios reflect in the design of our interaction tools for naviga-tion and probing.
4.
INTERACTION TOOLS
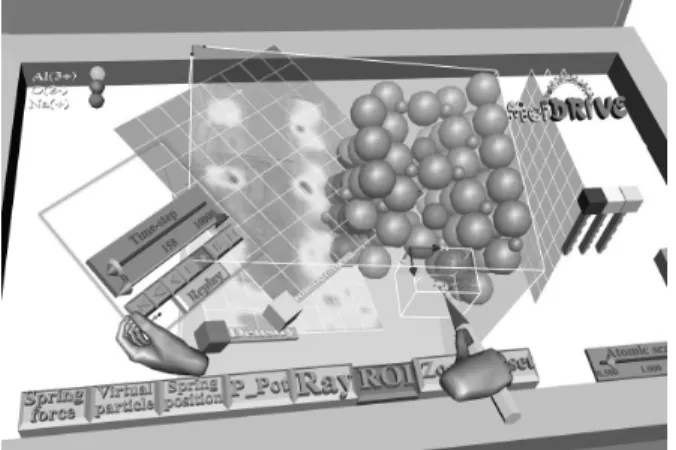
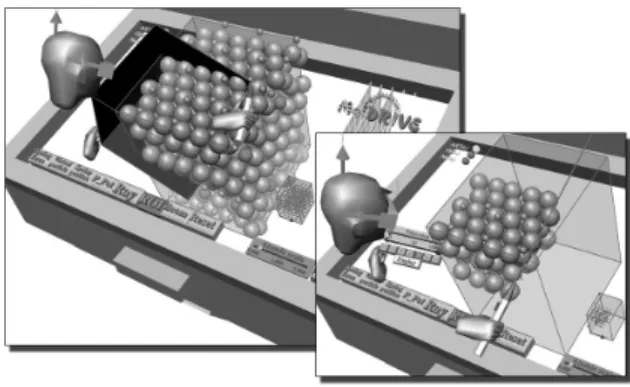
We have implemented a VE for visualization and exploration of data on the RWB (Figure 4). Besides conventional 3D GUI the user can interact with various visualization tools and the data space which can contain both volumetric and object data. The data space is represented as a virtual object, using an outline to indicate the spatial boundaries.
Figure 4. Overview of the VE for data exploration and visualization; (This figure is reproduced in color on page 000.)
In the description of the exploration tools we will use the case of Molecular Dynamics (MD), our testbed during development, to illustrate their functionality. MD is used to study the properties and behaviour of complex particle systems. This application is a good example of combining volumetric information with object information (particles). The various illustrations in this paper
show the study of a solid electrolyte (sodium beta-alumina) which consists of a crystal molecular structure with layers of sodium ions. In the application section the case of MD will be described in more detail.
A typical exploration process begins with a quick spatial and tem-poral scan of the volumetric data for interesting information. If an interesting region or phenomenon has been found in the data, the attention is focused on this aspect of the data. The user then tries to get detailed insight in this data by inspecting or probing the various data values in the neighbourhood, using visualization techniques or measurement tools to explore the data. In our ap-proach we provide interaction tools to support these steps of the exploration process. These can be divided into two main catego-ries: navigation (positioning, orienting, cropping and zooming of the data space) and probing (localized visualization and measure-ment of the data).
4.1
Navigation
In our VR concept we do not see navigation as flying through a VE. Instead we use the laboratory table metaphor, where the po-sition of the VE with respect to the physical table is fixed. Navi-gation consists of manipulation actions on the data space object which contains all data. Common direct or ray-cast manipulation tools can be used to position and orient the data space object. For other types of navigation we have developed the following inter-est-driven tools.
Zoom Tool
The zoom tool allows the user to take a closer look at a point in the data. In naive implementations (e.g. using a slider to adjust the zoom factor), the user has to pay attention to both the manipula-tion of the slider and the size of the object. Moreover, the object will often scale from its origin, thus effectively moving the point of interest to another position. We observed users repeatedly zooming and repositioning in an effort to get a good view of the point of interest in the object. Our “magnifying glass” metaphor is interest driven: click at a point of interest, pull back to zoom, push away to zoom out.
Figure 5. Zoom tool
After activating the zoom tool, the user can specify the point of interest in the VE (Figure 5, stylus position 1). The zooming will occur around this focal point, so that this point will remain sta-tionary. The line from this point to the eyes defines the normal of the reference plane. The user can move the stylus away from the
initial position to adjust the zoom factor. If the stylus is moved towards or away from the eyes, the zoom factor increases or de-creases respectively. This factor is determined by distance d, the perpendicular distance from the stylus (position 2) to the reference plane. To prevent jerky zooming with small movements while allowing large zooming with large movements, we use a non-linear scaling function. Ray-cast zooming can be used to zoom in on distant points (Figure 6).
Figure 6. Ray-cast zoom tool
The zoom tool using the “magnifying glass” metaphor has been found very intuitive, easy-to-learn and useful by users. It has sig-nificantly decreased the time and effort needed for obtaining a more detailed view on a point in space.
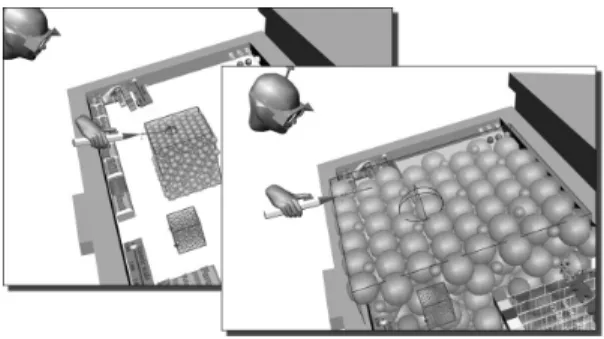
Mini System tool
Using the zoom tool the user can be fully immersed in the data, thus losing orientation. The mini system provides a global context of the data space in the form of a small model (Figure 7). To have good navigation control in the data space we coupled the orienta-tion of the mini system to the data space object. If the user rotates the data space object, the mini system is rotated accordingly. Likewise, if the user rotates the mini system, the data space object is rotated as well. As a result the system and its miniature are al-ways aligned. The data space object is rotated around a point of interest, for which we selected the center of the projection screen. We decided not to share positioning information between the data space and its small version. A small repositioning of the mini system would cause a much greater repositioning of the data space object, thereby confusing the user.
Figure 7. Mini System tool
An advantage of not using the location information of the system is that the mini system can be placed anywhere in the VE. For example, the user can use the mini system to rotate the data space object and then move it out of sight, e.g. to the side of the screen.
Region of Interest tool
The region of interest (ROI) interaction tool allows users to select an arbitrarily oriented 3D box in the VE. The user uses the stylus to define a point in space which will define an extent of the box. The box is created using this click point relative to the Plexipad and the new stylus position as the other extent of the box. While holding the button, the user can move both stylus and Plexipad to dynamically adjust the size and position of the box. In contrast to other two-handed region selections, the Plexipad also defines the orientation of the base plane of the box. This enables the user to not only reposition the box but also to adjust orientation of the box dynamically. The complex asymmetric interaction between the two hands reduces the number of actions, allowing easy crea-tion of axis-aligned boxes as well as arbitrarily oriented boxes in 3D space in a single movement.
Figure 8. Region of Interest tool
In our MD application we use the box to define the volumetric region in which we want to display particles (Figure 8). The tech-nique can also be used for object selection, volume probing or 3D modeling. The Plexipad can control the 2D base of an object while the position of the stylus defines another parameter such as height or extent.
4.2
Probing Tools
The probing tools, which allow the user to inspect the data, work in synergy with the navigation tools. Probing in a dataset is a nec-essary input for various visualization and measurement tools. 3D probes like point probes (0D), line probes (1D), plane probes (2D) and volume probes (3D) are therefore essential in the data exploration process. Without an appropriate feedback it is diffi-cult to freely probe the data in 3D space. We have found that the passive haptic feedback provided by the Plexipad is an excellent support during 3D probing. We take advantage of the two-handed input scenarios defined earlier, using the Plexipad as a 2D refer-ence plane. This referrefer-ence plane forms the basis for the creation and positioning of probes.
Plane Probing
The Plexipad allows the user to freely navigate a 2D plane through the VE. We exploit this intuitive interaction by attaching a plane-shaped probing tool directly to the Plexipad. This consists of a grid of point probes, which perform a trilinear interpolation on the data values in the volumetric data. We directly visualize these data values on the plane-shaped probe by using a textured quad surface. As a result, the user directly controls the position and orientation of the probing tool, slicing through the volumetric data. We call this tool the direct data slicer (Figure 9).
The user holds the direct data slicer in the non-dominant hand and can quickly probe through the volume to get an overview of the data values inside. Concurrently the dominant hand can be used to operate the stylus for manipulation, zooming of the data, and the selection of new tools.
Figure 9. Direct data slicer: A user slices through an atomic density field of a solid electrolyte.
The direct data slicer forms a two-dimensional reference plane for other tools. It not only provides a reference for asymmetric two-handed interaction and passive haptic feedback, but it also pro-vides a visual reference plane in a volumetric dataset. This com-bined feedback assists in a more accurate and intuitive selection of points and lines in 3D space by using the stylus directly on the Plexipad. This assisted or constrained selection can be effectively used to define the input for visualization or measurement tools. The advantage of the plane probe is that it can also serve as a reference plane for other probing tools.
Point Probing
The point probe allows the user to request the data value(s) at a point in 3D space using the stylus. In addition to freehand prob-ing, the direct data slicer can serve as an excellent feedback for constrained probing, by clicking with the stylus on a point of in-terest on the Plexipad (a 0D selection on a 2D slice). An example of using a point probe is the click iso-surface tool, see Figure 10. This tool uses the value of an interactively positioned point probe as the iso-value which is used to create an iso-surface instantly. The iso-surface is generated by the marching cubes module in VTK and transferred to the VE using vtkActorToPF.
Figure 10. Point Probing: The data value on the selected point is used as the input for an iso-surface visualization tool.
Line Probing
Line Probing provides a way of selecting a line in 3D space, which can be used for data probing applications. Again, the direct data slicer can be used to create a 2D reference plane in 3D space, allowing the user to draw a line on the Plexipad (a 1D selection on a 2D slice). An example of Line Probing is using the probed data values along the selected line to define the data range of a color mapper. The color mapper defines the color-coding of the values probed by the direct data slicer. The Line Probe can be used to select a line of interest (LOI) after which the color mapper is calibrated to reveal small variations in the selected profile (Figure 11). This profile can also be used to select an appropriate iso-value for an iso-surface.
Figure 11. Line Probing: The user selects a line of interest to calibrate the gray-scale color mapper in a medical CT-scan. Sub-Volume Probing
The principle of the oriented 3D box described in ROI can be used for probing sub-volumes. One can crop or cut a selected volume of the data, while data slicers probe and visualize the data on the inside faces of the 3D box. The box selection can also be used for direct volume rendering in the given region. It is impor-tant that the user can interactively select and adjust the box while visualizing the data at the same time.
After the initial exploration process, the presented probing tools can be used for interactive quantitative measurement purposes by presenting the probe results in a classic 2D or 3D graph. For ex-ample, the data values along a line of interest can be presented in a 2D graph to visualize the data profile along this line. Another example is to display the results of a point or line probe over a period of time. These dynamic graphs can be placed anywhere in the VE and stored for further analysis. We expect that this data representation will be appreciated by researchers for its analytical character.
5.
IMPLEMENTATION
Our visualization applications run in parallel on a four-processor SGI Onyx2 and are implemented using RWB-Library [6], which is based on Iris Performer and OpenGL.
The RWB-Library and Simulator provide an environment for development of VR applications on the Responsive Workbench. It uses multiprocessing scheme and shared memory. It provides basic and advanced interaction functions for object selection and manipulation and for navigation through the VE. It contains basic set of 3D widgets, like icons, buttons, sliders, 3D text, menus, etc. It greatly assists in building the scene graph hierarchy through the use of generic rwb-objects with callback events, when objects are being selected, manipulated or released. RWB-Library makes the
co-ordinate transformations of Iris Performer easier. Each input tracking sensor has its local co-ordinate system given by pfDCS (Performer Dynamic Co-ordinate System). Virtual (rwb-) objects can be easily connected with these DCS’s, following the motion of the tracker sensors. We also integrated VTK as a visualization engine in our visualization framework.
The RWB-Library uses a default rwb-interactor class, which can select and manipulate objects directly with the stylus or using casting for distant objects. It checks for bounding volume or ray-casting selections, providing the intersection and interaction points (stylus/ray with objects). This class works on the principle of an interaction state automata, driven by interaction events. Rwb-objects can be selected and de-selected, picked (first button click), manipulated and released, each time invoking their event callback function. This way the desired behaviour of virtual ob-jects can be easily implemented.
Using the generic rwb-interactor class we can easily define new interaction tools, like the zoom tool, the ROI tool or the Spring Manipulator [5]. We have implemented two interactor schemes: - The user extension of rwb-interactor first executes the
default rwb-interactor to perform the intersection checks and to obtain a new interaction state and interaction points; then the user interactor function implements the desired behav-iour (examples: ZOOM, ROI, Click-ISO, Probing Tools) - The complete user rwb-interactor overloads the
function-ality of the default interactor and processes itself the input sensors (via RWB-Lib) and implements the desired function-ality (e.g.: Spring Manipulators, Virtual Particle Steering) The activation of the user rwb-interactors can be initiated by clicking on a widget button. The deactivation of the rwb-interactor can be controlled by the tool itself or by activating an-other interactor. For example the zoom tool is automatically deac-tivated after a zoom action and the control is returned to the de-fault rwb-interactor. The design of the interactor determines the way the tool works. The event-based interactors, straightforward co-ordinate transformations between the Plexipad and stylus and the simulator environment all provided by the RWB-Library allow rapid development of new (two-handed) interaction tools.
6.
APPLICATIONS
We will show the interaction scenarios described above on two applications. Visualization and steering of MD simulations have been an important inspiration for our research. Within the scope of MD visualization research we have developed most of the pre-sented interaction techniques. To prove their wider application domain we also applied them in other case studies.
6.1
Particle Steering in Molecular Dynamics
In our VR lab we have developed the MolDRIVE system, a VR system for visualization and steering of real-time remotely run-ning MD simulations [5,7]. As described earlier, MD simulations are used to study properties and behaviour of particle systems. In the MolDRIVE system we work with particle data (positions, force and velocity-vectors) and volumetric data. The volumetric data consists of regularly structured grids of scalar data (e.g. ki-netic energy, potential energy, particle density) and vector data (e.g. force fields). As we are dealing with a real-time simulation, the VE content is updated each time we receive new data. We have used double-buffer data management so that the update of
visualization tools is not disturbed when the simulation delivers new data.
Growing interest for the ability to steer particles of running simu-lations has led us to implement particle steering tools. The most reliable steering is provided by the Spring Force Manipulator [5], which has been derived from the Spring Manipulation Tools, providing visual force feedback during manipulation.
The task of particle steering can be effectively assisted by the direct data slicer. A higher level interaction is achieved when for example the stylus is used for the pulling of a particle while the Plexipad is used to gain information on the potential energy around the particle (Figure 12). In MD simulations the particles usually have preference to move from higher to lower potential. Using the direct data slicer the user can see what the most effi-cient trajectory for the particle can be and then uses the steering tool (Spring Manipulator) to drag the particle in that direction. The interaction of the non-dominant hand itself does notinfluence the reference frame of the stylus. Instead it presents valuable in-formation which can be interpreted to adjust actions with the dominant hand. The visualization tool in the non-dominant hand provides information that allows the user to redirect their simula-tion steering acsimula-tions with the dominant hand.
Figure 12. Molecular Dynamics: The direct data slicer is used to display potential energy around an individual atom during
particle steering with the stylus.
6.2
Visualization of Cloud Simulations
Atmospheric simulations are usually very complex and computa-tionally intensive, and they produce large time-dependent data sets. In this case study we are dealing with data originating from Large Eddy Simulation (LES) with cumulus clouds. Scientists study atmospheric boundary layers to get a better understanding of the turbulent dynamics and the behaviour of clouds (cumulus, stratocumulus). Turbulent convective motions are very important since they are responsible for the vertical transport of heat, mois-ture and pollutants. The presence of clouds in the boundary layer makes the dynamics even richer but forms an additional compli-cation due to the phase changes (condensation / evaporation) [8]. The LES produces with a large dataset (20 GB), with grid dimen-sions of 128x128x80 and 600 time-steps, which means one hour of simulated clouds in an area of 6x6x3 km. The key quantities are
momentum, pressure, temperature and moisture. It is a real chal-lenge to be able to interactively visualize and browse through such a large time-dependent dataset. The exploring user is searching for an interesting cloud with a complete life cycle inside the simulated time-steps. The spatial relations and the simulated physical properties around the selected cloud have to be explored in detail.
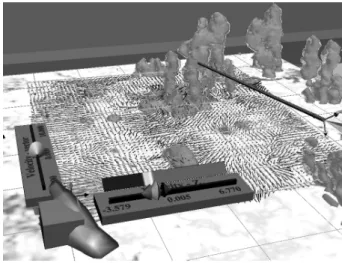
Figure 13. Atmospheric visualization: the direct vector slicer shows flow momentum around clouds (iso-surfaces)
The presented two-handed interaction scenarios have also been applied in this case study. The exploration process begins with a quick search through the dataset. The Plexipad as object container contains our time-control widget, while the stylus can be used for operating it, as well as for navigation in the visualization of the cloud field, see color section – Figure 14.
The direct data slicer can be attached to the Plexipad as well, ena-bling highly interactive exploration of the data (Figure 13). The stylus can be used to probe the data on the surface of the direct data slicer. While using the direct data slicer, the stylus can be used to operate the rest of the VE, using the 3D GUI to change for example the visualized data or adjusting the color mapper. A color mapper widget can also be attached to the data slicer, enabling the color mapping adjustments without changing view context. The LOI tool can be used to calibrate the color mapper on the selected data range.
7.
CONCLUSIONS AND FUTURE WORK
We presented intuitive interaction scenarios for the Plexipad and the stylus, based on well-founded two-handed interaction para-digms. The described interaction scenarios provide a solid ap-proach to the development of intuitive navigation and probing tools. The use of two-handed scenarios proved valuable for the development of volumetric visualization tools in projection-based semi-immersive VEs, like the Responsive Workbench. The com-plex two-handed interaction scenario, holding the two dimensions of the Plexipad in one hand and controlling the third dimension by the stylus in the other, allows the creation of complex but in-tuitive interaction tools. This two-handed synergy between the stylus and the Plexipad allowed intuitive exploration and probing of volumetric data sets.
The combination of the zoom tool, the region of interest tool and the mini system allows a flexible way of navigating through the data and focusing on interesting regions of the data while
main-taining context. The presented direct data slicer can be used to quickly probe large datasets and scan for interesting phenomena in the 3D data space, even during navigation. The tactile and vis-ual feedback provided by this tool also provide a spatial reference plane for various 3D probing tools, allowing a more accurate placement of measurement tools. Moreover, the presented inter-action tools are not computationally intensive and their perform-ance is independent of the data size.
A successful employment of presented interaction concepts needs accurate tracking. The coherence of the Plexipad and the virtual object has to be as good as possible to achieve a good tactile feedback for a more intuitive interaction experience when using the stylus on the Plexipad. As we are using electromagnetic track-ers, we had to implement a special calibration scheme to deal with tracking errors especially in orientation of the Plexipad. Current trends show a good alternative of using optical tracking.
We have presented the interaction tools and a new way of ex-ploring data in 3D to the scientists whose data we visualize and they became very quickly familiar with this exploration interface. We have asked them what is intuitive about this concept. It is exactly the pen and notepad that form a natural interaction pair. Our conclusion at this point is that intuitive data visualization and exploration tools for VR should relate to real tools and interaction paradigms, which are used in real world when the scientists make their observations. Although we give them a slightly different look and functionality, people will have no problems using them. Another aspect is that people are used to work in 3D of the real world. When performing tasks like drawing, construction or measuring, they usually search for a supporting plane or a refer-ence. Measuring freely in the air is difficult. The passive haptic feedback and constraints are significant. In our solution it is pro-vided by the transparent Plexipad, which is augmented by virtual objects and tools with straightforward meaning.
Currently we employ the interaction techniques on various visu-alization applications, of which some were shown as examples in this paper. We work on extending our work with intuitive meas-urement tools. In this framework we will be able to control vari-ous visualization and measurement tools to explore and analyze large multi-modal and multidimensional datasets. The use of our probing tools in combination with complex time-critical visuali-zation tools will allow us to explore and analyze large and com-plex datasets more effectively.
8.
ACKNOWLEDGMENTS
We would like to thank J. van Hees, J. den Hertog, Dr. A.F. Bak-ker and Dr. H.J.J. JonBak-ker for their valuable contribution to the development and testing of the various interaction techniques.
9.
REFERENCES
[1] D. Schmalstieg, L.M. Encarnação, Z. Szalavári, "Using Transparent Props for Interaction With The Virtual Table", Proc. ACM Symp. Interactive 3D Graphics `99, pp. 147-154
[2] L.D. Cutler, B. Fröhlich, P. Hanrahan, "Two-Handed Direct Manipulation on the Responsive Workbench", Proc. ACM Symp. Interactive 3D Graphics '97, pp. 107-114
[3] Z. Szalavári, M. Gervautz, "The Personal Interaction Panel -a Two-H-anded Interf-ace for Augmented Re-ality", Proc. Eu-rographics Computer Graphics Forum '97, 16(3), pp. 335-346
[4] Y. Guiard, "Asymmetric Division of Labor in Human Skilled Bimanual Action: The Kinematic Chain as Model", Journal of Motor Behaviour, 19(4):486-517, 1987
[5] M. Koutek, J. van Hees, F.H. Post, A.F. Bakker, "Virtual Spring Manipulators for Particle Steering in Molecular Dy-namics on the Responsive Workbench", Proc. Eurographics Virtual Environments 2002, Barcelona, pp. 53-62
[6] M. Koutek, F.H. Post, "The Responsive Workbench Simu-lator: a Tool for Application Development and Analysis", Proc. WSCG 2002, Pilsen, Czech Republic, pp. 235-244
[7] J. Van Hees, J. Den Hertog, "MolDRIVE: a system for re-mote interactive MD simulations on a Virtual Reality Re-sponsive Workbench", M.Sc.Thesis TU-Delft, March 2002
[8] A.P. Siebesma and H.J.J. Jonker, "Anomalous scaling of cumulus cloud boundaries", Phys. Rev. Letters, vol. 85, (1), pp. 214-217
[9] A. van Dam, A.S. Forsberg, D.H. Laidlaw, J. LaViola, Jr., R.M. Simpson, "Immersive VR for Scientific Visualization: A Progress Report", IEEE CG&A, Nov/Dec 2000, pp. 26-52
[10]R. van de Pol, W. Ribarsky, L. Hodges, F.H. Post, "Interac-tion techniques on the Virtual Workbench", Proc. of Eu-rographics Virtual Environments '99 workshop, Springer, Vienna, pp. 157-167
[11]J. LaViola, "MSVT: A Virtual Reality-Based Multimodal Scientific Visualization Tool", Proc. Third IASTED Interna-tional Conference on Computer Graphics and Imaging, pp. 1-7, Nov. 2000
[12]R. Lindeman, J. Sibert, J. Hahn, "Hand-Held Windows: To-wards Effective 2D Interaction in Immersive Virtual Envi-ronments", Proc. IEEE Virtual Reality '99, pp. 205-212
[13]S. Coquillart, G. Wesche, "The Virtual Palette and the Vir-tual Remote Control Panel: A Device and an Interaction Paradigm for the Responsive Workbench", Proc. IEEE Vir-tual Reality '99, pp. 213-216
[14]K. Hinckley, R. Pausch, J.C. Goble, N.F. Kassel, "Passive real-world interface props for neurosurgical visualization", Proc. ACM CHI'94, pp. 452-458
[15]P. Kabbash, W. Buxton , A. Sellen, "Two-handed input in a compound task", Proc. ACM CHI'94, pp. 452-458
[16]E.A. Bier, M.C. Stone, K. Pier, W. Buxton, T. DeRose, "Toolglass and Magic Lenses: The see-through interface", Proc. SIGGRAPH '93, vol. 27, pp.73-80