Long-term risks for kidney donors
Geir Mj
en
1, Stein Hallan
2,3, Anders Hartmann
1, Aksel Foss
1, Karsten Midtvedt
1, Ole Øyen
1,
Anna Reisæter
1, Per Pfeffer
1, Trond Jenssen
1, Torbj
rn Leivestad
4, Pa˚l- Dag Line
1, Magnus Øvrehus
2,
Dag Olav Dale
1, Hege Pihlstr
m
1, Ingar Holme
5, Friedo W. Dekker
6and Hallvard Holdaas
11Department of Transplant Medicine, Oslo University Hospital, Oslo, Norway;2Department of Nephrology, St Olav University Hospital, Trondheim, Norway;3Department of Cancer Research and Molecular Medicine, Faculty of Medicine, Norwegian University of Science and Technology, Trondheim, Norway;4Norwegian Renal Registry, Department of Transplant Medicine, Oslo University Hospital, Oslo, Norway;5Department of Preventive Medicine, Oslo University Hospital, Oslo, Norway and6Department of Clinical Epidemiology, Leiden University Medical Center, Leiden, The Netherlands
Previous studies have suggested that living kidney donors maintain long-term renal function and experience no increase in cardiovascular or all-cause mortality. However, most analyses have included control groups less healthy than the living donor population and have had relatively short follow-up periods. Here we compared long-term renal function and cardiovascular and all-cause mortality in living kidney donors compared with a control group of individuals who would have been eligible for donation. All-cause mortality, cardiovascular mortality, and end-stage renal disease (ESRD) was identified in 1901 individuals who donated a kidney during 1963 through 2007 with a median follow-up of 15.1 years. A control group of 32,621 potentially eligible kidney donors was selected, with a median follow-up of 24.9 years. Hazard ratio for all-cause death was
significantly increased to 1.30 (95% confidence interval 1.11–1.52) for donors compared with controls. There was a significant corresponding increase in cardiovascular death to 1.40 (1.03–1.91), while the risk of ESRD was greatly and significantly increased to 11.38 (4.37–29.6). The overall incidence of ESRD among donors was 302 cases per million and might have been influenced by hereditary factors. Immunological renal disease was the cause of ESRD in the donors. Thus, kidney donors are at increased long-term risk for ESRD, cardiovascular, and all-cause mortality compared with a control group of non-donors who would have been eligible for donation.
Kidney International advance online publication, 27 November 2013; doi:10.1038/ki.2013.460
KEYWORDS: cardiovascular events; end-stage kidney disease; kidney donation; kidney transplantation; mortality risk
Living donor kidney transplantation is the preferred treat-ment for end-stage renal disease (ESRD), because it is associated with improved graft and patient survival com-pared with transplantation from a deceased donor.1 Living kidney donation, however, requires that healthy individuals voluntarily undergo major surgery with no physical health benefit to themselves. Although rare, perioperative mortality does occur during organ retrieval from living donors and have been estimated to occur in 0.2% of liver donors and 0.03% of kidney donors.2,3 Less serious perioperative risks are accepted and well documented.3,4 Kidney donation
inevitably leads to reduced renal function and is associated with an increase in proteinuria, as well as a rise in blood pressure (BP) greater than that attributable to normal aging.5,6 These factors are associated with an increased risk
for cardiovascular and all-cause mortality in the general population.7–9
Follow-up studies of living organ donors have not reported increased cardiovascular and all-cause mortality, but results may have been confounded by selection bias in the control groups. In most studies, controls were selected from the general population, which includes adults with medical conditions that would make them ineligible for kidney donation.10–12As a result, these controls would have been less healthy than the living donors and an effect of organ donation on all-cause and cardiovascular mortality could have been underestimated. Three studies have included control groups selected to have comparable health status to the living donors, and each of these demonstrated no increase in cardiovascular disease or mortality over a follow-up time of approximately 6 years.3,13,14 It is possible, however, that
living donors may be at increased risk of death for many years beyond the period that has been investigated to date. Thus an analysis with a longer follow-up time may be necessary to examine the possible impact of living donor nephrectomy. Occurrence of ESRD in living donors has also been observed long term after kidney donation although the absolute number of cases presented has been very low, and it is uncertain whether the statistical assessment used has been sufficient.
Correspondence:Hallvard Holdaas, Section of Nephrology, Department of Transplant Medicine, Oslo University Hospital, Rikshospitalet, Sognsvannsvn 20, Oslo N-0027, Norway. E-mail: [email protected] Received 19 April 2013; revised 26 August 2013; accepted 29 August 2013
The aim of the present study was to estimate long-term all-cause mortality, cardiovascular mortality, and risk for ESRD in kidney donors compared with a selected control group screened for eligibility for live-kidney donation. RESULTS
During 1963–2007, 2269 live-kidney donations were per-formed at Oslo University Hospital. After excluding marginal donors, 1901 donors were included (Figure 1). Among these, 1519 were first-degree relatives, 89 were other relatives, and 293 were unrelated. Median follow-up time was 15.1 (1.5–43.9) years. Mean estimated glomerular filtration rate (eGFR) at donation was 104.7 ml/min per 1.73 m2 (n¼1766, s.d. 13.7). All donors were Caucasians.
Controls were included from the Health Study of Nord-Trndelag (HUNT) population study. Out of the 74,991 individuals participating in this population-based survey, a control group of 32,621 was constructed to fit criteria for kidney donation (Table 1). Median follow-up time for the control group was 24.9 (0.1–26.0) years.
For donors, outcome data on all-cause mortality and renal replacement therapy were ascertained as of January 2010 and cardiovascular mortality as of January 2008. For controls, all outcome data were ascertained as of January 2010.
During the observation period, there were 224 deaths among 1901 kidney donors from the initial inclusion group, 68 (30.4%) of which were due to cardiovascular disease. There were 2425 deaths among the 32,621 controls, 688 (28.4%) of which were due to cardiovascular disease. No donors died during or immediately after the surgical procedure. Figure 2 shows the survival data for donors and
controls. The survival curves were significantly different (Po0.001).
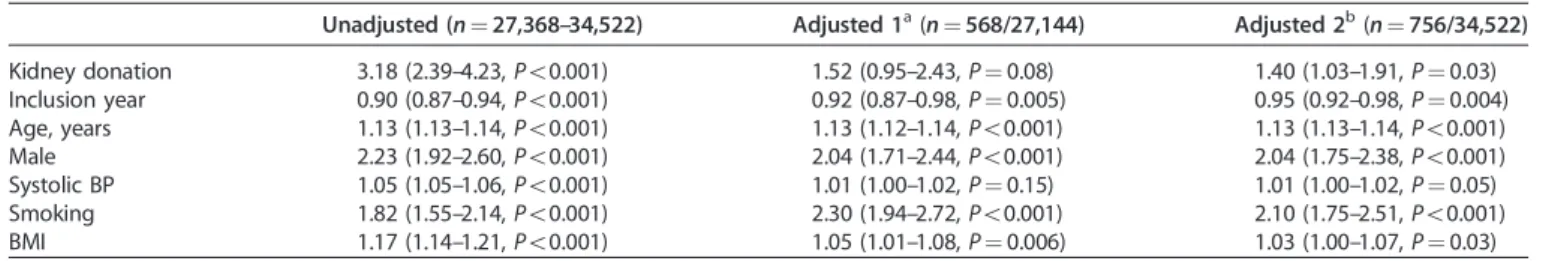
Table 2a shows the hazard ratio (HR) for death by any cause in kidney donors compared with controls. The unad-justed risk associated with kidney donation was 2.49 (95% confidence interval (CI), 2.13–2.91, Po0.001). In adjusted complete case analysis, the HR for kidney donors was 1.48 (95% CI, 1.17–1.88, P¼0.001). After multiple imputation, HR was 1.30 (95% CI, 1.11–1.52, P¼0.001). There was a corresponding increase in cardiovascular mortality (HR 1.40, 95% CI 1.03–1.91,P¼0.03) (Table 2b).
A total of nine donors (0.47%) developed ESRD. All were family members. Median time from donation was 18.7 (10.3–24.3) years. Renal failure in donors was mainly caused by immunological diseases: glomerulonephritis (n¼3), systemic lupus erythematosus (n¼1), Wegener’s granulomatosis (n¼1), ANCA (anti-neutrophil cytoplasmic antibodies)-positive vasculitis (n¼1), sarcoidosis (n¼1), and diabetes/nephrosclerosis (n¼2). In the control group, 22 individuals developed ESRD. Reported causes were glomer-ulonephritis (n¼5), pyelonephritis (n¼4), polycystic kidney disease (n¼4), hypertension (n¼3), diabetes (n¼1), amyloidosis (n¼1), systemic lupus erythematosus (n¼1),
Kidney donors in Norway 1963–2007, n=2269
General adult population in Norway HUNT 1 survey, 1985–1987, n=74,991 Age>70 years (n=89) Age<20 years (n=6) BMI>30 kg/m2 (n=125) BMI<17 kg/m2 (n=1) BP>140/90 mm Hg (n=98) BP medication (n=8) eGFR < 70 ml/min per 1.73 m2 (n=41) Age>70 years (n=12,745) Age<20 years (n=24) BMI>30 kg/m2 (n=1998) BMI<17 kg/m2 (n=23) BP>140/90 mm Hg (n=8964) BP medication (n=4991) Diabetes (n=1348) CVD (n=2765) Reduced general health (n=9512)
Exclusion: Exclusion:
1901 Donors and 32,621 controls fulfilling standard donation criteria
Figure 1 | Flow chart showing inclusion and exclusion of kidney donors and controls.BMI, body mass index; BP, blood pressure; CVD, cardiovascular disease; eGFR, estimated glomerular filtration rate; HUNT 1, Health Study of Nord-Trndelag.
Table 1 | Baseline characteristics of kidney donors and controls
Kidney donors Controls
Age, years 46.0±11.5 n¼1901 37.6±11.7 n¼32,621 Male gender, % 41.0 n¼1901 46.9 n¼32,621 Current smoking, % 41.5 n¼1375 39.5 n¼25,993 Systolic BP, mm Hg 123.3±10.0 n¼1768 121.4±10.4 n¼31,398 Diastolic BP, mm Hg 77.4±7.2 n¼1768 77.2±7.9 n¼31,394 BMI, kg/m2 24.2±2.8 n¼1558 23.5±2.6 n¼31,421
Abbreviations: BMI, body mass index; BP, blood pressure.
0.20 Kidney donors Controls 0.15 Cum u lativ e all-cause mor tality 0.10 0.05 0.00 0 5 10 15 20 25 Time (years)
Figure 2 | Cumulative mortality risk in kidney donors and controls, adjusted for year of donation.Controls are matched to donors for age, sex, systolic blood pressure, body mass index, and smoking status.
drug induced nephropathy (n¼1), medullary cystic disease (n¼1), and unknown (n¼1).
The crude incidence of ESRD in donors was 302 per million person-years. The overall incidence rate for develop-ment of ESRD in Norway is about 100 per million per person-year. After multiple imputation of missing values, the estimated HR for ESRD in kidney donors was 11.38 (4.37–29.63,Po0.001) (Table 2c).
Assessing competing risks for the outcomes of cardiovas-cular death and ESRD did not change our findings. Neither did repeating analyses after excluding donors with eGFR o80 ml/min per 1.73 m2.
DISCUSSION
Our analysis demonstrated a significant increase in ESRD, cardiovascular, and all-cause mortality during long-term
follow-up after living kidney donation compared with a selected population of non-donors who would have met the criteria for donation.
Living kidney donation is associated with a known perioperative mortality risk3 and a small risk of major complications related to the surgical intervention,4 but the use of living donor kidneys has nevertheless become routine. Most published studies have used unselected general popula-tions as the control group,4,10,15,16skewing results in favor of
the donor cohorts as controls with coexisting medical condi-tions such as cardiovascular disease, malignancy, diabetes, hypertension, and chronic kidney disease were included that would have made them ineligible for kidney donation. Clearly, living donors are very carefully selected and an appropriate comparison group should be selected in a similar manner. Linet al.17demonstrated that applying donor health
Table 2a | Hazard ratio for death by any cause in kidney donors versus controls
Unadjusted (n¼27,368–34,522) Adjusted 1a(n¼2038/27,144) Adjusted 2b(n¼2649/34,522)
Kidney donation 2.49 (2.13–2.91,Po0.001) 1.48 (1.17–1.88,P¼0.001) 1.30 (1.11–1.52,P¼0.001) Inclusion year 0.95 (0.93–0.97,Po0.001) 0.95 (0.93–0.98,Po0.001) 0.97 (0.95–0.98,Po0.001) Age, years 1.10 (1.10–1.11,Po0.001) 1.10 (1.10–1.11,Po0.001) 1.10 (1.10–1.11,Po0.001) Male 1.62 (1.49–1.73,Po0.001) 1.44 (1.32–1.58,Po0.001) 1.52 (1.41–1.65,Po0.001) Systolic BP 1.04 (1.03–1.04,Po0.001) 1.00 (1.00–1.01,P¼0.45) 1.00 (1.00–1.01,Po0.24) Smoking 1.64 (1.50–1.79,Po0.001) 1.97 (1.80–2.15,Po0.001) 1.91 (1.74–2.10,Po0.001) BMI 1.12 (1.11–1.14,Po0.001) 1.02 (1.00–1.04,P¼0.06) 1.01 (0.99–1.03,P¼0.21)
Abbreviations: BMI, body mass index; BP, blood pressure.
a
Adjusted for age, gender, year of inclusion, systolic BP, smoking, and BMI.
b
After multiple imputation.
Table 2c | Cox regression analysis for risk of end-stage renal disease in kidney donors versus controls Unadjusted (n¼25,063–35,222) Adjusted 1a(n ¼31/34,522) Adjusted 2b(n ¼31/34,522) Kidney donation 18.99 (8.63–41.76,Po0.001) 11.42 (4.43–29.40,Po0.001) 11.38 (4.37–29.63,Po0.001) Inclusion year 0.76 (0.70–0.83,Po0.001) 0.91 (0.83–1.00,P¼0.04) 0.90 (0.82–0.99,P¼0.03) Age, years 1.04 (1.01–1.07,P¼0.003) 1.03 (1.00–1.06,P¼0.04) 1.02 (0.99–1.05,P¼0.13) Male 0.94 (0.46–1.91,P¼0.86) 1.04 (0.51–2.11,P¼0.10) 0.90 (0.43–1.88,P¼0.77) Systolic BP 1.03 (1.00–1.07,P¼0.14) — 1.01 (1.00–1.06,P¼0.03) Smoking 1.09 (0.48–2.46,P¼0.83) — 1.19 (0.51–2.76,P¼0.68) BMI 1.19 (1.02–1.38,P¼0.03) — 1.13 (0.96–1.32,P¼0.14)
Abbreviations: BMI, body mass index; BP, blood pressure.
a
Adjusted for age, gender, and year of inclusion.
b
After multiple imputation and further adjustments for blood pressure, BMI, and smoking.
Table 2b | Hazard ratio for cardiovascular death in kidney donors versus controls
Unadjusted (n¼27,368–34,522) Adjusted 1a(n¼568/27,144) Adjusted 2b(n¼756/34,522)
Kidney donation 3.18 (2.39–4.23,Po0.001) 1.52 (0.95–2.43,P¼0.08) 1.40 (1.03–1.91,P¼0.03) Inclusion year 0.90 (0.87–0.94,Po0.001) 0.92 (0.87–0.98,P¼0.005) 0.95 (0.92–0.98,P¼0.004) Age, years 1.13 (1.13–1.14,Po0.001) 1.13 (1.12–1.14,Po0.001) 1.13 (1.13–1.14,Po0.001) Male 2.23 (1.92–2.60,Po0.001) 2.04 (1.71–2.44,Po0.001) 2.04 (1.75–2.38,Po0.001) Systolic BP 1.05 (1.05–1.06,Po0.001) 1.01 (1.00–1.02,P¼0.15) 1.01 (1.00–1.02,P¼0.05) Smoking 1.82 (1.55–2.14,Po0.001) 2.30 (1.94–2.72,Po0.001) 2.10 (1.75–2.51,Po0.001) BMI 1.17 (1.14–1.21,Po0.001) 1.05 (1.01–1.08,P¼0.006) 1.03 (1.00–1.07,P¼0.03)
Abbreviations: BMI, body mass index; BP, blood pressure.
a
Adjusted for age, gender, year of inclusion, systolic BP, smoking, and BMI.
b
criteria to an unselected population would yield a group with a lower mortality rate. Such a group would clearly be more relevant for mortality comparisons with living donors, but so far only three studies have been published with appropriate controls.3,13,14 Garg et al.13 used health administration data to identify a control group, excluding individuals with relevant diseases. During a follow-up period of 6 years, they found no survival difference between kidney donors and a selected control group. More recently, Garg et al.14 studied
more complete data from follow-up of donors in a region of Canada, which confirmed the findings of their initial report. Segev et al.3 compared a cohort of kidney donors with a
control group from the third National Health and Nutrition examination Survey study (NHANES III study). Controls were initially selected according to self-reported medical history to fit donor criteria and then a refined match for age, gender, and education. For the overall cohort of donors and controls, the median follow-up time was approximately 6 years. When assessing the influence of BP, body mass index (BMI), and smoking, a smaller cohort was followed for a relatively short time (median 2.1 years).3 Donation was not found to be associated with an increase in all-cause mortality. We also observed no increase in all-cause mortality during the initial 5–10 years after donation, but thereafter the survival curves began to deviate (Figure 2).
In the general population, there is a robust association between reduced kidney function and mortality and premature vascular death. Several studies have reported that increased BP, albuminuria, and reduced renal function are associated with increased all-cause and cardiovascular mortality.7–9These risk
factors are more prevalent in kidney donors following nephrec-tomy.5,6As a result, concerns have been expressed that kidney donation could lead to increased cardiovascular morbidity and mortality.13Despite the inevitable reduction in renal function after nephrectomy, and evidence from the general population, it appears that the medical community has not regarded loss of renal function in living kidney donors as a long-term risk factor for mortality and cardiovascular disease.
The incidence of ESRD in our study was comparable to that seen in some previous studies, although the incidence of ESRD in kidney donors is assumed to be lower than that in the general population.11,15,16,18,19 In our study, the donors
had a substantially increased risk for developing ESRD compared with selected controls. The causes of ESRD were different in donors and controls. Seven out of the nine donors requiring renal replacement therapy had a primary renal disease. This was less common in controls. A likely explanation for the increased risk in donors may be linked to genetic factors, as the majority were immediate family members. It is well known that relatives of patients with chronic kidney disease have an increased incidence of renal disease.20 Accordingly, the increased incidence of ESRD in our cohort of kidney donors could be related to hereditary factors and not only nephrectomy.
There are some limitations to our study. All controls lived within one county, whereas kidney donors were drawn from
all over Norway. We had no data on renal function in the control group, although this information would be likely to increase the observed risks in donors. Longer follow-up time in controls may have influenced detection of ESRD cases. Due to missing data, we could not adjust for the level of education. However, we have previously shown that about one-third of Norwegian donors receive higher education.21 Only 10% of controls are educated to this level. Adjusting for level of education would therefore most likely increase the risk estimates for donors. However, we could not fully adjust for unmeasured confounders, for example, unknown comorbidities or differences in health-related behavior. If we anticipate a beneficial effect of health by close follow-up, the donors will be favored—strengthening our conclusions. Our results may be difficult to extrapolate to unrelated donors and non-Caucasians.18,20
The strength of our study is complete follow-up of all donors and controls with certified causes of death. In the majority of patients, data were available regarding BMI, smoking, and BP, three major cardiovascular risk factors. The major difference between our study and the studies by Garg et al.14and Segevet al.3is the longer follow-up time and the larger number of events.
Our findings raise some medical and ethical considera-tions regarding live-kidney donation. The present study indicates potential increased long-term risks for kidney failure and mortality in kidney donors. However, this has to be put into perspective. Living donor transplantation has been a necessity and essential part of providing patients with ESRD freedom from dialysis and giving the transplanted patients a superior quality of life. Most potential living donors are willing to accept a degree of risk when the recipient is a family member or a close friend. We have, as one of the first transplant centers worldwide, strongly advocated this practice for more than four decades. Our findings will not change our opinion in promoting live-kidney donation. However, potential donors should be informed of increased risks, although small, associated with donation in short-term and long-term perspective.
An accepted ethical principle is that donors who are willing to donate may do so as long as they meet certain health criteria, have sufficient information about the consequences of the donation process, and informed consent has been obtained. Therefore, any newly recognized risks should be implemented in donor information procedures. Further long-term studies with appropriate controls are needed to fully judge the risks of kidney donation.
MATERIALS AND METHODS
In Norway, all kidney transplantations are performed at a single center (Oslo University Hospital, Oslo, Norway), of which 30–40% of kidney transplants are from living donors. When living donation was introduced in the 1970s, only genetically related donors were permitted, but from 1983 spouses became eligible to donate, which extended to close friends in 1995. During the 1970s and 1980s, the high proportion of living donor kidney transplants in Norway was
regarded as pioneering by other Western transplant programs, and means that a relatively large number of donors with long follow-up are available for analysis. Moreover, from the start of the living donor kidney transplant program in the 1970s, Norway established a network of nationwide registries and systems for donor follow-up that now permit accurate evaluation of long-term follow-up.
Potential donors have been evaluated according to the existing guidelines, but medical practice and donation criteria have changed over time. As in most other programs, a few living donors have been allowed to donate after evaluation despite contraindications, such as antihypertensive-treated hypertension, low–normal renal function, or obesity. In the present analysis, these marginal donors were excluded; only donors who were selected according to the standard guidelines were included in the study.22 Exclusion criteria were: antihypertensive medication, BP4140/90 mm Hg, BMI430 kg/m2,
470 years or o20 years of age, macroalbuminuria, or eGFR
o70 ml/min per 1.73 m2(Figure 1). eGFR was calculated using the chronic kidney disease Epidemiology Collaboration equation.23
Healthy matched controls were included from the HUNT 1, a population-based survey carried out between 1984 and 1987. This cohort was selected to allow for sufficient follow-up time. All residents of Nord-Trndelag county, agedX20 years, were eligible, out of which 74,991 (88.1%) took part in the survey. A more comprehensive description of the survey is available at the HUNT study’s website (www.medisin.ntnu.no/hunt/). To achieve appro-priate controls for kidney donors, only subjects with BPp140/ 90 mm Hg and BMIp30 kg/m2 were included. Furthermore, only those who rated their own health as ‘good’ or ‘excellent’ were selected. Individuals with diabetes, cardiovascular disease, or using BP-lowering medication were excluded. Data on renal function and albuminuria were not available for controls.
No donors were lost to follow-up. Information on mortality and cause of death was obtained from Statistics Norway, through a unique 11-digit identification number given to all Norwegian inhabitants at birth. Causes of death were based on International Statistical Classification of Diseases and Related Health Problems (ICD), versions 8–10. Cardiovascular death was defined by ICD-10 codes ranging from I00 through I99. Sudden death (ICD 10 code R99) was not included as cardiovascular death.
All donors and controls with ESRD receiving chronic dialysis treatment or kidney transplantation were identified by cross-linking the identity of donors to the Norwegian Renal Registry. This registry includes all Norwegians receiving renal replacement therapy. The annual report can be accessed at www.nephro.no
Statistical analyses were performed using Stata version 11SE (StataCorp, 4905, StataCorp, College Station, TX). Parametric and non-parametric tests were chosen as appropriate for descriptive comparisons. Cox regression was used to investigate the outcomes of all-cause mortality, cardiovascular mortality, and renal replacement therapy. The proportional hazards assumption was tested using observed versus expected plots and Schoenfeld residuals. Survival analyses were adjusted for age, gender, year of inclusion (donation), systolic BP, smoking status, and BMI.
Due to missing data for smoking (27.4%), systolic BP (6.3%), and BMI (17.3%), survival analyses were repeated after replacing missing data using multiple imputations.24 Missing values were estimated based on known covariates and outcome variables; 20 sets were created and pooled for analysis. Final multivariate analyses after multiple imputations, shown in the tables as ‘adjusted 2’, were considered the main analyses. To enable construction of a survival curve, matching on age, gender, systolic BP, BMI, and smoking was
done using coarsened exact matching.25After multiple imputations and matching, survival curves were constructed adjusted for year of inclusion. For the outcomes of ESRD and cardiovascular mortality, competing risks were assessed by sensitivity analysis and competing risk regression.26,27 In accordance with some center’s practice for pre-donation renal function, Cox regression analyses were repeated with a cutoff for eGFR of 80 ml/min per 1.73 m2, which did not change our results.
DISCLOSURE
All the authors declared no competing interests. ACKNOWLEDGMENTS
This project was supported by a grant from the Norwegian Extrafoundation.
REFERENCES
1. Cohen DJ, St Martin L, Christensen LLet al.Kidney and pancreas transplantation in the United States, 1995–2004.Am J Transplant2006;6: 1153–1169.
2. Middleton PF, Duffield M, Lynch SVet al.Living donor liver transplantation—adult donor outcomes: a systematic review.Liver Transpl2006;12: 24–30.
3. Segev DL, Muzaale AD, Caffo BSet al.Perioperative mortality and long-term survival following live kidney donation.JAMA2010;303: 959–966. 4. Mjoen G, Oyen O, Holdaas Het al.Morbidity and mortality in 1022
consecutive living donor nephrectomies: benefits of a living donor registry.Transplantation2009;88: 1273–1279.
5. Boudville N, Prasad GV, Knoll Get al.Meta-analysis: risk for hypertension in living kidney donors.Ann Intern Med2006;145: 185–196.
6. Garg AX, Muirhead N, Knoll Get al.Proteinuria and reduced kidney function in living kidney donors: A systematic review, meta-analysis, and meta-regression.Kidney Int2006;70: 1801–1810.
7. Go AS, Chertow GM, Fan Det al.Chronic kidney disease and the risks of death, cardiovascular events, and hospitalization.N Engl J Med2004;351: 1296–1305.
8. Matsushita K, van d V, Astor BCet al.Association of estimated glomerular filtration rate and albuminuria with all-cause and cardiovascular mortality in general population cohorts: a collaborative meta-analysis.Lancet2010;
375: 2073–2081.
9. Tonelli M, Wiebe N, Culleton Bet al.Chronic kidney disease and mortality risk: a systematic review.J Am Soc Nephrol2006;17: 2034–2047. 10. Fehrman-Ekholm I, Elinder CG, Stenbeck Met al.Kidney donors live
longer.Transplantation1997;64: 976–978.
11. Ibrahim HN, Foley R, Tan Let al.Long-term consequences of kidney donation.N Engl J Med2009;360: 459–469.
12. Mjoen G, Reisaeter A, Hallan Set al.Overall and cardiovascular mortality in Norwegian kidney donors compared to the background population. Nephrol Dial Transplant2012;27: 443–447.
13. Garg AX, Prasad GV, Thiessen-Philbrook HRet al.Cardiovascular disease and hypertension risk in living kidney donors: an analysis of health administrative data in Ontario, Canada.Transplantation2008;86: 399–406.
14. Garg AX, Meirambayeva A, Huang Aet al.Cardiovascular disease in kidney donors: matched cohort study.BMJ2012;344: e1203.
15. Fournier C, Pallet N, Cherqaoui Zet al.Very long-term follow-up of living kidney donors.Transpl Int2012;25: 385–390.
16. Kido R, Shibagaki Y, Iwadoh Ket al.How do living kidney donors develop end-stage renal disease?Am J Transplant2009;9: 2514–2519.
17. Lin J, Kramer H, Chandraker AK. Mortality among living kidney donors and comparison populations.N Engl J Med2010;363: 797–798.
18. Cherikh WS, Young CJ, Kramer BFet al.Ethnic and gender related differences in the risk of end-stage renal disease after living kidney donation.Am J Transplant2011;11: 1650–1655.
19. Fehrman-Ekholm I, Norden G, Lennerling Aet al.Incidence of end-stage renal disease among live kidney donors.Transplantation2006;82: 1646–1648.
20. Freedman BI, Volkova NV, Satko SGet al.Population-based screening for family history of end-stage renal disease among incident dialysis patients. Am J Nephrol2005;25: 529–535.
21. Mjoen G, Stavem K, Westlie Let al.Quality of life in kidney donors.Am J Transplant2011;11: 1315–1319.
22. Delmonico FA. Report of the Amsterdam Forum on the care of the live kidney donor: data and medical guidelines.Transplantation2005;79: S53–S66.
23. Levey AS, Stevens LA. Estimating GFR using the CKD Epidemiology Collaboration (CKD-EPI) creatinine equation: more accurate GFR estimates, lower CKD prevalence estimates, and better risk predictions. Am J Kidney Dis2010;55: 622–627.
24. Sterne JA, White IR, Carlin JBet al.Multiple imputation for missing data in epidemiological and clinical research: potential and pitfalls.BMJ2009;
338: b2393.
25. Blackwell M, Iacus S, King Get al.CEM: coarsened exact matching in Stata. Stata J Nephrol2009;9: 524–546.
26. Fine JP, Gray RJ. A proportion hazards model for the subdistribution of a competing risk.J Am Stat Ass1999;94: 496–509.
27. Kleinbaum DG, Klein M.Survival analysis: A Self-learning Text, 3rd edn., 2012. Springer: New York, Dordrecht, Heideberg, London.