ST
A
TE EXPENDITURE REPOR
T
STATE
EXPENDITURE
REPORT
N
at i o N a la
s s o C i at i o N o fs
tat eb
u d g e to
f f i C e r s444 North Capitol Street, NW Suite 642 Washington, DC 20001-1511 202.624.5382 Fax 202.624.7745 Founded 1945
Fiscal Y
ear 201
E
X A M I N
I N G
F
I S C A L
2 0 1 1 – 2
0 1 3 S
T A T E
S
P E N D I N
G
Co p y r i g h t © 2013 b yt h e Nat i o N a l as s o C i at i o No f stat e bu d g e t of f i C e r s
Price: $40.00
Nat i o N a l as s o C i at i o No f stat e bu d g e t of f i C e r s
444 North Capitol Street, NW Suite 642
Washington, DC 20001-1511 202.624.5382
Fax 202.624.7745 www.nasbo.org
The National Association of
State Budget Officers
Founded in 1945, is the instrument through which the states collectively advance state budget practices. The major func-tions of the organization consist of research, policy develop-ment, education, training, and technical assistance. These are achieved primarily through NASBO’s publications, membership meetings, and training sessions. Association membership is composed of the heads of state finance departments, the states’ chief budget officers, and their deputies. All other state budget office staff are associate members. NASBO is an inde-pendent professional and educational association and is also an affiliate of the National Governors Association.
2012–2013 Executive Committee
Jason Dilges, South Dakota, President
George Naughton, Oregon, President-Elect
John Hicks, Kentucky, Past President
Linda Luebbering, Missouri, Member-at-Large
Gerry Oligmueller, Nebraska, Member-at-Large
Thomas Mullaney, Rhode Island, Eastern Regional Director
Brian Hayes, Wisconsin, Midwestern Regional Director
Ana Matosantos, California, Western Regional Director
Brandon Sharp, Arkansas, Southern Regional Director
Jerry McDaniel, Florida, Chair, Health and Human
Services Committee
Timothy Keen, Ohio, Chair, Fiscal Management and
Reporting Committee
Karen Rehfeld, Alaska, Chair, Education Committee
George Naughton, Oregon, Chair, Critical Issue Committee
on Lessons Learned from the Downturn
2013–2014 Executive Committee
George Naughton, Oregon, President
Mike Morrissey, Texas, President-Elect
Jason Dilges, South Dakota, Past President
Thomas Mullaney, Rhode Island, Member-at-Large
Gerry Oligmueller, Nebraska, Member-at-Large
Matt Riven, Vermont, Eastern Regional Director
Margaret Kelly, Minnesota, Midwestern Regional Director
Juliette Tennert, Utah, Western Regional Director
Jerry McDaniel, Florida, Southern Regional Director
Michael Cohen, California, Chair, Health and Human
Services Committee
Marc Nicole, Maryland, Chair, Fiscal Management and
Reporting Committee
Brian Hayes, Wisconsin, Chair, Education Committee
Karen Rehfeld, Alaska, Chair, Critical Issue Committee
on Budget Processes in the States
Table of Contents
Preface
... vExecutive Summary
...1General Notes ...12
Chapter 1: Elementary & Secondary Education
...13Elementary & Secondary Education Notes ...20
Chapter 2: Higher Education
...21Higher Education Notes ...28
Chapter 3: Public Assistance
...29Other Cash Assistance ...32
Public Assistance Notes ...42
Chapter 4: Medicaid Expenditures
...43Medicaid Notes ...49
Chapter 5: Corrections Expenditures
...51Corrections Notes ...59
Chapter 6: Transportation
...61Transportation Notes ...68
Chapter 7: All Other Expenditures
...69All Other Expenditure Notes ...76
Chapter 8: Capital Expenditures
...77Capital Spending Notes ...87
Chapter 9: Revenue Sources in the General Fund
...89Revenue Sources in the General Fund Notes ...93
Appendix
...95Child Health Insurance Block Grants Notes ...98
Methodology ...100
Tables
Table 1: Total State Expenditures—Capital Inclusive ...7Table 2: Annual Percentage Change in Total State Expenditures ...8
Table 3: Comparison of Shares of State Spending With Fund Sources, Fiscal 1995 to 2013 ...9
Table 4: Regional Percentage Change in Total Expenditures, Fiscal 2012 and 2013 ...10
Table 5: State Spending by Function As a Percent of Total State Expenditures, Fiscal 2012 ...11
Table 6: Regional Percentage Change in State Elementary and Secondary Education Expenditures, Fiscal 2012 and 2013 ...15
Table 7: Elementary and Secondary Education Expenditures ...16
Table 9: Annual Percentage Change in Elementary and Secondary Education Expenditures ...18
Table 10: Items Excluded from Elementary and Secondary Education Expenditures ...19
Table 11: Regional Percentage Change in State Higher Education Expenditures, Fiscal 2012 and 2013 ...22
Table 12: Higher Education Expenditures—Capital Inclusive ...24
Table 13: Higher Education Expenditures As a Percent of Total Expenditures ...25
Table 14: Annual Percentage Change in Higher Education Expenditures ...26
Table 15: Items Excluded from Higher Education Expenditures ...27
Table 16: Regional Percentage Change in State Total Cash Assistance Expenditures, Fiscal 2012 and 2013 ...31
Table 17: Regional Percentage Change in State TANF Expenditures, Fiscal 2012 and 2013 ...32
Table 18: Total Public Assistance Expenditures ...33
Table 19: Total Public Assistance Expenditures As a Percent of Total Expenditures ...34
Table 20: Annual Percentage Change in Total Public Assistance Expenditures ...35
Table 21: Cash Expenditures under Temporary Assistance to Needy Families Expenditures (TANF) ...36
Table 22: TANF Expenditures for Cash Assistance As a Percent of Total Expenditures ...37
Table 23: Annual Percentage Change in TANF Cash Assistance Expenditures ...38
Table 24: Other Cash Assistance Expenditures ...39
Table 25: Other Cash Assistance Expenditures As a Percent of Total Expenditures ...40
Table 26: Annual Percentage Change in Other Cash Assistance Expenditures ...41
Table 27: Regional Percentage Change in State Medicaid Expenditures, Fiscal 2012 and 2013...45
Table 28: Medicaid Expenditures ...46
Table 29: Medicaid Expenditures As a Percent of Total Expenditures ...47
Table 30: Annual Percentage Change in Medicaid Expenditures ...48
Table 31: Regional Percentage Change in State Corrections Expenditures, Fiscal 2012 and 2013 ...53
Table 32: Corrections Expenditures—Capital Inclusive ...54
Table 33: Corrections Expenditures As a Percent of Total Expenditures ...55
Table 34: Corrections General Fund Expenditures As a Percent of Total General Fund Expenditures ...56
Table 35: Annual Percentage Change in Corrections Expenditures ...57
Table 36: Items Excluded from Corrections Expenditures ...58
Table 37: Regional Percentage Change in State Transportation Expenditures, Fiscal 2012 and 2013 ...63
Table 38: Transportation Expenditures—Capital Inclusive ...64
Table 39: Transportation Expenditures As a Percent of Total Expenditures ...65
Table 40: Annual Percentage Change in Transportation Expenditures ...66
Table 41: Items Excluded from Transportation Expenditures ...67
Table 42: Regional Percentage Change in State All Other Expenditures, Fiscal 2012 and 2013 ...71
Table 43: All Other Expenditures—Capital Inclusive ...72
Table 44: All Other Expenditures As a Percent of Total Expenditures ...73
Table 47: Total Capital Expenditures ...80
Table 48: Higher Education Capital Expenditures ...81
Table 49: Corrections Capital Expenditures ...82
Table 50: Transportation Capital Expenditures ...83
Table 51: Environmental Projects Capital Expenditures ...84
Table 52: Housing Capital Expenditures ...85
Table 53: All Other Capital Expenditures ...86
Table 54: Revenue Sources in the General Fund ...91
Table 55: Items Excluded from Revenue Sources ...92
Table A-1: Total State Expenditures By Fund Source (Excludes Bonds) ...96
Table A-2: Children’s Health Insurance Block Grants ...97
Table A-3: Medicare Part D Clawback Payments ...99
Figures Figure 1: Total State Spending by Fund Source, Fiscal 1987 to 2012 ...2
Figure 2: All Funds Percent Changes From Previous Fiscal Year For Major Spending Categories, Fiscal 2012 and 2013 ...3
Figure 3: Total State Expenditures By Funding Source, Fiscal 2012 ...4
Figure 4: Total State Expenditures By Function, Fiscal 2012 ...4
Figure 5: Composition of Total State Expenditures By Function, Fiscal 1987 to 2012 ...5
Figure 6: General Fund Expenditures, Fiscal 2012 ...6
Figure 7: Percent Change in General Fund, Fiscal 2012 and 2013 ...6
Figure 8: Federal Fund Expenditures, Fiscal 2012 ...10
Figure 9: Regional Percent Change in State Funds, Fiscal 2012 and 2013 ...10
Figure 10: State Expenditures for Elementary and Secondary Education by Fund Source, Fiscal 2012 ...14
Figure 11: State Expenditures for Higher Education by Fund Source, Fiscal 2012 ...22
Figure 12: State Expenditures for Total Public Assistance by Fund Source, Fiscal 2012 ...30
Figure 13: State Expenditures for Temporary Assistance for Needy Families by Fund Source, Fiscal 2012 ...31
Figure 14: State Expenditures for Medicaid by Fund Source, Fiscal 2012 ...45
Figure 15: State Expenditures For Corrections by Fund Source, Fiscal 2012...52
Figure 16: State Expenditures for Transportation by Fund Source, Fiscal 2012 ...62
Figure 17: State Expenditures for All Other Programs by Fund Source, Fiscal 2012 ...70
Figure 18: Capital Expenditures by Type, Fiscal 1991 to 2013 ...78
Figure 19: Annual Percentage Change in Total Capital Expenditures ...79
Figure 20: Total Capital Expenditures by Funding Source, Fiscal 2012 ...79
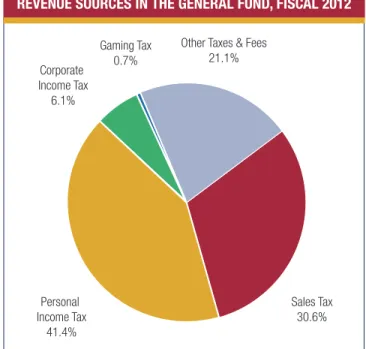
Figure 21: Revenue Sources in the General Fund ...90
Preface
Since its inception in 1987, the State Expenditure Report has developed into a definitive baseline for the analysis of state spending. This edition of the report includes data from actual fiscal 2011, actual fiscal 2012, and estimated fiscal 2013. Expenditures reflected in this report represent more than 99 percent of total state spending.
Expenditure data are detailed by program area so that trends in state spending can be evaluated. The funding sources for state expenditures also are identified. Readers are cautioned that a more complete understanding of service levels within a given state would require comparisons of spending by both state and local governments, which is not the purpose of this report. In addition, the data are self-reported by the states. Additional information on the report’s methodology is provided in the Appendix.
Acknowledgments
The State Expenditure Report was produced by Brian Sigritz with assistance from Lauren Cummings, Stacey Mazer, Michael Streepey, and Kathryn Vesey White. In addition, the report represents substantial work by state budget office staff throughout the United States. NASBO thanks the following individuals for their assistance in providing state data for this report:
Meagan Jones, Alabama
Karen Elliott, Alaska
Michael Williams, Arizona
Crystal Singleton, Arkansas
Genna Dong, California
Alexis Senger, Colorado
Brian Tassinari, Connecticut
John Nauman, Delaware
Steve Burch, Florida
Julie Vickers, Florida
Stephanie Beck, Georgia
Heather Zimmerman, Georgia
Terri Ohta, Hawaii
Anita Hamann, Idaho
Monica Brar, Illinois
Zac Jackson, Indiana
Joel Lunde, Iowa
Elaine Frisbie, Kansas
Sandy Russell, Kansas
John Hicks, Kentucky
Ternisa Hutchinson, Louisiana
Jeremy McDaniel, Louisiana
Melissa Winchenbach, Maine
Cheri Gerard, Maryland
Kurt Stolzenbach, Maryland
Rob Dolan, Massachusetts
Colleen Gossman, Michigan
Joy Thao, Minnesota
Gerald Joyner, Mississippi
Valerie Huhn, Missouri
Ryan Evans, Montana
Lyn Heaton, Nebraska
Maud Naroll, Nevada
Joseph Bouchard, New Hampshire
Cathy Nonamaker, New Jersey
Steven Watson, New Jersey
Michael Marcelli, New Mexico
Greg Armstorng, New York
David Brown, North Carolina
Donna Cox, North Carolina
Lori Anderson, North Dakota
Sheila Peterson, North Dakota
Jeff Newman, Ohio
Brandy Manek, Oklahoma
Brian DeForest, Oregon
Ann Bertolino, Pennsylvania
Gregory Stack, Rhode Island
Quentin Hawkins, South Carolina
Liza Clark, South Dakota
Alex Hanson, South Dakota
Susan Irby, Tennessee
Joaquin Guadarrama, Texas
Tenielle Young, Utah
John Becker, Vermont
Mike Barton, Virginia
Pam Davidson, Washington
Jane Shinn, West Virginia
Dan Subach, Wisconsin
Executive Summary
Overview
Fiscal 2012 was a year of transition for states as they continued to emerge from the national recession. By some measures, state budgets experienced positive growth in fiscal 2012. Gen-eral fund spending increased 3.7 percent while spending from state funds (general funds and other state funds combined) rose 2.3 percent. Additionally, state general fund revenues grew 3.6 percent. However, federal funds to states declined 9.1 per-cent as spending from the American Recovery and Reinvest-ment Act of 2009 (ARRA), also known as the Recovery Act or stimulus, continued to wind down. The combination of state funds slowly increasing and federal funds rapidly declining led to a 1.7 percent reduction in total state expenditures, the first nominal decline in total state expenditures in the 26-year histo-ry of the State Expenditure Report. While total state expendi-tures declined in fiscal 2012, it is estimated that in fiscal 2013 state spending returned to more typical growth levels. State and federal funds are estimated to have grown by 5.3 percent and 2.3 percent respectively in fiscal 2013, resulting in a 4.6 percent increase in total state expenditures.
State Spending Trends
Due to a unique set of circumstances, total state expenditures declined in fiscal 2012 for the first time in the history of the
State Expenditure Report, which began in 1987. In some ways, fiscal 2012 was the culmination of a very distinct time period for state finances. Since the national recession began, state expenditures have seen tremendous shifts. General fund spending, the component of state budgets that comes from revenue sources such as states’ income and sales taxes, was most negatively impacted during the recent economic down-turn. After growing 8.5 percent in fiscal 2007 and 4.2 percent in fiscal 2008, general fund spending declined 2.9 percent in fiscal 2009 and an additional 6.5 percent in fiscal 2010. How-ever, as the national economy slowly improved and states’ revenues began to rebound, general fund spending returned to positive growth. State general fund spending increased 3.9 percent in fiscal 2011 and 3.7 percent in fiscal 2012.
During the time that states’ general fund spending saw signifi-cant declines, federal funds to states experienced sizable increases. After growing a relatively modest 2.9 percent in
fis-2010. The drastic increase in federal funds to states can be traced to the infusion of ARRA (also known as Recovery Act) funds. States reported that they spent $43.2 billion in federal Recovery Act funds in fiscal 2009 and $118.6 billion in fiscal 2010. The flow of ARRA funds began to slow in fiscal 2011 as states reported that they spent $92.8 billion, and slowed even further to $29.4 billion in fiscal 2012. The swift wind down of ARRA funds led federal fund spending to grow only 1.0 per-cent in fiscal 2011 and to decline 9.1 perper-cent in fiscal 2012. The combination of spending from state funds slowly increas-ing and spendincreas-ing from federal funds rapidly declinincreas-ing caused total state expenditure growth levels to slow during the same period that the national economy was beginning to recover. This is largely due to the fact that state revenues did not increase as fast as federal ARRA funds declined. For example, general fund revenues increased $23.3 billion in fiscal 2012, while ARRA funds declined $63.4 billion. Overall, total state expenditures grew 3.8 percent in fiscal 2010 and 3.4 percent in fiscal 2011, and declined 1.7 percent in fiscal 2012. The infusion of additional federal dollars in state budgets from the Recovery Act also produced a shift in the funding sources for state expenditures. Over a two-year period from fiscal 2008 to fiscal 2010, general funds shrunk from representing 45.9 percent of total state expenditures to 38.1 percent, while fed-eral funds rose from 26.3 percent to 34.9 percent. However, due to the expiration of ARRA funds, general funds are starting to once again make up a larger component of total state expenditures. In fiscal 2012, general funds accounted for 40.4 percent of total state expenditures, federal funds 31.4 percent, other state funds 25.9 percent, and bonds 2.3 percent. In fiscal 2013, it is estimated that states have returned to more typical growth levels. General fund spending is estimated to have increased for the third consecutive year, rising by 4.4 percent. The continued growth in general fund spending is directly related to general fund revenues continuing to rise. It is estimated that in fiscal 2013 state general fund revenues increased 5.4 percent, with sales, personal income, corporate income, gaming, and other taxes and fees all experiencing gains. Similarly, spending from state funds (general funds and other state funds combined) also grew in fiscal 2013, rising by an estimated 5.3 percent. Additionally, in contrast to fiscal
es in all the major sources of state funding led total state expenditures to increase by an estimated 4.6 percent in fiscal 2013. Although in many ways state fiscal conditions have sta-bilized in fiscal 2013, states remain concerned about both the short and long term outlook due to the slow pace of econom-ic growth, the uncertainty of federal fund levels, questions regarding the future performance of state revenue, and increased spending demands.
This edition of the State Expenditure Report includes data from actual fiscal 2011, actual fiscal 2012, and estimated fiscal 2013. The text of the report focuses on actual fiscal 2012 data, with a secondary focus on estimated fiscal 2013.
Additional state expenditure details and trends, broken down by functional spending category include:
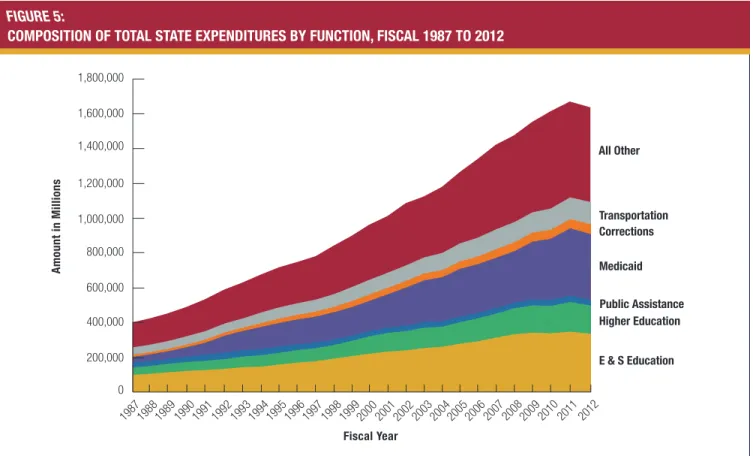
• Since the beginning of the recent economic downturn, Medicaid has risen as a percentage of total state spending going from 20.5 percent in fiscal 2008 to an estimated 24.4 percent in fiscal 2013. At the same time, elementary and secondary education has gone from representing 22.0 percent of total state spending in fiscal 2008 to an estimated 19.9 percent in fiscal 2013.
• When looking only at general fund spending, elementary and secondary education remains the largest category in
fiscal 2012, representing 34.9 percent of general fund expenditures, with Medicaid second at 19.3 percent. Those two categories, combined with higher education at 10.0 percent, account for nearly two-thirds of general fund spending. In fiscal 2013, elementary and secondary edu-cation is estimated to represent 35.2 percent of general fund expenditures, with Medicaid at 19.0 percent. • Elementary and secondary education total expenditures
declined by 3.4 percent in fiscal 2012 and increased by 4.2 percent in estimated fiscal 2013. While state funds increased by 2.2 percent in fiscal 2012, federal funds declined by 21.6 percent due to the reduction in ARRA spending.
• Total expenditures for higher education declined 3.6 per-cent in fiscal 2012 and are estimated to have increased by 2.5 percent in fiscal 2013. State funds for higher educa-tion decreased 2.3 percent in fiscal 2012 and are estimat-ed to have increasestimat-ed by 3.6 percent in fiscal 2013, while federal funds declined 10.2 percent in fiscal 2012 and declined by an estimated 2.0 percent in fiscal 2013. • Total public assistance decreased in both fiscal 2012 and
estimated fiscal 2013, by 10.9 percent and 2.0 percent respectively. The spending decline in fiscal 2012 is partly
1987 Amount in Millions 2007 2008 2006 2005 2004 2003 2002 2001 2000 1999 1998 1997 1996 1995 1994 1993 1992 1991 1990 1989 1988 Fiscal Year Bonds Other State Funds Federal Funds General Fund 0 200,000 400,000 600,000 800,000 1,000,000 1,200,000 1,400,000 1,600,000 2009 2010 2011 2012 1,800,000
Figure 1:
due to California shifting financial responsibility for certain public assistance programs from state funds to counties as part of realignment. Public assistance represented 1.5 percent of total state expenditures in fiscal 2012.
• In fiscal 2012, Medicaid total state expenditures declined due to a substantial decrease in federal funding that reflects the end of the enhanced Medicaid match rate from ARRA. While Medicaid spending from state funds increased 14.0 percent in fiscal 2012, federal funds declined 11.3 percent. In fiscal 2013 it is estimated that total Medicaid spending increased 7.6 percent, with state funds growing by 8.0 percent and federal funds rising by 7.2 percent. • Total corrections spending increased by 3.3 percent in
fiscal 2012 and is estimated to have declined slightly by 0.3 percent in fiscal 2013. As state funds comprise over 96 percent of total corrections expenditures, corrections was not as affected by the slowdown of federal Recovery Act spending in fiscal 2012. Corrections accounted for
3.2 percent of total state expenditures in fiscal 2012 and 6.9 percent of general funds.
• Total transportation spending, representing 7.8 percent of total state expenditures, increased by 3.7 percent in fiscal 2012 with state funds increasing by 4.5 percent and fed-eral funds growing by 3.7 percent. In fiscal 2013, total transportation spending is estimated to have grown by 6.0 percent with state funds increasing by 3.6 percent and federal funds increasing by 7.5 percent. The comparably large increase in fiscal 2013 is concentrated in a small number of states.
• Total state spending on capital projects increased by 2.4 percent in fiscal 2012 and by an estimated 5.5 percent in fiscal 2013. State spending on capital projects traditional-ly has come from non-general fund sources. Bonds (33.7 percent in fiscal 2012) and other state funds such as dedicated fees and fund surpluses (30.5 percent) com-bine to account for 64.2 percent of total state spending on capital projects.
• State revenue conditions have noticeably improved since the end of the national recession. States collected $670.5 billion in general fund revenues in fiscal 2008, but that figure fell to $603.3 billion in fiscal 2009 and declined even further in fiscal 2010 to $592.8 billion. Since 2010, state revenues have increased reaching $647.7 billion in fiscal 2011, $671.1 billion in fiscal 2012, and an estimated $707.5 billion in fiscal 2013. Personal income tax collec-tions experienced the largest gains in both fiscal 2012 and estimated fiscal 2013 compared to the other major sourc-es of state revenue.
Explanation of Report Data: Components of
State Expenditures
This report includes three years of state expenditure data: actual fiscal 2011, actual fiscal 2012, and estimated fiscal 2013. The text primarily focuses on actual fiscal 2012 with a secondary emphasis on estimated fiscal 2013 and examines the seven main functional categories of state spending: ele-mentary and secondary education, higher education, public assistance, Medicaid, corrections, transportation, and “all other.” (“All other” is a broad category that includes state func-tions not tracked individually in this report, such as hospitals, economic development, housing, environmental programs,
4.6 4.2 -3.6 -10.9 7.6 -0.3 6.0 3.8 -1.0 -1.7 -2.0 -3.4 2.5 3.3 3.7 -1.9 Total All Other Transportation Corrections Medicaid Public Assistance Higher Education E & S Education
Figure 2:
all FundS percenT changeS From previouS
FiScal year For major Spending caTegorieS,
FiScal 2012 and 2013
tion, and water transport). Capital spending is included with operating expenditures within each functional category, unless noted otherwise. Capital expenditures also have been collect-ed separately in the following categories: corrections, environ-mental projects, higher education, housing, transportation, and “all other”. It should also be noted that twenty-one states use a biennial budget cycle, and in many cases funds are not expended evenly in the two-year cycle. This may affect total expenditures in some states from year to year.
State governments have specific functional responsibilities that vary among states depending on the role of local governments in providing services. For example, in many states, the funding of elementary and secondary education is considered primarily a local function. Some states are exceptions, such as Hawaii where state government fully funds elementary and secondary education. A more complete understanding of programs and service levels within a given state would require comparisons of spending by both state and local government, which is not the purpose of this report. In addition, because the data are self-reported by the states, some may be incomplete. These omissions can affect aggregate and regional tables.
While state balanced budget requirements are diverse, and governors are given significant powers to ensure a balanced budget, states operate within stricter revenue/expenditure
lim-itations than the federal government. An overwhelming majori-ty of states require their governor to submit, and their legislature to pass, a balanced budget. States are required to make spending choices based on available resources and must either reduce spending, raise taxes, or use reserves when revenues come in below estimates. For the most part, states do not and cannot incur operating deficits, and manage their finances in ways to keep or improve positive bond ratings.
Explanation of Report Data: Definitions
General Fund: The predominant fund for financing a state’s
operations. Revenues are received from broad-based state taxes. However, there are differences in how specific functions are financed from state to state.
Federal Funds: Funds received directly from the federal
government.
Other State Funds: Expenditures from revenue sources that
are restricted by law for particular governmental functions or activities. For example, a gasoline tax dedicated to a highway trust fund would appear in the “Other State Funds” column. For Medicaid, other state funds include provider taxes, fees, donations, assessments, and local funds.
Federal Funds 31.4% Other State Funds 25.9% Bonds 2.3% General Funds 40.4%
Figure 3:
ToTal STaTe expendiTureS by Funding Source,
FiScal 2012
Higher Education 10.5% Public Assistance 1.5% Elementary & Secondary Education 20.0% Medicaid 23.7% Corrections 3.2% Transportation 7.8% All Other 33.3%Figure 4:
ToTal STaTe expendiTureS by FuncTion,
FiScal 2012
Bonds: Expenditures from the sale of bonds, generally for capital projects.
State Funds: General funds plus other state fund spending,
excluding state spending from bonds.
Fiscal 2012 spending by fund source is detailed in Figure 3. General funds had decreased as an overall percentage of state expenditures since fiscal 2008, going from 45.9 percent of total expenditures in fiscal 2008 to 38.3 percent in fiscal 2011. At the same time, the share of state spending from federal funds grew from 26.3 percent in fiscal 2008 to 34.0 percent in fiscal 2011. The trend began to reverse in fiscal 2012 due to the decline of ARRA funds. In fiscal 2012 general funds comprised 40.4 percent of total expenditures while federal funds com-prised 31.4 percent.
Figure 4 reflects total state expenditures by functional areas. For fiscal 2012, total state spending shares are as follows: 23.7 percent for Medicaid; 20.0 percent for elementary and second-ary education; 10.5 percent for higher education; 7.8 percent for transportation; 3.2 percent for corrections; 1.5 percent for public assistance; and 33.3 percent for all other.
The shares of state spending for the seven functional areas tracked in the State Expenditure Report have shifted since
1987, when the report was first published. For example, in total state spending, Medicaid surpassed higher education as the second largest state program in 1990, and in 2003 it became the largest, displacing elementary and secondary education. Since 2003, Medicaid and elementary and secondary educa-tion have alternated as the largest share of total state spend-ing. Whereas in fiscal 2008 elementary and secondary education was the largest component, in fiscal 2009 Medicaid represented the largest share, due to increased Medicaid enrollment and spending resulting from the economic decline. In fiscal 2013 Medicaid continued to grow as a percentage of total state expenditures, representing 24.4 percent, while ele-mentary and secondary education declined to 19.9 percent. Figure 5 documents the changes in state expenditures by category since 1987. Table 3 reflects shares of state spending in functional areas, by fund source, from 1995 to 2013. Also, Table 5, at the end of the Executive Summary, highlights the share of each state’s budget represented by various programs in fiscal 2012 and shows the wide variation among states in their spending patterns.
General Fund Expenditures
Expenditures for elementary and secondary education continue to constitute the largest share of state general fund spending.
Amount in Millions All Other Transportation Medicaid Public Assistance Corrections E & S Education Higher Education 0 200,000 400,000 600,000 800,000 1,000,000 1,200,000 1,400,000 1,600,000 1,800,000
Figure 5:
As Figure 6 shows, in fiscal 2012, 34.9 percent of general fund spending went to elementary and secondary education. Medic-aid accounted for 19.3 percent and higher education account-ed for 10.0 percent of general fund spending.
Figure 7 reflects the percentage change for general fund spend-ing in each of the functional categories. The general fund spending patterns for fiscal 2012 vary with four categories experiencing growth and three categories experiencing declines. In fiscal 2013, all categories of general fund spending are estimated to have increased. Overall, general fund spending increased 3.7 percent in fiscal 2012 and is estimated to have increased 4.4 percent in fiscal 2013.
Other State Funds Expenditures
Trailing only the “all other” category, higher education and transportation account for the next largest portions of other state funds spending for fiscal 2012, at 18.6 percent and 16.4 percent respectively. Other state funds are expenditures from revenue sources which are restricted by law for particular gov-ernmental functions or activities. For transportation, these funds largely represent receipts from gasoline taxes earmarked for highways and other infrastructure projects (see Table 3).
Higher Education 10.0% Public Assistance 1.5% Elementary & Secondary Education 34.9% Medicaid 19.3% Corrections 6.9% Transportation 0.5% All Other 26.8%
Figure 6:
general Fund expendiTureS, FiScal 2012
2012-2013 2011-2012 All Other Transportation Corrections Medicaid Public Assistance Higher Education E & S Education -18 -16 -14 -12 -10 -8 -6 -4 -2 0 2 4 6 8 10 12 14 16 18 20 22 24 26 -8.4 -15.4 2.8 2.3 14.5 2.1 5.7 14.2 1.7 4.2 2.8 5.2 21.3 -2.0
Figure 7:
NEW ENGLAND Connecticut $17,845 $2,701 $3,224 $2,404 $26,174 $18,782 $2,631 $3,489 $2,656 $27,558 $19,030 $2,555 $3,618 $2,935 $28,138 Maine 2,859 3,000 2,293 122 8,274 3,087 2,649 2,309 61 8,106 3,042 2,564 2,176 16 7,798 Massachusetts 21,997 13,088 18,570 1,919 55,574 24,011 16,157 16,935 2,168 59,271 25,509 15,548 17,135 2,106 60,298 New Hampshire 1,326 1,929 1,940 145 5,340 1,280 1,650 1,965 80 4,975 1,262 1,601 2,080 81 5,024 Rhode Island 2,956 2,749 2,015 244 7,964 3,110 2,599 2,000 198 7,907 3,268 2,659 2,122 84 8,133 Vermont 744 1,966 2,072 78 4,860 889 1,831 2,241 56 5,017 977 1,662 2,248 73 4,960 MID-ATLANTIC Delaware 3,271 1,849 3,089 203 8,412 3,592 1,777 3,388 185 8,942 3,659 1,783 3,281 439 9,162 Maryland 13,281 9,951 9,452 1,156 33,840 14,951 9,058 9,906 962 34,877 15,119 11,811 8,909 1,135 36,974 New Jersey 27,932 12,044 5,550 1,616 47,142 30,282 10,998 5,911 1,421 48,612 31,618 12,485 6,735 1,247 52,085 New York 53,313 44,707 31,163 3,582 132,765 56,489 40,311 32,843 3,861 133,504 58,960 38,574 32,305 3,258 133,097 Pennsylvania 25,074 29,511 13,694 868 69,147 27,031 24,177 14,361 1,379 66,948 27,761 24,144 15,175 800 67,880 GREAT LAKES Illinois 25,237 14,821 14,375 1,957 56,390 29,257 19,407 14,944 2,122 65,730 29,260 15,407 19,825 1,955 66,447 Indiana 13,037 9,952 3,348 100 26,437 13,579 9,272 3,454 0 26,305 14,189 10,357 3,220 0 27,766 Michigan 8,360 19,919 20,035 283 48,597 8,619 17,549 20,844 274 47,286 9,164 19,295 20,107 182 48,748 Ohio 31,653 14,553 12,010 2,099 60,315 31,040 13,135 12,293 1,453 57,921 31,514 12,630 12,950 1,174 58,268 Wisconsin 13,565 12,236 17,043 0 42,844 13,381 10,572 17,371 0 41,324 14,042 10,815 17,912 0 42,769 PLAINS Iowa 5,354 6,147 6,258 229 17,988 6,010 6,551 6,072 307 18,940 6,231 5,682 7,539 157 19,609 Kansas 5,667 4,472 4,172 374 14,685 6,098 4,153 3,737 408 14,396 6,198 3,599 4,193 415 14,405 Minnesota 16,332 9,200 5,022 847 31,401 17,741 8,170 4,809 609 31,329 20,056 8,637 6,263 810 35,766 Missouri 7,630 7,805 7,220 447 23,102 7,938 7,539 7,887 0 23,364 8,022 7,209 7,712 0 22,943 Nebraska 3,324 3,222 3,261 0 9,807 3,446 2,988 3,443 0 9,877 3,590 3,014 3,559 0 10,163 North Dakota 1,615 1,813 1,568 21 5,017 2,222 1,884 1,910 11 6,027 2,220 1,621 2,072 26 5,939 South Dakota 1,167 1,679 957 67 3,870 1,215 1,488 960 35 3,698 1,302 1,487 1,307 35 4,131 SOUTHEAST Alabama 6,842 10,252 6,753 292 24,139 7,274 9,308 7,270 326 24,178 6,897 9,541 7,490 189 24,117 Arkansas 4,453 6,819 8,932 143 20,347 4,582 6,278 9,693 135 20,688 4,746 6,189 10,447 203 21,585 Florida 23,777 29,403 9,481 2,800 65,461 23,053 24,615 12,928 2,393 62,989 24,717 24,737 18,437 2,084 69,975 Georgia 16,476 13,273 10,218 858 40,825 17,240 12,469 10,786 632 41,127 18,303 11,752 10,211 808 41,074 Kentucky 8,691 9,763 6,978 0 25,432 9,334 8,687 7,628 0 25,649 9,426 8,001 8,246 0 25,673 Louisiana 7,786 10,969 11,854 591 31,200 8,344 10,616 7,793 320 27,073 8,156 12,311 8,791 404 29,662 Mississippi 4,367 8,401 5,325 267 18,360 4,495 7,945 5,593 353 18,386 4,699 8,274 5,660 784 19,417 North Carolina 18,503 17,711 14,220 473 50,907 20,195 14,513 11,207 652 46,567 20,602 17,459 12,543 785 51,389 South Carolina 5,275 9,821 6,988 104 22,188 5,517 9,284 7,164 123 22,088 6,350 7,792 8,158 0 22,300 Tennessee 10,561 13,578 5,970 119 30,228 11,685 12,806 5,674 254 30,419 12,622 13,055 5,394 382 31,453 Virginia 16,435 9,832 14,839 1,364 42,470 16,986 9,212 15,943 1,284 43,425 17,691 9,546 16,191 1,167 44,595 West Virginia 3,770 4,460 12,906 62 21,198 4,144 4,064 13,540 73 21,821 4,159 4,394 14,736 74 23,363 SOUTHWEST Arizona 8,306 14,971 6,715 741 30,733 8,414 12,299 7,064 763 28,540 8,567 12,332 7,624 770 29,293 New Mexico 5,231 6,110 3,006 0 14,347 5,432 5,608 3,124 0 14,164 5,656 5,660 3,227 0 14,543 Oklahoma 6,152 7,592 7,184 237 21,165 6,493 6,718 7,574 146 20,931 6,892 6,516 7,878 144 21,430 Texas 42,684 35,606 14,322 1,507 94,119 43,874 31,536 15,892 1,661 92,963 43,521 33,147 18,318 1,939 96,925 ROCKY MOUNTAIN Colorado 7,278 8,893 14,746 0 30,917 7,311 7,691 13,775 0 28,777 7,942 7,334 13,203 0 28,479 Idaho 2,451 2,670 1,450 32 6,603 2,505 2,382 1,348 32 6,267 2,699 2,792 1,718 33 7,242 Montana 1,701 2,380 2,083 0 6,164 1,764 2,131 2,024 0 5,919 1,947 2,115 1,978 0 6,040 Utah 4,628 3,579 4,115 366 12,688 4,742 3,588 3,039 453 11,822 4,990 3,405 3,739 469 12,603 Wyoming 2,726 1,547 1,760 0 6,033 2,714 1,547 1,765 0 6,026 3,709 2,353 2,549 0 8,611 FAR WEST Alaska 8,948 3,173 1,643 228 13,992 7,400 3,017 1,322 50 11,789 7,301 2,902 1,389 550 12,142 California 91,549 84,764 33,432 6,000 215,745 86,404 73,063 33,853 6,104 199,424 95,665 81,299 38,656 12,261 227,881 Hawaii 4,969 2,554 3,116 582 11,221 5,511 1,932 3,285 766 11,494 5,666 1,912 3,271 735 11,584
Table 1
ToTal STaTe expendiTureS—capiTal incluSive ($ in millionS)
Actual Fiscal 2011 Actual Fiscal 2012 Estimated Fiscal 2013
Region/State GeneralFund FederalFunds Other State
Funds Bonds Total GeneralFund FederalFunds Other State
Funds Bonds Total GeneralFund FederalFunds Other State
Table 2
annual percenTage change in ToTal STaTe expendiTureS
Fiscal 2011 to 2012 Fiscal 2012 to 2013 Region/State General Funds State Funds Federal Funds All Funds General Funds State Funds Federal Funds All Funds NEW ENGLAND Connecticut 5.3 % 5.7 % -2.6 % 5.3 % 1.3 % 1.7 % -2.9 % 2.1 % Maine 8.0 4.7 -11.7 -2.0 -1.5 -3.3 -3.2 -3.8 Massachusetts 9.2 0.9 23.4 6.7 6.2 4.1 -3.8 1.7 New Hampshire -3.5 -0.6 -14.5 -6.8 -1.4 3.0 -3.0 1.0 Rhode Island 5.2 2.8 -5.5 -0.7 5.1 5.5 2.3 2.9 Vermont 19.5 11.2 -6.9 3.2 9.9 3.0 -9.2 -1.1 MID-ATLANTIC Delaware 9.8 9.7 -3.9 6.3 1.9 -0.6 0.3 2.5 Maryland 12.6 9.3 -9.0 3.1 1.1 -3.3 30.4 6.0 New Jersey 8.4 8.1 -8.7 3.1 4.4 6.0 13.5 7.1 New York 6.0 5.7 -9.8 0.6 4.4 2.2 -4.3 -0.3 Pennsylvania 7.8 6.8 -18.1 -3.2 2.7 3.7 -0.1 1.4 GREAT LAKES Illinois 15.9 11.6 30.9 16.6 0.0 11.0 -20.6 1.1 Indiana 4.2 4.0 -6.8 -0.5 4.5 2.2 11.7 5.6 Michigan 3.1 3.8 -11.9 -2.7 6.3 -0.7 9.9 3.1 Ohio -1.9 -0.8 -9.7 -4.0 1.5 2.6 -3.8 0.6 Wisconsin -1.4 0.5 -13.6 -3.5 4.9 3.9 2.3 3.5 PLAINS Iowa 12.3 4.0 6.6 5.3 3.7 14.0 -13.3 3.5 Kansas 7.6 0.0 -7.1 -2.0 1.6 5.7 -13.3 0.1 Minnesota 8.6 5.6 -11.2 -0.2 13.0 16.7 5.7 14.2 Missouri 4.0 6.6 -3.4 1.1 1.1 -0.6 -4.4 -1.8 Nebraska 3.7 4.6 -7.3 0.7 4.2 3.8 0.9 2.9 North Dakota 37.6 29.8 3.9 20.1 -0.1 3.9 -14.0 -1.5 South Dakota 4.1 2.4 -11.4 -4.4 7.2 20.0 -0.1 11.7 SOUTHEAST Alabama 6.3 7.0 -9.2 0.2 -5.2 -1.1 2.5 -0.3 Arkansas 2.9 6.6 -7.9 1.7 3.6 6.4 -1.4 4.3 Florida -3.0 8.2 -16.3 -3.8 7.2 19.9 0.5 11.1 Georgia 4.6 5.0 -6.1 0.7 6.2 1.7 -5.8 -0.1 Kentucky 7.4 8.3 -11.0 0.9 1.0 4.2 -7.9 0.1 Louisiana 7.2 -17.8 -3.2 -13.2 -2.3 5.0 16.0 9.6 Mississippi 2.9 4.1 -5.4 0.1 4.5 2.7 4.1 5.6 North Carolina 9.1 -4.0 -18.1 -8.5 2.0 5.6 20.3 10.4 South Carolina 4.6 3.4 -5.5 -0.5 15.1 14.4 -16.1 1.0 Tennessee 10.6 5.0 -5.7 0.6 8.0 3.8 1.9 3.4 Virginia 3.4 5.3 -6.3 2.2 4.2 2.9 3.6 2.7 West Virginia 9.9 6.0 -8.9 2.9 0.4 6.8 8.1 7.1 SOUTHWEST Arizona 1.3 3.0 -17.8 -7.1 1.8 4.6 0.3 2.6 New Mexico 3.8 3.9 -8.2 -1.3 4.1 3.8 0.9 2.7 Oklahoma 5.5 5.5 -11.5 -1.1 6.1 5.0 -3.0 2.4 Texas 2.8 4.8 -11.4 -1.2 -0.8 3.5 5.1 4.3 ROCKY MOUNTAIN Colorado 0.5 -4.3 -13.5 -6.9 8.6 0.3 -4.6 -1.0 Idaho 2.2 -1.2 -10.8 -5.1 7.7 14.6 17.2 15.6 Montana 3.7 0.1 -10.5 -4.0 10.4 3.6 -0.8 2.0 Utah 2.5 -11.0 0.3 -6.8 5.2 12.2 -5.1 6.6 Wyoming -0.4 -0.2 0.0 -0.1 36.7 39.7 52.1 42.9 FAR WEST Alaska -17.3 -17.6 -4.9 -15.7 -1.3 -0.4 -3.8 3.0 California -5.6 -3.8 -13.8 -7.6 10.7 11.7 11.3 14.3 Hawaii 10.9 8.8 -24.4 2.4 2.8 1.6 -1.0 0.8 Nevada -3.6 -13.2 -3.3 -10.6 3.8 18.0 14.3 16.7 Oregon 22.2 -22.0 -10.1 -19.3 -13.9 -3.8 -3.9 -4.5 Washington 3.1 10.5 -10.5 3.9 2.3 -6.2 -3.8 -5.0 TOTAL 3.7 % 2.3 % -9.1 % -1.7 % 4.4 % 5.3 % 2.3 % 4.6 %
Table 3
compariSon oF ShareS oF STaTe Spending wiTh Fund SourceS, FiScal 1995 To 2013
Fund Type & Year Secondary EducationElementary & EducationHigher AssistancePublic Medicaid Corrections Transportation All Other Total FY 1995:
General Funds 33.4 12.9 4.4 14.4 6.7 0.7 27.4 100.0
Other State Funds 9.5 13.3 0.5 6.9 0.8 23.8 45.2 100.0
Federal Funds 9.8 2.7 6.5 42.7 0.1 9.8 28.3 100.0
Bond Funds 4.9 20.8 0.0 0.0 10.2 26.3 37.7 100.0
Total Funds 21.0 10.4 4.0 19.8 3.6 9.1 32.1 100.0
FY 1996:
General Funds 34.4 12.9 3.9 14.7 6.9 0.6 25.6 100.0
Other State Funds 9.2 13.7 0.4 6.8 0.8 22.9 46.2 100.0
Federal Funds 9.9 2.9 5.9 43.5 0.2 9.5 28.0 100.0
Bond Funds 15.2 21.4 0.0 0.0 6.5 26.1 30.8 100.0
Total Funds 21.5 10.7 3.5 19.9 3.7 8.0 31.8 100.0
FY 1997:
General Funds 34.5 13.0 3.6 14.6 6.8 0.8 26.7 100.0
Other State Funds 10.1 13.8 0.4 6.4 0.9 23.0 44.6 100.0
Federal Funds 9.8 2.9 5.1 44.1 0.4 8.8 28.9 100.0
Bond Funds 12.5 20.2 0.0 0.0 6.6 26.5 34.2 100.0
Total Funds 21.7 10.7 3.1 20.0 3.7 9.0 31.8 100.0
FY 1998:
General Funds 35.2 13.1 3.0 14.8 6.9 0.7 26.4 100.0
Other State Funds 9.4 11.3 1.0 6.3 0.8 22.2 49.1 100.0
Federal Funds 10.5 3.4 5.0 43.3 0.4 8.7 28.8 100.0
Bond Funds 12.4 18.4 0.0 0.0 6.0 33.4 29.8 100.0
Total Funds 22.0 10.3 2.9 19.6 3.7 8.8 32.8 100.0
FY 1999:
General Funds 35.7 12.4 2.7 14.4 7.0 0.9 26.7 100.0
Other State Funds 9.0 13.0 0.6 6.5 1.0 23.4 46.5 100.0
Federal Funds 10.2 5.2 4.3 42.9 0.4 9.3 27.7 100.0
Bond Funds 21.0 17.2 0.0 0.0 6.5 25.6 29.8 100.0
Total Funds 22.3 10.8 2.6 19.5 3.9 9.1 31.8 100.0
FY 2000:
General Funds 35.7 12.8 2.7 14.4 7.0 0.9 26.7 100.0
Other State Funds 8.6 14.2 0.8 4.2 0.9 22.9 48.4 100.0
Federal Funds 10.3 5.3 4.2 42.8 0.4 9.3 27.7 100.0
Bond Funds 20.2 18.1 0.0 0.0 5.7 26.2 29.8 100.0
Total Funds 22.3 11.4 2.6 19.5 3.9 9.1 31.8 100.0
FY 2001:
General Funds 35.2 12.7 2.3 15.2 6.9 1.2 26.6 100.0
Other State Funds 9.2 15.0 0.2 5.9 0.9 21.1 47.0 100.0
Federal Funds 10.3 4.8 4.0 42.7 0.3 9.5 28.3 100.0
Bond Funds 18.9 17.5 0.0 0.0 4.0 31.3 28.4 100.0
Total Funds 22.2 11.3 2.2 19.7 3.7 8.8 32.1 100.0
FY 2002:
General Funds 35.1 12.4 2.3 15.8 6.9 0.7 25.9 100.0
Other State Funds 8.9 13.8 0.3 6.6 0.9 19.4 49.8 100.0
Federal Funds 10.1 5.0 4.2 43.7 0.4 9.2 27.4 100.0
Bond Funds 12.7 20.4 0.0 0.0 3.4 25.0 38.5 100.0
Total Funds 21.3 10.9 2.3 20.7 3.6 8.3 32.9 100.0
FY 2003:
General Funds 35.8 12.5 2.3 17.2 7.2 0.6 24.5 100.0
Other State Funds 9.2 14.3 0.3 7.5 0.9 20 47.9 100.0
Federal Funds 10.6 5.7 4.1 43.8 0.3 8.6 26.9 100.0
Bond Funds 28.3 16.9 0.0 0.0 2.5 19.1 33.1 100.0
Total Funds 21.8 11.1 2.2 22 3.5 8.2 31.2 100.0
FY 2004:
General Funds 35.8 11.7 2.3 16.9 7.0 0.5 25.8 100.0
Other State Funds 8.5 13.6 0.2 7.4 0.7 19.9 49.8 100.0
Federal Funds 11.3 4.7 3.6 44.6 0.7 8.4 26.9 100.0
Bond Funds 20.9 21.2 0.0 0.0 2.6 26.8 28.4 100.0
Total Funds 21.4 10.4 2.2 22.1 3.5 8.3 32.2 100.0
FY 2005:
General Funds 35.4 11.6 2.2 17.1 6.9 0.5 26.2 100.0
Other State Funds 8.5 14.1 0.1 8.3 0.7 19.5 48.9 100.0
Federal Funds 11.6 4.4 3.2 44.2 0.3 8.7 27.4 100.0
Bond Funds 17.0 25.3 0.0 0.0 2.8 25.5 29.4 100.0
Total Funds 21.4 10.4 1.8 22.3 3.3 8.2 32.4 100.0
FY 2006:
General Funds 34.4 11.3 2.1 17.4 6.7 0.8 27.2 100.0
Other State Funds 8.1 14.2 0.1 7.3 0.7 18.5 51.1 100.0
Federal Funds 12.1 4.6 3.0 42.9 0.2 8.7 28.5 100.0
Bond Funds 17.9 24.0 0.0 0.0 3.4 26.1 28.6 100.0
Total Funds 21.2 10.5 1.8 21.4 3.3 8.1 33.7 100.0
FY 2007:
General Funds 34.1 11.0 2.0 16.6 6.8 1.1 28.4 100.0
Other State Funds 9.4 14.5 0.1 7.3 0.7 17.7 50.3 100.0
Federal Funds 12.0 4.1 3.1 43.1 0.3 8.6 28.9 100.0
Bond Funds 12.4 18.1 0.0 0.0 3.2 32.4 33.8 100.0
Total Funds 21.5 10.2 1.7 20.9 3.4 8.1 34.2 100.0
FY 2008:
General Funds 35.0 11.7 1.9 16.0 7.0 0.8 27.6 100.0
Other State Funds 10.2 15.2 0.1 7.3 0.7 17.5 49.0 100.0
Federal Funds 11.7 3.7 3.1 43.0 0.2 8.6 29.7 100.0
Bond Funds 9.6 19.2 0.0 0.0 2.7 30.5 37.9 100.0
Total Funds 22.0 10.7 1.7 20.5 3.5 7.8 33.9 100.0
FY 2009:
General Funds 35.2 11.5 1.9 16.3 7.2 0.7 26.8 100.0
Other State Funds 10.1 15.2 0.1 6.8 0.6 16.4 50.8 100.0
Federal Funds 12.2 4.2 2.9 44.6 0.3 7.8 28.0 100.0
Bond Funds 15.0 20.9 0.0 0.0 3.0 30.0 31.0 100.0
Total Funds 21.5 10.5 1.7 21.9 3.4 7.5 33.4 100.0
FY 2010:
General Funds 35.5 11.5 1.9 14.8 7.4 0.7 28.1 100.0
Other State Funds 9.8 16.7 0.1 7.6 0.7 16.1 49.0 100.0
Federal Funds 12.2 3.6 2.7 42.2 0.4 7.1 31.7 100.0
Bond Funds 8.3 20.3 0.0 0.0 3.0 34.6 33.8 100.0
Total Funds 20.4 10.2 1.7 22.2 3.2 7.5 34.7 100.0
FY 2011:
General Funds 35.3 11.3 1.9 16.5 7.3 0.5 27.3 100.0
Other State Funds 8.7 18.0 0.1 9.8 0.6 15.8 47.1 100.0
Federal Funds 12.7 4.0 2.7 44.2 0.3 7.2 29.0 100.0
Bond Funds 12.3 16.8 0.0 0.0 1.6 33.9 35.4 100.0
Total Funds 20.3 10.7 1.6 23.8 3.1 7.4 33.1 100.0
FY 2012:
General Funds 34.9 10.0 1.5 19.3 6.9 0.5 26.8 100.0
Other State Funds 8.5 18.6 0.1 9.3 1.3 16.4 45.8 100.0
Federal Funds 11.0 4.0 2.7 43.1 0.2 8.2 30.9 100.0
Bond Funds 8.0 15.2 0.0 0.0 2.1 34.8 39.8 100.0
Total Funds 20.0 10.5 1.5 23.7 3.2 7.8 33.3 100.0
FY 2013:
Federal Fund Expenditures
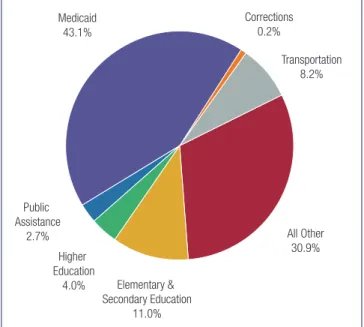
As reflected in Figure 8, Medicaid accounts for the largest por-tion of state spending from federal funds in fiscal 2012 at 43.1 percent. Elementary and secondary education at 11.0 percent and transportation at 8.2 percent are the next largest categories.
Regional Spending Trends
Table 4 shows growth rates for each region of the United States, separated by state funds (general fund plus other state funds, not including bond funds) and federal funds. The growth rate for all states decreased 1.7 percent in fiscal 2012, with four regions recording growth and four recording declines. In fiscal 2013, total estimated state spending increased 4.6 per-cent, with all eight regions recording spending growth.
Figure 9 shows the percentage change in state spending from state funds for 2011-2012 and 2012-2013. In fiscal 2012, all but the Rocky Mountain and Far West regions saw increases in spending from state funds while in fiscal 2013 it is estimated that all regions saw increases in spending from state funds. Total state expenditure data can be found on Tables 1-5, along with related footnotes at the end of this chapter.
-4.9 3.0 7.0 5.7 2.8 6.7 6.9 -4.5 8.5 3.9 2.9 2.4 9.2 4.6 3.9 4.5 Far West Rocky Mountain Southwest Southeast Plains Great Lakes Mid-Atlantic New England 2012-2013 Increases 2011-2012 Increases -6 -4 -2 0 2 4 6 8 10
Figure 9:
regional percenT change in STaTe FundS,
FiScal 2012 and 2013
Higher Education 4.0% Public Assistance 2.7% Elementary & Secondary Education 11.0% Medicaid 43.1% Corrections 0.2% Transportation 8.2% All Other 30.9%Figure 8:
Federal Fund expendiTureS, FiScal 2012
Table 4
regional percenTage change in ToTal expendiTureS, FiScal 2012 and 2013
Fiscal 2011 to 2012 Fiscal 2012 to 2013 Region State Funds Federal Funds All Funds State Funds Federal Funds All Funds New England 2.9 % 8.2 % 4.3 % 3.0 % -3.4 % 1.3 % Mid-Atlantic 7.0 -12.0 0.5 2.4 2.9 2.2 Great Lakes 3.9 -2.2 1.7 4.5 -2.0 2.3 Plains 5.7 -4.6 1.7 9.2 -4.7 4.9 Southeast 2.8 -10.0 -2.1 6.7 2.5 5.3 Southwest 4.6 -12.6 -2.3 3.9 2.7 3.6 Rocky Mountain -4.5 -9.1 -5.8 8.5 3.8 7.1 Far West -4.9 -13.0 -7.7 6.9 8.2 9.3 ALL STATES 2.3 % -9.1 % -1.7 % 5.3 % 2.3 % 4.6 %
Table 5
STaTe Spending by FuncTion aS a percenT oF ToTal STaTe expendiTureS, FiScal 2012
Region/State Elementary & Secondary Education Higher Education Public
Assistance Medicaid Corrections Transportation
All Other Total NEW ENGLAND Connecticut 13.9 % 10.3 % 1.4 % 21.4 % 2.5 % 10.0 % 40.6 % 100.0 % Maine 13.1 3.4 2.6 28.8 1.7 8.6 41.8 100.0 Massachusetts 10.7 9.3 2.5 20.7 2.1 6.2 48.6 100.0 New Hampshire 23.5 2.7 1.9 23.9 2.1 10.1 35.9 100.0 Rhode Island 14.2 13.2 1.4 25.0 2.4 6.5 37.4 100.0 Vermont 31.1 1.8 2.1 25.3 2.8 12.8 24.2 100.0 MID-ATLANTIC Delaware 24.6 4.5 0.3 15.9 3.0 8.9 42.9 100.0 Maryland 19.5 14.5 3.7 21.5 4.3 9.9 26.5 100.0 New Jersey 24.7 7.8 0.9 21.6 3.2 9.3 32.4 100.0 New York 19.8 7.6 2.8 29.4 2.3 6.2 31.8 100.0 Pennsylvania 18.4 2.8 1.9 33.2 3.5 9.3 30.8 100.0 GREAT LAKES Illinois 15.8 5.5 0.1 19.7 2.2 8.5 48.1 100.0 Indiana 32.9 6.5 1.5 27.3 2.9 9.3 19.7 100.0 Michigan 27.2 4.1 0.9 26.1 4.7 6.9 30.2 100.0 Ohio 20.6 4.2 1.5 24.4 3.1 5.1 41.2 100.0 Wisconsin 16.7 14.1 0.4 16.5 2.9 6.9 42.5 100.0 PLAINS Iowa 16.8 25.0 0.6 19.6 2.7 7.5 27.8 100.0 Kansas 25.8 16.9 0.3 18.6 2.5 8.8 27.1 100.0 Minnesota 23.8 9.7 1.4 27.6 1.5 8.3 27.7 100.0 Missouri 22.6 4.7 0.7 35.0 2.6 10.4 23.9 100.0 Nebraska 15.3 23.5 0.5 16.7 2.3 7.5 34.3 100.0 North Dakota 13.8 17.7 0.1 12.1 1.9 16.4 38.0 100.0 South Dakota 14.3 17.7 0.8 20.9 2.7 15.9 27.7 100.0 SOUTHEAST Alabama 20.9 20.1 0.2 23.3 2.5 6.1 27.0 100.0 Arkansas 16.3 16.2 2.1 21.4 2.2 5.8 36.0 100.0 Florida 18.8 7.1 0.3 30.6 4.2 11.0 28.1 100.0 Georgia 24.0 18.7 0.1 21.5 3.7 5.2 26.8 100.0 Kentucky 19.8 25.7 0.9 22.5 2.4 8.9 19.8 100.0 Louisiana 18.4 9.9 0.6 26.7 2.9 7.1 34.4 100.0 Mississippi 16.9 16.8 5.8 23.4 1.8 7.5 27.7 100.0 North Carolina 23.2 9.0 0.5 24.7 4.2 9.9 28.4 100.0 South Carolina 15.9 21.0 0.4 21.7 2.7 6.6 31.7 100.0 Tennessee 17.7 12.8 0.4 30.7 2.7 6.4 29.3 100.0 Virginia 16.0 13.1 0.4 16.2 2.9 11.3 40.1 100.0 West Virginia 10.8 14.1 0.7 12.7 1.0 5.8 54.9 100.0 SOUTHWEST Arizona 19.0 13.5 1.0 32.0 3.6 6.4 24.6 100.0 New Mexico 19.7 19.3 0.5 24.7 2.0 5.9 27.9 100.0 Oklahoma 16.5 23.1 1.0 23.9 2.5 7.2 25.8 100.0 Texas 28.7 15.8 0.1 30.1 3.5 8.1 13.8 100.0 ROCKY MOUNTAIN Colorado 25.3 9.0 0.0 20.7 2.7 5.4 36.9 100.0 Idaho 25.7 8.1 0.3 27.2 3.7 10.9 24.2 100.0 Montana 15.5 9.8 0.5 16.8 3.1 12.7 41.5 100.0 Utah 24.7 11.9 0.9 17.5 2.0 9.2 33.9 100.0 Wyoming 3.9 5.5 0.0 9.5 4.6 9.5 66.9 100.0 FAR WEST Alaska 13.4 9.3 1.1 11.6 3.0 16.8 44.8 100.0 California 19.9 7.0 3.8 21.6 5.4 6.3 36.0 100.0 Hawaii 15.6 11.3 0.9 12.3 2.0 10.0 48.0 100.0 Nevada 23.6 9.7 3.2 25.4 3.8 9.5 24.9 100.0
General Notes
In reviewing the tables, please note the following:
• Small dollar amounts, when rounded, cause an aberra-tion in the percentage increase. In these instances, the actual dollar amounts should be consulted to determine the exact percentage increase.
• “State funds” refers to general funds plus other state fund spending. State spending from bonds is excluded. • “Total funds” refers to funding from all sources—general
fund, federal funds, other state funds, and bonds. • The report methodology is detailed in the Appendix.
All States: Medicaid reflects provider taxes, fees,
assess-ments, donations, and local funds in Other State Funds.
Alabama: Amounts shown in fiscal years 2011 and 2012 are
based on actual expenditures during these years, regardless of the year appropriated. Fiscal 2013 amounts shown are equal to actual expenditures through 9 months and then annualized for the year.
Delaware: Figures for fiscal 2013 are actual, not estimated.
Indiana: Total state expenditures for 2013 does not include
one-time transfers for the Automatic Taxpayer Refund ($360.6M), statutory distributions of “excess” reserves to vari-ous pension funds ($360.6M), bond defeasance ($203.9M), and paying back loans to the common school fund for charter schools ($91.2M).
Maryland: In fiscal 2013, special “Budget Restoration Funds”
are included in the table as general funds across all agencies. These funds were used to restore appropriations during the May 2012 Legislative Special Session, but related revenues are normally categorized as general funds and the expenditures are normally funded by general funds. Including them as gen-eral funds enables a more fair year to year comparison.
South Carolina: Unless noted, FY12-13 numbers reflects
actuals from statewide accounting system (SCEIS) as of the week of July 19, 2013. Agencies are still actively processing financial documents and numbers are subject to change until the “closing” of the FY12-13 books. FY12-13 “Bond Fund” numbers not available at this time
Tennessee: Tennessee collects personal income tax on
income from dividends on stocks and interest on certain bonds. Tax revenue estimates do not include federal funds and other departmental revenues. However, federal funds and other departmental revenues are included in the budget as funding sources for the general fund, along with state tax revenues.
Texas: Data are compiled from multiple sources, such as
agen-cy annual financial reports, Texas Comptroller publications, the General Appropriations Act, and Legislative Budget Board online resources. Methodologies employed by these sources may differ somewhat between each other and across time.
Vermont: In fiscal 2011, the General Fund had $744 million in
expenditures and $400 million in fund transfers out of the General Fund to other state funds where the expenditures were recorded. Total expenditures and transfers out for the General Fund were $1,144 million. $235 million of the trans-fers out of the general fund were related to Elementary and Secondary Education. In fiscal 2012, the General Fund had $889 million in expenditures and $388 million in fund transfers out of the General Fund to other state funds where the expen-ditures were recorded. Total expenexpen-ditures and transfers out for the General Fund were $1,277 million. $276 million of the transfers out of the general fund were related to Elementary and Secondary Education. In estimated fiscal 2013, the Gen-eral Fund had $977 million in estimated expenditures and $386 million in estimated fund transfers out of the General Fund to other state funds where the expenditures were recorded. Total estimated expenditures and transfers out for the General Fund were $1,363 million. $282 million of the estimated transfers out of the general fund were related to Elementary and Secondary Education.
1
ELEMENTARY
& SECONDARY
EDUCATION
20% of State Expenditures
Elementary and Secondary Education
Expenditures
State elementary and secondary education expenditures totaled $328.2 billion in fiscal 2012, a 3.4 percent decline over the previous year. While state funding to K-12 education increased modestly, there was a sharp decline in federal fund-ing. State funds (general funds and other state funds com-bined) increased by 2.2 percent, while federal funds declined by 21.6 percent. The decrease in federal funds was a result of a decline in education funds under the American Recovery and Reinvestment Act of 2009 (ARRA). In fiscal 2012, states received $5.9 billion in ARRA funds for elementary and secondary edu-cation, compared to $21.2 billion in fiscal 2011. General funds comprised 70.8 percent of state elementary and secondary education spending, federal funds comprised 17.2 percent, other states funds comprised 11.1 percent, and bonds com-prised 0.9 percent (see Figure 10) in fiscal 2012.
In fiscal 2013, it is estimated that overall elementary and sec-ondary expenditures grew by 4.2 percent, with state funds increasing by 5.1 percent and federal funds declining by 3.1 percent. States have begun to restore some prior cuts to K-12 education as the economy has slowly improved and state rev-enues have begun to increase. During the midst of the nation-al recession, state funds for elementary and secondary education declined by 1.3 percent in fiscal 2009 and 5.2 per-cent in fiscal 2010.
While elementary and secondary education has historically been the largest category of total state spending, it was sur-passed by Medicaid in fiscal 2009. In fiscal 2012, Medicaid comprised 23.7 percent of total state spending and K-12 rep-resented 20.0 percent. Elementary and secondary education remains by far the largest component of general fund spending in fiscal 2012 at 34.9 percent, compared to 19.3 percent for Medicaid.
Sources of Funding
State funding systems for education vary greatly. Over the years, a number of states have moved toward increasing their share of funding for elementary and secondary education by substituting state funds for local funds, often in order to reduce local governments’ reliance on property taxes. Funds are dis-tributed to schools both through general funds on a per-pupil basis and as categorical grants to support specific programs or needs. The federal share is typically a source of supplemen-tal funding for poor school districts and also helps cover the cost of educating children with special needs. However, feder-al funds through ARRA have mostly been used to maintain basic educational services. Overall, according to the U.S. Cen-sus Bureau’s report on public education finances, 44.4% of elementary and secondary education revenue came from states, 43.3% from localities, and 12.3% from the federal gov-ernment in fiscal 2011. General Funds 70.8% Bonds 0.9% Other State Funds 11.1% Federal Funds 17.2%
Figure 10
STaTe expendiTureS For elemenTary and
Secondary educaTion by Fund Source,
FiScal 2012
Regional Expenditures
The following table shows percentage changes in expenditures for elementary and secondary education for fiscal 2011-2012 and 2012-2013 by region. In fiscal 2012, all regions except New England saw a decline in total state spending for K-12 education.
ESEA Reauthorization & Flexibility Requests
The Elementary and Secondary Education Act (ESEA), and its current reauthorization known as “No Child Left Behind” (NCLB), continues to await a new reauthorization by Congress. No Child Left Behind created a series of new accountability standards as well as made funding changes. In fall 2011, the U.S. Department of Education announced that it would grant states flexibility from certain NCLB provisions in exchange for implementing various reforms to increase accountability. As of October 2013, 42 states plus Puerto Rico and the District of Columbia had been approved for NCLB waivers, and three states had outstanding requests pending approval.
Elementary and Secondary Education—
Expenditure Exclusions
When comparing resources spent on elementary and second-ary education, it is important to understand the types of pro-grams states exclude from these figures. For this report, 13 states wholly or partially excluded employer contributions to teacher pensions and 16 states wholly or partially excluded contributions to health benefits. Additionally, other items that are wholly or partially excluded include: day care programs (40 states), school health care (39), Head Start (31), and libraries (28). Summary expenditure data can be found in Tables 7 through 9, accompanied by explanatory notes. Table 10 lists programs excluded from the expenditure data.
Table 6
regional percenTage change in STaTe elemenTary and Secondary educaTion
expendiTureS, FiScal 2012 and 2013
Fiscal 2011 to 2012 Fiscal 2012 to 2013 Region State Funds Federal Funds All Funds State Funds Federal Funds All Funds New England 3.0 % -8.1 % 1.4 % 4.4 % -2.9 % 3.6 % Mid-Atlantic 3.7 -28.2 -3.1 4.2 -15.0 1.1 Great Lakes -2.9 -10.6 -5.2 1.1 -12.2 -1.9 Plains 6.0 -25.0 -0.4 13.3 -4.0 10.6 Southeast 3.3 -20.4 -2.3 3.4 6.2 3.8 Southwest 1.9 -29.0 -5.9 -0.9 -0.7 -0.9 Rocky Mountain 1.7 -19.8 -1.7 7.9 -9.1 5.7 Far West 2.5 -21.7 -4.5 11.9 4.7 14.1 ALL STATES 2.2 % -21.6 % -3.4 % 5.1 % -3.1 % 4.2 %
NEW ENGLAND Connecticut $2,708 $567 $6 $391 $3,672 $2,769 $556 $3 $506 $3,834 $2,880 $484 $3 $563 $3,930 Maine* 1,075 57 0 0 1,132 1,046 16 0 0 1,062 1,087 202 8 0 1,297 Massachusetts 4,271 1,264 659 0 6,194 4,490 1,173 674 0 6,337 4,715 1,000 687 0 6,402 New Hampshire 0 201 934 57 1,192 0 208 956 7 1,171 0 198 959 14 1,171 Rhode Island 846 260 23 4 1,133 861 235 27 0 1,123 930 238 40 1 1,209 Vermont 56 182 1,306 7 1,551 61 137 1,353 8 1,559 73 136 1,397 7 1,613 MID-ATLANTIC Delaware 1,092 243 575 150 2,060 1,156 244 659 138 2,197 1,194 211 681 141 2,227 Maryland* 4,982 1,691 446 0 7,119 5,709 980 121 0 6,810 5,693 1,077 303 0 7,073 New Jersey 10,127 1,351 15 0 11,493 11,110 869 18 0 11,997 11,803 832 16 0 12,651 New York 18,146 6,090 3,277 9 27,522 18,508 4,908 3,009 17 26,442 19,070 3,407 3,164 16 25,657 Pennsylvania 8,976 3,759 753 0 13,488 9,258 2,430 618 0 12,306 9,709 2,489 622 0 12,820 GREAT LAKES Illinois 7,020 4,127 54 0 11,201 6,750 3,581 67 0 10,398 6,550 2,977 61 0 9,588 Indiana 7,256 1,105 149 0 8,510 7,277 1,231 135 0 8,643 7,452 1,057 171 0 8,680 Michigan* 42 2,566 10,811 0 13,419 102 1,911 10,842 0 12,855 318 1,796 10,945 0 13,059 Ohio 9,060 2,254 772 901 12,987 8,404 2,239 774 520 11,937 8,469 2,000 734 312 11,515 Wisconsin 6,249 926 233 0 7,408 5,841 848 230 0 6,919 5,915 782 238 0 6,935 PLAINS Iowa 2,525 541 125 0 3,191 2,694 435 44 0 3,173 2,732 473 46 0 3,251 Kansas 2,971 688 165 0 3,824 3,077 471 166 0 3,714 3,095 478 164 0 3,737 Minnesota 6,084 1,074 43 1 7,202 6,625 779 44 1 7,449 8,875 805 48 1 9,729 Missouri* 2,646 1,457 1,224 0 5,327 2,770 1,086 1,425 0 5,281 2,914 957 1,358 0 5,229 Nebraska 1,040 500 63 0 1,603 1,047 395 66 0 1,508 1,088 328 72 0 1,488 North Dakota 592 151 49 0 792 620 154 56 0 830 658 136 57 0 851 South Dakota 388 242 2 0 632 358 169 3 0 530 402 173 3 0 578 SOUTHEAST Alabama* 3,718 1,339 187 0 5,244 3,909 969 183 0 5,061 3,773 1,109 283 0 5,165 Arkansas 1,943 786 794 0 3,523 2,000 615 765 0 3,380 2,056 519 767 0 3,342 Florida 8,738 3,635 1,736 0 14,109 8,244 2,169 1,413 0 11,826 9,448 2,098 1,090 0 12,636 Georgia 7,068 2,690 419 171 10,348 7,061 2,241 331 232 9,865 7,381 2,065 303 167 9,916 Kentucky 3,941 1,092 31 0 5,064 4,129 919 32 0 5,080 4,141 846 34 0 5,021 Louisiana 3,160 1,274 754 0 5,188 3,298 1,101 573 0 4,972 3,277 1,190 900 0 5,367 Mississippi 1,902 868 421 0 3,191 1,993 795 328 0 3,116 2,016 797 361 0 3,174 North Carolina 7,262 1,549 549 0 9,360 8,776 1,438 581 4 10,799 8,887 2,716 149 0 11,752 South Carolina 1,908 1,216 714 0 3,838 1,995 824 690 0 3,509 2,264 890 749 0 3,903 Tennessee 3,600 1,557 47 0 5,204 4,046 1,261 63 0 5,370 4,184 1,311 114 0 5,609 Virginia 4,832 1,288 579 0 6,699 4,979 1,358 607 0 6,944 5,254 1,029 645 0 6,928 West Virginia 1,786 377 15 23 2,201 1,950 369 16 23 2,358 1,820 362 16 23 2,221 SOUTHWEST Arizona 3,577 1,336 619 88 5,620 3,569 1,185 570 89 5,413 3,669 1,061 636 88 5,454 New Mexico 2,339 593 1 0 2,933 2,366 421 1 0 2,788 2,455 414 1 0 2,870 Oklahoma 2,279 912 329 0 3,520 2,357 755 338 0 3,450 2,368 662 444 0 3,474 Texas 18,201 7,316 3,063 21 28,601 18,249 4,848 3,529 15 26,641 17,293 5,025 3,839 6 26,163 ROCKY MOUNTAIN Colorado* 2,963 888 3,534 0 7,385 2,833 656 3,781 0 7,270 3,015 614 3,918 0 7,547 Idaho 1,291 291 101 0 1,683 1,241 293 77 0 1,611 1,299 251 84 0 1,634 Montana 618 252 63 0 933 629 173 115 0 917 697 162 77 0 936 Utah 2,322 577 41 0 2,940 2,409 469 37 0 2,915 2,534 481 76 0 3,091 Wyoming 7 98 130 0 235 7 98 131 0 236 2 28 444 0 474 FAR WEST Alaska 1,240 246 42 0 1,528 1,292 233 54 0 1,579 1,355 233 47 0 1,635 California 32,040 7,931 92 2,670 42,733 32,102 6,261 122 1,216 39,701 37,665 6,706 131 3,172 47,674 Hawaii* 1,336 323 52 0 1,711 1,458 284 56 0 1,798 1,444 287 63 0 1,794 Nevada 1,249 439 140 0 1,828 1,116 251 430 0 1,797 1,212 393 371 0 1,976 Oregon 2,267 826 601 0 3,694 2,967 661 164 0 3,792 2,527 560 593 0 3,680 Washington 6,305 1,185 154 202 7,846 6,789 887 126 191 7,993 6,720 799 97 257 7,873 TOTAL $226,044 $72,180 $36,892 $4,695 $339,811 $232,297 $56,589 $36,403 $2,967 $328,256 $244,378 $54,844 $38,009 $4,768 $341,999
Table 7
elemenTary and Secondary educaTion expendiTureS ($ in millionS)
Actual Fiscal 2011 Actual Fiscal 2012 Estimated Fiscal 2013
Region/State GeneralFund FederalFunds Other State
Funds Bonds Total GeneralFund FederalFunds Other State
Funds Bonds Total GeneralFund FederalFunds Other State
Funds Bonds Total
Table 8
elemenTary and Secondary educaTion expendiTureS aS a
percenT oF ToTal expendiTureS
Region/State Fiscal 2011 Fiscal 2012 Fiscal 2013 NEW ENGLAND Connecticut 14.0 % 13.9 % 14.0 % Maine 13.7 13.1 16.6 Massachusetts 11.1 10.7 10.6 New Hampshire 22.3 23.5 23.3 Rhode Island 14.2 14.2 14.9 Vermont 31.9 31.1 32.5 MID-ATLANTIC Delaware 24.5 24.6 24.3 Maryland 21.0 19.5 19.1 New Jersey 24.4 24.7 24.3 New York 20.7 19.8 19.3 Pennsylvania 19.5 18.4 18.9 GREAT LAKES Illinois 19.9 15.8 14.4 Indiana 32.2 32.9 31.3 Michigan 27.6 27.2 26.8 Ohio 21.5 20.6 19.8 Wisconsin 17.3 16.7 16.2 PLAINS Iowa 17.7 16.8 16.6 Kansas 26.0 25.8 25.9 Minnesota 22.9 23.8 27.2 Missouri 23.1 22.6 22.8 Nebraska 16.3 15.3 14.6 North Dakota 15.8 13.8 14.3 South Dakota 16.3 14.3 14.0 SOUTHEAST Alabama 21.7 20.9 21.4 Arkansas 17.3 16.3 15.5 Florida 21.6 18.8 18.1 Georgia 25.3 24.0 24.1 Kentucky 19.9 19.8 19.6 Louisiana 16.6 18.4 18.1 Mississippi 17.4 16.9 16.3 North Carolina 18.4 23.2 22.9 South Carolina 17.3 15.9 17.5 Tennessee 17.2 17.7 17.8 Virginia 15.8 16.0 15.5 West Virginia 10.4 10.8 9.5 SOUTHWEST Arizona 18.3 19.0 18.6 New Mexico 20.4 19.7 19.7 Oklahoma 16.6 16.5 16.2 Texas 30.4 28.7 27.0 ROCKY MOUNTAIN Colorado 23.9 25.3 26.5 Idaho 25.5 25.7 22.6 Montana 15.1 15.5 15.5 Utah 23.2 24.7 24.5 Wyoming 3.9 3.9 5.5 FAR WEST Alaska 10.9 13.4 13.5 California 19.8 19.9 20.9 Hawaii 15.2 15.6 15.5
Fiscal 2011 to 2012 Fiscal 2012 to 2013 Region/State State Funds Federal Funds All Funds State Funds Federal Funds All Funds NEW ENGLAND Connecticut 2.1 % -1.9 % 4.4 % 4.0 % -12.9 % 2.5 % Maine -2.7 -71.9 -6.2 4.7 1,162.5 22.1 Massachusetts 4.7 -7.2 2.3 4.6 -14.7 1.0 New Hampshire 2.4 3.5 -1.8 0.3 -4.8 0.0 Rhode Island 2.2 -9.6 -0.9 9.2 1.3 7.7 Vermont 3.8 -24.7 0.5 4.0 -0.7 3.5 MID-ATLANTIC Delaware 8.9 0.4 6.7 3.3 -13.5 1.4 Maryland 7.4 -42.0 -4.3 2.8 9.9 3.9 New Jersey 9.7 -35.7 4.4 6.2 -4.3 5.5 New York 0.4 -19.4 -3.9 3.3 -30.6 -3.0 Pennsylvania 1.5 -35.4 -8.8 4.6 2.4 4.2 GREAT LAKES Illinois -3.6 -13.2 -7.2 -3.0 -16.9 -7.8 Indiana 0.1 11.4 1.6 2.8 -14.1 0.4 Michigan 0.8 -25.5 -4.2 2.9 -6.0 1.6 Ohio -6.7 -0.7 -8.1 0.3 -10.7 -3.5 Wisconsin -6.3 -8.4 -6.6 1.4 -7.8 0.2 PLAINS Iowa 3.3 -19.6 -0.6 1.5 8.7 2.5 Kansas 3.4 -31.5 -2.9 0.5 1.5 0.6 Minnesota 8.8 -27.5 3.4 33.8 3.3 30.6 Missouri 8.4 -25.5 -0.9 1.8 -11.9 -1.0 Nebraska 0.9 -21.0 -5.9 4.2 -17.0 -1.3 North Dakota 5.5 2.0 4.8 5.8 -11.7 2.5 South Dakota -7.4 -30.2 -16.1 12.2 2.4 9.1 SOUTHEAST Alabama 4.8 -27.6 -3.5 -0.9 14.4 2.1 Arkansas 1.0 -21.8 -4.1 2.1 -15.6 -1.1 Florida -7.8 -40.3 -16.2 9.1 -3.3 6.8 Georgia -1.3 -16.7 -4.7 4.0 -7.9 0.5 Kentucky 4.8 -15.8 0.3 0.3 -7.9 -1.2 Louisiana -1.1 -13.6 -4.2 7.9 8.1 7.9 Mississippi -0.1 -8.4 -2.4 2.4 0.3 1.9 North Carolina 19.8 -7.2 15.4 -3.4 88.9 8.8 South Carolina 2.4 -32.2 -8.6 12.2 8.0 11.2 Tennessee 12.7 -19.0 3.2 4.6 4.0 4.5 Virginia 3.2 5.4 3.7 5.6 -24.2 -0.2 West Virginia 9.2 -2.1 7.1 -6.6 -1.9 -5.8 SOUTHWEST Arizona -1.4 -11.3 -3.7 4.0 -10.5 0.8 New Mexico 1.2 -29.0 -4.9 3.8 -1.7 2.9 Oklahoma 3.3 -17.2 -2.0 4.3 -12.3 0.7 Texas 2.4 -33.7 -6.9 -3.0 3.7 -1.8 ROCKY MOUNTAIN Colorado 1.8 -26.1 -1.6 4.8 -6.4 3.8 Idaho -5.3 0.7 -4.3 4.9 -14.3 1.4 Montana 9.3 -31.3 -1.7 4.0 -6.4 2.1 Utah 3.5 -18.7 -0.9 6.7 2.6 6.0 Wyoming 0.7 0.0 0.4 223.2 -71.4 100.8 FAR WEST Alaska 5.0 -5.3 3.3 4.2 0.0 3.5 California 0.3 -21.1 -7.1 17.3 7.1 20.1 Hawaii 9.1 -12.1 5.1 -0.5 1.1 -0.2 Nevada 11.3 -42.8 -1.7 2.4 56.6 10.0 Oregon 9.2 -20.0 2.7 -0.4 -15.3 -3.0 Washington 7.1 -25.1 1.9 -1.4 -9.9 -1.5 ALL STATES 2.2 % -21.6 % -3.4 % 5.1 % -3.1 % 4.2 %
Table 9
annual percenTage change in elemenTary and Secondary educaTion expendiTureS
Table 10
iTemS excluded From elemenTary and Secondary educaTion expendiTureS
Region/State
Employer Contributions to Pensions
Employer Contributions
to Health Benefits Head Start Libraries
Day Care Programs
School Health Care/ Immunization NEW ENGLAND Connecticut X X X P P Maine* X X X P Massachusetts X X New Hampshire X X X Rhode Island X X X P Vermont X X X X MID-ATLANTIC Delaware X P Maryland X P New Jersey P X X P New York P P X X X Pennsylvania X X X GREAT LAKES Illinois P X P Indiana P P X P P X Michigan* P P X X X Ohio Wisconsin X X X PLAINS Iowa X Kansas X X X X X Minnesota P P X Missouri* X X X X X X Nebraska P P X X X X North Dakota X X X X South Dakota X X SOUTHEAST Alabama X X X Arkansas P P P Florida X X X X Georgia X X X Kentucky X X Louisiana X X X Mississippi P X North Carolina X South Carolina X X X Tennessee P P Virginia X West Virginia X X X X SOUTHWEST Arizona X X X New Mexico P Oklahoma X X X X Texas X P P P ROCKY MOUNTAIN Colorado* P X X P X Idaho X X X Montana P P X P X X Utah X X X Wyoming FAR WEST Alaska X X X California X X X Hawaii P P X X X Nevada X X X X
Elementary and Secondary Education Notes
Small dollar amounts, when rounded, cause an aberration in the percentage increase. In these instances, the actual dollar amounts should be consulted to determine the exact percent-age increase.
Alabama: Federal funds received directly by local school
sys-tems are not reported at the state budget level.
Colorado: School personnel are paid at the school district
level—state costs for employer contributions to employee pensions and health benefits only reflect Colorado Dept. of Education personnel. Funds library-related programs across the state.
Hawaii: Elementary and Secondary Education does not
include capital expenditures.
Maine: Expenditures in the Elementary and Secondary
Educa-tion category for fiscal year 2012-13 include all state expendi-tures that support the state’s Department of Education. These funds were inadvertently omitted in the prior year submission. School health care/immunization includes under $0.5M in cap-ital expenditures.
Maryland: In fiscal 2013, the special fund growth is due to the
increased use of lottery funds to finance education local aid.
Michigan: Figures reflect K-12 education, the Michigan
Department of Education, adult education and pre-school. Employer contributions to current employees’ pensions and health benefits are reported for Department of Education employees and partially excluded for employees of K-12 schools. Effective for fiscal 2013, state funds partially offset employer-paid retirement obligations for employees of K-12 schools. Funding for libraries is included under elementary and secondary education effective for fiscal 2010, reflecting the merger of functions under Executive Order 2009-36. Actual ARRA expenditures will be recorded with the fiscal 2013 annu-al financiannu-al report.
Missouri: Districts may use a portion of funds for pensions