Worcester Polytechnic Institute
Digital WPI
Doctoral Dissertations (All Dissertations, All Years) Electronic Theses and Dissertations
2018-07-24
An Inductive Method of Measuring Students’
Cognitive and Affective Processes via Self-Reports
in Digital Learning Environments
Naomi Wixon
Worcester Polytechnic Institute
Follow this and additional works at:https://digitalcommons.wpi.edu/etd-dissertations
This dissertation is brought to you for free and open access byDigital WPI. It has been accepted for inclusion in Doctoral Dissertations (All Repository Citation
Wixon, N. (2018).An Inductive Method of Measuring Students’ Cognitive and Affective Processes via Self-Reports in Digital Learning Environments. Retrieved fromhttps://digitalcommons.wpi.edu/etd-dissertations/504
Abstract
Student affect can play a profoundly important role in students' post-school lives. Understanding students' affective states within online learning environments in particular has become an
important matter of research, as digital tutoring systems have the potential to intervene at the moment that students are struggling and becoming frustrated, bored or disengaged. However, despite the importance of assessing students' affective states, there is no clear consensus about what emotions are most important to assess, nor how these emotions can be best measured.
This dissertation investigates students’ self-reports of their emotions and causal attributions of those emotions collected while they are solving math problems within a mathematics tutoring system. These self-reports are collected in two conditions: through limited choice Likert response and through open response text boxes. The conditions are combined with students’ cognitive attributions to describe epistemic (neither purely affective nor purely cognitive) emotions in order to explain the relationship between observable student behaviors in the MathSpring.org tutoring system and student affect. These factors include beliefs, expectations, motivations, and perceptions of ability and control. A special emphasis of this dissertation is on analyzing the role of causal attributions for the events and appraisals of the learning
Acknowledgements
I’d like to thank Nuance and Shaughn for giving me a place to stay after my house caught fire. I was living with them when I started work on my proposal and beyond the physical need of shelter I definitely leaned pretty heavy on them in terms of emotional needs as well. Between my having just started HRT and my mom’s breast cancer (thankfully in remission) I can’t overstate how staying with them kept me from falling apart. Nuance and Shaughn will always be family.
I’d like to thank my mentors here in academia. Ryan Baker has always offered timely and rigorous feedback however busy his schedule is. Moreover his work on quantitative field coding of students’ behaviors provided much of inspiration for this work. Janice Gobert taught me how to write to a particular audience, which is a skill I still struggle with. Erin Ottmar gave me a formative lesson on the daunting work of grant application, which gave me a lot more
appreciation for Janice’s considerable skill. I have benefitted greatly from Erin’s commitment to her students’ professional growth. Also to my committee members Kaska Porayska-Pomsta and Joe Beck. While Kaska and I haven’t spoken much, her review of this dissertation has been perhaps the most thorough after Ivon’s. She’s given me a lot to consider and many avenues of potential work. Joe’s insights are always incisive and pragmatic; he has a way of laying complex concepts bare. While she’s not on my committee I’d like to thank Jaclyn Ocumpaugh for her insights and advice, I would have really liked having her on my committee, but I'm pretty confident she’d have told me to keep my committee as small as possible. Also Michael Sao Pedro has always taken an interest and offered words of support and invaluable career advice. Thank you Brittany for coffee, and reminding me to care for myself like a precision machine rather than a delicate flower. Finally, I’d like to thank my advisor Ivon for her copious notes,
meetings, and most of all encouragement throughout this dissertation. There were a lot of late nights, and a lot of revisions and throughout it all Ivon has been a great support.
I will always be grateful to the open-response coders: Danielle Allessio, Rashid Chatani, Taylyn Hulse, Colleen McShea, Tamisha Thompson, and Sarah Schultz. Coding these responses took several hours and then I had folks come back to discuss their own individual coding
schemes. It was a very long and involved process and without their commitment this entire dissertation would have been impossible. Thank you all so much.
Specifically, I’d like to give even more thanks to my colleagues Danielle and Sarah though. Danielle is probably the hardest working member of the MathSpring team and I hope that translates into a successful defense. Sarah has worked most closely with me in my open-response coding work including our prior published paper “Blinded by Science”. She left for Carnegie Mellon, near the start of my work I often miss her as a labmate to discuss ideas with.
I’d like to thank my parents. If you guys hadn’t both gotten your PhDs in psychology at Clark I don’t know if I would have viewed a doctorate as something within my reach. Also for the late night vent sessions and advice on the best wording for a self-report prompt. It really does mean a lot to be able to have a parent understand a struggle you’re going through. While I'm at it I would also like to thank my aunt Sarah and uncle John who were there at Clark with my
parents back in the day. Visiting them, and also Ellen and Thomaz, helped give me perspective on my work and academia in general.
Finally, I’d like to thank Holly for all the support: for the long walks, the flowers, the dinners, the home improvement projects, and the sharing of what’s stressing us out at the
Table of Contents
Table of Tables ... 8
Table of Figures ... 10
1 Introduction ... 11
2 Background Literature ... 15
2.1 Student Beliefs & Volition: The Cognition of Appraisal and Attribution ... 15
2.2 Control-Value Theory of Emotion ... 16
2.3 Tutoring and Learning Environments that Model Student Appraisal ... 17
2.4 MathSpring ... 18
3 Motivation ... 21
3.1 Memory is an Unreliable Account of Emotion ... 22
3.2 Students may not Understand Terminology as Researchers Do ... 22
3.3 “Forced Choice” Self-Reports may “Induce” instead of “Elicit” ... 23
3.4 Survey Measures Interrupt Workflow ... 23
3.5 Pilot Study ... 24
4 Research Goals ... 26
4.1 Improving Upon Existing Measures ... 29
4.2 Consequential Validity ... 30
4.3 Coarse Grained (Student) Level ... 31
4.4 Fine Grained (Action) Level ... 32
4.5 Contributions ... 32
5 Methods ... 35
5.1 Participants ... 35
5.2 Procedure ... 35
5.3 Measures ... 36
5.3.1 Student Level Learning and Performance Measures ... 36
5.3.2 Fine Grained Learning & Performance Measures ... 36
5.3.3 Aggregation ... 37
5.4 Student Level Affective & Disposition Measures ... 37
5.4.1 Affective Measures ... 37
5.4.2 Performance/Learning Measures ... 38
5.4.3 Fine Grained Affective & Disposition Measures ... 41
5.6 Open Response Coding Details ... 46
5.7 Multi-Coder Inter-rater Agreement Program ... 48
6 Results ... 51
6.1 Finalized Coding Scheme ... 51
6.1.1 Tag Descriptions ... 52
6.2 Inter-rater Reliability for the Finalized Scheme ... 64
6.3 Initial Student Level Analyses ... 65
6.3.1 Descriptives for Students’ Pretest, Dispositional, & Behavioral Measures ... 67
6.3.2 RQ1: What are the emotions that students report in an open-response assessment, and do they match student emotions from the literature? ... 70
6.3.3 RQ2: Are the ways students feel in a learning environment predetermined by their general attitudes and goals and abilities that students bring to the learning environment? ... 72
6.3.4 RQ3: How do students express their emotions in an online tutor, and how are these emotions associated with students’ behaviors in a digital learning environment? ... 75
6.3.5 RQ4: Why do students believe they feel a particular way? ... 78
6.4 Discussion of Initial Student-Level Results ... 86
6.5 Summary of New Research Questions from Student Level Analyses ... 89
3. A high degree of “annoyed” reports of emotion seem linked to negative website attributions. What are the events that precede/follow these reports? Is this a case of students externalizing blame due to temporary lapses in performance (i.e. “sour grapes”), or are these students voicing concerns with bugs or errors in the system itself. ... 90
6.6 Initial Action Level Analyses: Methods ... 90
6.6.1 New Hypotheses Building on Prior Work ... 92
6.6.2 Performance Measure: Probability of Performing Better than Random Guessing ... 96
6.6.3 Comparison by Student & Dependencies ... 99
6.7 Initial Action Level Analyses: Results ... 100
6.7.1 Increased challenge leads to confusion ... 100
6.7.2 Increased confusion leads to positive emotions if resolved/ frustration otherwise ... 101
6.7.3 Frustration leads to boredom through sustained poor performance ... 102
6.7.4 Consistent success may imply lack of challenge leading to boredom, or gratification at success 102 6.7.5 Boredom follows (and precedes) boredom ... 104
6.9 Extensions to Initial Student & Action Level Results ... 109
6.9.1 What Annoys Students? ... 110
6.9.2 “Bored”, “IDK”, “DTG”, Blank Responses: A closer look at potential Disengagement . 113 6.9.3 What Precedes/Follows Boredom? Is it a mood? Does it increase over a session? ... 113
6.9.4 What leads students to leave self-report prompts blank? ... 116
7 Discussion ... 121
7.1 Limitations ... 121
7.2 Students’ Perspectives in Self-Report ... 121
7.2.1 Positive Valence ... 123
7.2.2 Neutral Valence... 123
7.2.3 Negative Valence ... 123
7.3 Priming Effects: Differences between Open Response and Forced Choice ... 124
7.4 Improved Forced-Choice Self-Report ... 126
7.5 Extending this Work ... 127
7.5.1 Collecting Additional Data ... 127
7.5.2 Additional Analyses: Detector of Affect ... 128
7.5.3 Additional Analyses: Structural Equation Modeling ... 129
8 Conclusion and Future Work ... 131
Table of Tables
Table 1 Participant Summary ... 35
Table 2 Student Actions & System Events ... 36
Table 3 Breakdown of How Features are aggregated at the Student Level ... 37
Table 4 Student Level Affective Measures Gathered via Pre & Posttest ... 38
Table 5 Student Level Learning & Performance Measures Gathered via Pre & Posttest ... 38
Table 6 Student Level Affective and Disposition Self‐Reports Aggregated from within the MathSpring tutoring environment ... 39
Table 7 Student Level Behaviors Aggregated from Actions within the MathSpring tutoring environment ... 39
Table 8 Results of t‐tests and Descriptive Statistics for Math Pre to Posttest Gain, Pre to Posttest Change in Learning Orientation (LO), Pretest Emotion Survey Items, Pretest Learning Orientation (LO), and Math Pretest Scores by Sample Group (if both pre & post complete) ... 41
Table 9 Example of Kappa Program Confusion Matrix ... 49
Table 10 Tags used in Finalized Coding Scheme ... 51
Table 11 Coder Tags Related to the Code finalized as ‘Bored’, for Forced Choice Attribution, Open Response Feeling, and Open Response Attribution prompts ... 53
Table 12 Tags Related to the Code finalized as “IDK”, for Forced Choice Attribution, Open Response Feeling, and Open Response Attribution prompts ... 54
Table 13 Coder Tags Related to the Code finalized as “DTG”, for Forced Choice Attribution, Open Response Feeling, and Open Response Attribution prompts ... 55
Table 14 Coder Tags Related to the Code finalized as Positive for Forced Choice Attribution, Open Response Feeling, and Open Response Attribution prompts ... 56
Table 15 Coder Tags Related to the Code finalized as Negative for Forced Choice Attribution, Open Response Feeling, and Open Response Attribution prompts ... 57
Table 16 Coder Tags Related to the Code finalized as Easy for Forced Choice Attribution, Open Response Feeling, and Open Response Attribution prompts ... 57
Table 17 Coder Tags Related to the Code finalized as ‘Hard/Confusing’ for Forced Choice Attribution, Open Response Feeling, and Open Response Attribution prompts ... 58
Table 18 Coder Tags Related to the Code finalized as ‘Material’, for Forced Choice Attribution, Open Response Attribution, and Open Response Agency prompts ... 59
Table 19 Coder Tags Related to the Code finalized as ‘Success’, for Forced Choice Attribution, and Open Response Attribution prompts ... 59
Table 20 Coder Tags Related to the Code finalized as Growth, for Open Response Attribution, and Open Response Agency prompts ... 60
Table 21 Coder Tags Related to the Code finalized as Website, for Forced Choice Attribution and Open Response Attribution prompts ... 60
Table 22 Coder Tags Related to the Code finalized as Failure, for Open Response Attribution prompts .. 61
Table 26 Coder Tags Related to the Code finalized as design, for Open Response Agency prompt ... 63
Table 27 Coder Tags Related to the Code finalized as fun, for Open Response Agency prompt ... 63
Table 28 Coder Tags Related to the Code finalized as quit, for Open Response Agency prompt ... 64
Table 29 List of Tags, Total Instances, & Kappas for re‐coding by final coders: Coder N and Coder S ... 65
Table 30 Aggregate Behavior Measures Considered for Analyses ... 67
Table 31 Summary of Emotion & Attribution Tags Used, Total Instances (N), & Cohen’s Kappa of Interrater Reliability for Open‐Response and Forced Conditions. Values in bold if N or Kappa are unacceptably low. ... 68
Table 32 Likert Scale Self‐Reports for Closed Response Condition ... 69
Table 33 Descriptives for Emotion Tags for Open Response Condition ... 70
Table 34 Emotions vs Pre/Posttest Measures: Bivariate Correlations ... 74
Table 35 Emotions vs Behaviors: Bivariate Correlations ... 76
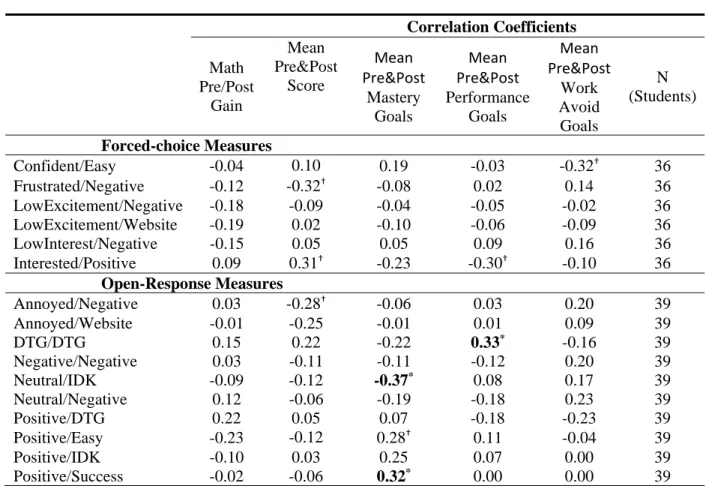
Table 36 Emotions vs Attributions: Bivariate Correlations ... 78
Table 37 Emotions vs. Attributions Count of Instances ... 81
Table 38 Infrequent & Partly Invalid Emotions vs Attributions: Bivariate Correlations ... 82
Table 39 Infrequent & Partly Invalid EMOTIONS vs ATTRIBUTIONS Count of Instances ... 83
Table 40 Correlations between Pretest measures & Frequent Emotion/Attribution Pairings ... 84
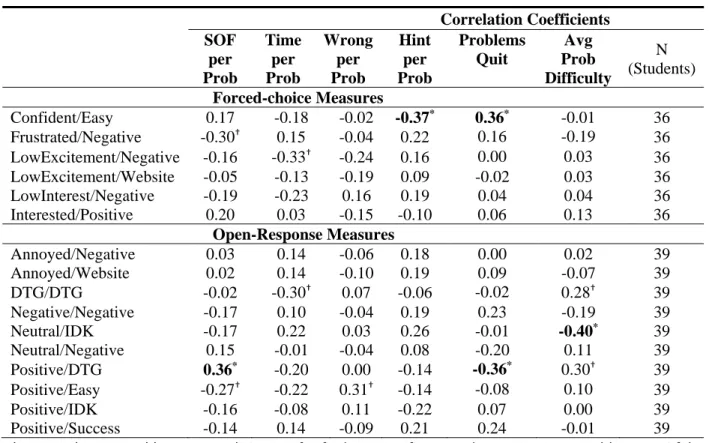
Table 41 Correlations Between Emotion/Attribution Pairings & Actions ... 85
Table 42 Emotional and Causal Attribution Measures for Open and Closed Response Conditions ... 95
Table 43 Example Cases Leading to 95% Better than Chance Likelihood ... 98
Table 44 Initial Fine Grain Results Summary: Results with marginal significance (p<0.1) in accordance with hypotheses labeled “CON”, non‐significance “INC”, significance counter to hypothesis “DIS” ... 104
Table 45 Attributions for Annoyance/Frustration ... 111
Table 46 Problems prior to Report of Frustration (N = 23) ... 112
Table 47 Problems prior to Report of Annoyance (N = 15) ... 112
Table 48 Reports which precede/follow reports of Boredom ... 114
Table 49 Interest/Boredom SOF per Problem ... 115
Table 50 Interest/Boredom Wrong per Problem ... 115
Table 51 Bored vs Not Bored Over Time ... 116
Table 52 Forced‐Choice Reports which precede/follow reports of Blank Reports ... 117
Table 53 Open Response Reports which precede/follow reports of Blank Reports ... 117
Table 54 Blank vs Not Bland Over Time ... 118
Table 55 Open Response Reports which precede/follow reports of Neutral Emotion and IDK attribution ... 119
Table 56 Reports which precede/follow reports of “DTG” ... 119
Table 57 Mean difference between behaviors coincident with, prior to, and following reports of “DTG” with paired samples t‐test significance (p) ... 120
Table of Figures
Figure 1 MathSpring Intelligent Tutoring System ... 18 Figure 2 "Jake" one of MathSpring's Learning Companions fostering a Growth Mindset ... 19
Figure 3 MathSpring's Student Progress Page offering Feedback on Students' Skill Development ... 20
Figure 4 Forced‐Choice Self‐Report Prompt that students encountered in MathSpring every 5 minutes or
8 problems ... 42
Figure 5 Open‐response Self‐Report Prompt that students encountered in MathSpring every 5 minutes
or 8 problems ... 43 Figure 6 Disequilibrium Hypothesis: Increased challenge leads to confusion ... 93
Figure 7 Productive Confusion Hypothesis: Increased confusion leads to positive emotions if resolved or
frustration if not ... 93
Figure 8 Hopeless Confusion Hypothesis: Frustration leads to boredom through sustained poor
performance ... 94
Figure 9 The Disengagement Hypothesis: Consistent success may imply lack of challenge leading to
boredom, or gratification at success ... 94
Figure 10 Persistent Boredom Hypothesis: Boredom precedes & follows boredom ... 95
Figure 11 “Sour Grapes” Hypothesis: Complaints about the domain or learning environment are likely
preceded by poor performance ... 95
Figure 12 T‐Test Comparing Performance Observed to Performance Expected due to Random Guessing
... 97 Figure 13 Proposed Future Self‐Report Prompt ... 126
1
Introduction
Student affect—the attitudes, interests, and values that students exhibit and acquire in school— can play a profoundly important role in students' post-school lives, possibly an even more significant role than cognitive achievements (Popham, 2009). Affect is recognized as a key indicator of student engagement and a variety of assessments of affect have shown affective constructs to be important predictors of learning (Linnenbrink-Garcia & Pekrun, 2011; Pardos et al., 2013; San Pedro et al. 2013) which raises the question: why isn’t it assessed more often? In part, the answer is that evaluation of students’ affective states remains a difficult challenge. No clear gold standard exists for identifying affective states, which has driven researchers to re-examine the intersection of general theories and concrete measurement methodologies (Graesser & D’Mello; 2011).
Many affective states in learning environments, such as boredom, confusion, frustration, and engaged concentration, are characterized as having an epistemic nature (Pekrun, 2010; D’Mello & Graesser, 2012). Epistemic states may be described as emotional (Silvia, 2009), or cognitive (Clore & Huntsinger, 2007), because they are often operationalized as partly dependent on particular events or cognition (Baker et al, 2010). Confusion is operationalized as an internal experience where the student is being confronted with an impasse and being uncertain what to do next (D’Mello & Graesser, 2012) or as the student experiencing challenge while attempting to understand a specific situation (Ocumpaugh, 2015). Boredom has been characterized as a state of disengagement from a learning task, or as a state where the student decides not to pursue a learning goal (D’Mello & Graesser, 2012). This makes it different from a student being “on task”, but simply disengaged (Ocumpaugh, 2015). Both D’Mello (2012) and the Baker Rodrigo Ocumpaugh Monitoring Protocol (BROMP) (Ocumpaugh, 2015) distinguish the same six
emotional states: Boredom, Confusion, Delight, Engaged Concentration, Frustration, and Surprise. Pekrun (2010, 2016) recognizes the same constructs with the exception of Engaged Concentration, and the addition of Anxiety and Curiosity as possible emotions.
In addition to the ambiguous cognitive/emotional nature of many of these epistemic emotions, there is also uncertainty regarding which constructs to consider. BROMP
(Ocumpaugh, 2015) emphasizes boredom, confusion, engaged concentration, and frustration as typically being more prevalent. This is in part based on prior work which found lower incidence of delight or surprise (D’Mello & Graesser, 2012).
This following work investigates whether factors that are neither purely affective nor purely cognitive might moderate and explain the relationship between observable events (e.g. student log data from digital learning environments) and student affect. These factors include beliefs, expectations, motivations, and perceptions of ability and control. The goal of this
dissertation is to analyze whether a link between behavior and affect exist, with a high emphasis on analyzing the role of causal attributions for the events and appraisals of the learning
environment, as possible causes of student affect. A definition of each of these terms follows.
Student beliefs can be summarized as a student’s assessment of a learning environment as it relates to that student’s motivation. Students may believe a learning task to be valuable or not valuable, but even if they believe the task is valuable, they might believe the task’s value is as a means to gain recognition (performance oriented learning), or valuable because of being a valuable task to further their own growth (mastery oriented learning). Given successive similar learning events students internalize an expected series of interactions and for beliefs based on
wherein individuals may believe their abilities are fixed and immutable or a product of effort; whether or not this belief is true the narrative of events tends to follow students’ expectations.
At the same time, motivation (Lepper & Henderlong, 2000) can be defined as students’ drive (or lack thereof) to pursue means to achieve goals, the approach or avoidance of a task, which in the case of learning environments may include: learning goals to improve one’s expertise, performance goals for external recognition of one’s performance, or work avoidance goals to minimize required effort (Harackiewicz et al, 2002). Meanwhile, attributions, or causal attributions, are specific causal beliefs students may hold as to why particular events may have occurred. While the definitions of these terms are important to understanding this document, they are meant to inform our interpretation of students’ open-ended self-reports, rather than rigidly adhering to specifically operationalized constructs. .
Given the complexity and overlap of the aforementioned constructs, this dissertation proposes an open analysis of students’ self-reports of their emotions, and the causal attributions of them. This approach is based on four motivations. First, open-ended self-reports may highlight constructs that we had not previously considered. Second, if students volunteer a particular emotion, cause of an emotion, or motivation without specific prompting then we may trust that the construct exists within their own conceptualization of their learning environment, and that it is not a product of leading questions. While some responses may be due to social desirability (i.e. telling educators what we want to hear) that glimpse at students’ understanding of our own goals may be a useful measure as these goals have already been internalized by students from a source other than self-report prompts. Third, as I am addressing emotions in their relation to cognition (Clore & Ortony, 2000) the most direct way to measure these internal cognitive processes is via open-response self-reports. Fourth, I hypothesize that these cognitive attributions may act as a
proxy between students’ emotions and behaviors as they are in themselves a cognitive link between events and feelings as articulated the student in vivo. It is my hope that the inclusion of these cognitive attributions will lead to more accurate predictions of both self-reported emotions and behaviors by including a cognitive component that has previously been missing from many computational models of students’ interactions within an intelligent tutoring system
environment. Please see section 4 “Research Goals” for a more complete description of the intended contributions of this work and central philosophical motivation. I shall begin by discussing prior work that has analyzed links between cognitive attributions and students’ emotional states and behaviors.
2
Background Literature
2.1 Student Beliefs & Volition: The Cognition of Appraisal and Attribution
Prior work by Rotter, (1966), Weiner (2010), and Elig & Frieze (1979) explored emotional states as a product of students’ causal attributions of academic success or failure. Weiner (2010) provides a good initial summary of this work by articulating an expectancy-value model of behavior, affect, and motivation. The expectancy-value model explains students’ behaviors by their expectation of success (or performance in general) and the value they place in the learning task. Weiner (1979) found that some emotions (happiness and disappointment) were independent of attributions, but were not independent of outcomes: whether students attributed their success or failure to internal or external causes was shown to be predictive of students’ emotional states. Students who believed they were responsible for their own success reported feelings of pride,
competence, and confidence. However, students who attributed their success to external causes were more likely to express gratitude, thankfulness, surprise, or even guilt.
The emotions experienced by students with attributions of failure similarly depended on whether those attributions were internally or externally directed. Students who reported feeling responsible for their own poor performance were more likely to report guilt or resignation, while students who attributed their failure outward more likely to report anger or surprise. As an extension of these findings, it’s possible that students who harbor a sense of guilt for their poor performance may behave differently than those who express anger. Weiner’s work modeled students’ expectation and valuation of the outcome of a learning task as deterministic of their emotional state in addition to empirically observable events.
This background research inspired my methodology for this dissertation: the inclusion of self-report data of expectations, attributions, and valuation towards the construction of models of
student affect for emotion detection. By encouraging students to report their thoughts and feelings in an open ended way I hope to uncover how students’ actions are influenced by their perceptions of their interaction with the learning environment.
2.2 Control-Value Theory of Emotion
Reinhard Pekrun (2007) extended Weiner’s contributions by creating the control-value theory of achievement emotions. This theory provided a framework to describe causes and effects of emotions students experience in academic contexts. The control-value theory proposed that emotions experienced vary depending students’ could focus on academic performance and tasks: prospective focus on future tasks (e.g. anxiety, hope, hopelessness), retrospective focus on past tasks (e.g. pride, sadness, shame, joy), and activity focus on current or ongoing tasks (e.g. frustration, boredom, enjoyment). Each focus allows for different emotions to arise.
Additionally, Pekrun proposed relationships between three continuous variables: perceived success/failure of a task, perceived value of a task, and perceived degree and locus of control a student has while performing a task (Pekrun et al 2007), which affect which emotions arise. The control-value framework allowed for further examination of interactions between terms. For example, both expectancy of success or failure and valuing of success or failure were
hypothesized to combine in multiplicative ways. The more value students assign to a task the greater pleasure they will experience with success and displeasure with failure, while a task perceived to have little value would likely result in boredom regardless of the outcome (Pekrun et al 2007).
This work builds on Pekrun’s, in that it focuses on the combination of students’ cognitive attributions, their reported emotions experienced, and the fine grained expression of student
behaviors in a digital learning environment, which are tracked through log files of student behavior events (mouse clicks in specific situations, timing of events, entered answers).
I hypothesize that these internal cognitive processes can help to explain the relationship between affect and behavior, as explained further in section 3.
2.3 Tutoring and Learning Environments that Model Student Appraisal
Recent work has considered student appraisals within digital tutoring and learning environments, called Intelligent Tutoring Systems (ITS). Typically, work of this nature adopts the OCC model of cognitive appraisal of emotions (Clore & Ortony, 1988). The OCC model provides an
organizational framework regarding the interactions between cognitive appraisals of particular emotional states and the emotional states themselves. Incorporating OCC into an ITS learning environment comes with the challenge of practical implementation and application. However, existing research has accomplished this feat through means such as direct survey measures of specific factors included in appraisal theory. Firstly, Sabourin’s work (2011) within the Crystal Island ITS incorporated students’ achievement emotions (e.g., anxiety, boredom, frustration, etc.) and goal orientation (whether focused on performance or learning). Secondly, Conati’s (2009) extensive work in emotion and appraisal using the OCC model accounts for students’ goals, personality traits, emotional states, and perceptions of the environment. Conati’s (2009) work astutely avoids the problem of cognitive load inherent in asking students’ to self-report on each of these dimensions. It does this by limiting self-reports to two simple and brief likert scale forced-choice prompts: “How do you feel about your game playing?”, and “How do you feel about the agent?” (Conati & Maclaren, 2009).
Research on open learner models (OLMs) also approach students’ self-appraisal of their learning (Dimitrova, 2003; Bull & Kay, 2007). While these models typically focus on students’
cognitive state and their mastery of educational materials, they also often require students’ investment in learning goals. Although the accuracy of students’ self-assessments may be debatable (Kruger & Dunning, 1999), the mere act of self-assessment may lead students to take greater responsibility in their learning (Boud et al. 1996; Bull et al. 1995). It remains to be seen if expanding these OLMs to include students’ emotional states could shift students’ relationships with their own emotional states. For example, perhaps through reporting on negative valence emotional states students might experience some form of relief similar to Sabourin’s (2011) work showing that disengaged behaviors may lead students to re-engage with a learning task.
2.4 MathSpring
MathSpring is an intelligent tutoring system (ITS) which addresses middle school (6th through 9th
grade) math content including number sense, pre-algebra, algebra, geometry (see Figure 1).
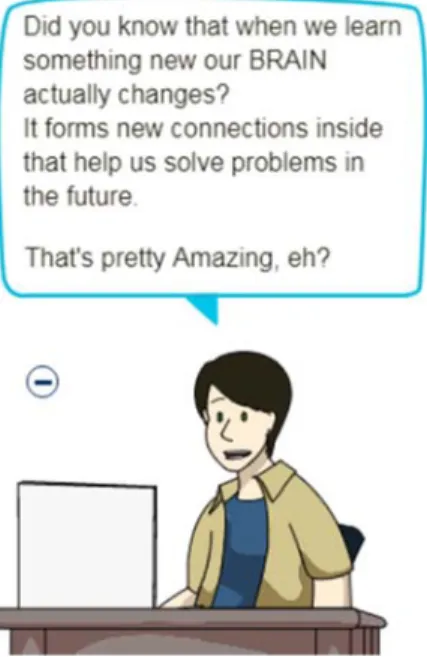
MathSpring adapts difficulty level based on students’ ability and scaffolds students with multimedia hints and pedagogical agents known as “Learning Companions” provide cognitive support (Woolf et al., 2010) in the form of problem solving strategies as well as motivational support by fostering a growth mindset (Dweck, 2006) in students (see Figure 2).
Figure 2 "Jake" one of MathSpring's Learning Companions fostering a Growth Mindset
MathSpring is based partially on an approach of cognitive apprenticeship (Collins et al., 1989) meant to bring cognitive processes out into the open so that students’ may metacognitively build on their skills. MathSpring does this by emphasizing the three steps of cognitive
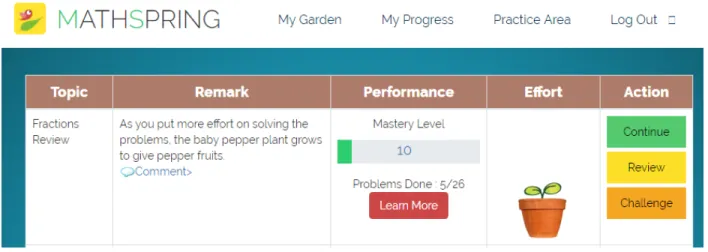
apprenticeship through: modeling with example problems, offering coached feedback and hints to support students’ attempts, and finally through reflection using the student progress page (see Figure 3). Furthermore, MathSpring involves instructors in the ITS learning environment through live updates on student progress in MathSpring’s “Teacher Tools” which highlight who in class may be struggling and what content may they may find excessively challenging.
Figure 3 MathSpring's Student Progress Page offering Feedback on Students' Skill Development
3
Motivation
As mentioned before, there has been other prior work emphasizing students’ emotion as the result of the appraisal of a situation in terms of value and control exerted over the task/domain. This appraisal implied a cognitive component over the judgment of the situation in which the emotion arises. While emotion might be overt, the cognitive appraisal is covert and not visible, thus asking students to self-report the reasons for their emotions is one the few means to tap into such appraisals. There are two major reasons this work is limited to self-report of emotional states. First, the simple argument of limiting cost and scope of this work: a design goal of this work was to explore and justify improvements to the currently existing Likert style forced choice self-reports used within the MathSpring learning environment. Secondly, and more importantly, the constructs to be examined herein are not pure emotional states in and of themselves, but rather students’ articulation and subjective understanding of their own emotional states. While this construct of students’ self-described affect may be closely linked to students’ internal emotional states the fact the nature of examining students’ own understanding of their emotional states necessitates gathering these data via self-report measures.
However, it is not well understood what is a proper and accurate way to collect students’ appraisals of a situation. Students’ self-reported emotion data comes with potential risks and practical concerns, as explained next. These concerns have motivated this design, which is why understanding them is important to critiquing and advising how methodology might be improved upon. First I shall list supporting evidence for each concern followed by the problem statement, goals, and proposed methods.
3.1 Memory is an Unreliable Account of Emotion
There is reason to doubt the accuracy of our recollection of emotions, in retrospect. For instance one study found that students reported consistently stronger affect regarding their schoolwork in a posttest survey outside of the learning environment than they did during a learning task (Bieg et al, 2014). At the same time, it is possible that the cognitive appraisals themselves may change during an extended learning task. For example, students may believe a task is initially
challenging but later quite easy or vice versa; alternatively students may believe a learning environment is fairly or unfairly designed depending on their experience. A post hoc summary would be less likely to capture dynamically shifting beliefs and perceptions. As a result, a method to measure such perceptions in the moment, and at a fine-grained level of detail, would be preferable.
3.2 Students may not Understand Terminology as Researchers Do
Often when researchers use affective terminology, terms come loaded with additional
connotative meanings that students may not share. As a specific example of this phenomenon: a researcher’s operationalization of “bored” may not match a particular student’s
operationalization of “bored” (Porayska-Pomsta et. al., 2013; Ocumpaugh et. al., 2015; Bieg et al., 2014). This may be due in part to the fact that communities of research strive to reach consensus on terminology. In a prior pilot study, students to sorted affective terms and facial expressions with regard to valence and activation; the main result of the work was that students’ responses varied widely (Wixon et al. 2015). As a result, “forced-choice” measures of self-report (which require students to select from a given set of responses) may provide inaccurate responses as students parse and interpret forced-choice measures differently than researchers’ might intend
3.3 “Forced Choice” Self-Reports may “Induce” instead of “Elicit”
In response to the previously mentioned difficulty of students’ inconsistent understanding of terminology, a common solution is to initially explain the meaning of survey measures to students to ensure their understanding of terminology matches researchers’ understanding (Porayska-Pomsta et. al., 2013). However, providing an explanation to students before they report their emotions or affective predispositions, may induce students to answer in a particular way, rather than eliciting a genuine response. Another difficulty is that students’ internal affective experiences might not be listed among the choices we provide in self-report prompts within the tutoring environment or pre and post survey measures. Further, other studies have shown that the act of reporting can alter students’ affective state (Kassam & Mendes, 2013; Ocumpaugh et. al. 2015). In conclusion, accounting for possible bias which traditional self-report prompts may introduce would be an important contribution of this dissertation. By removing the subtle suggestion of asking about particular emotions we can account for this possible bias.
3.4 Survey Measures Interrupt Workflow
Given the initial point of memory being unreliable, it seems preferable to ask students’ to report their feelings and associated thoughts the moment that those perceptions occur. However, one danger is that self-reports may disrupt students’ work flow (Ocumpaugh et. al. 2015). Self-reports which require additional cognitive load, e.g. recalling instructions regarding the meaning of new terminology and how it relates to work, completing a lengthy or highly detailed listing of items or options, would likely exacerbate this risk. It is clear that self-reports, if used as a
methodology to asses students’ affect, should be as noninvasive as possible. For this work, the point of remaining non-invasive is less to guarantee accuracy of reports as the constructs in question are ones of students’ self-reflection of their current emotional state and perceived
causes rather than student emotions in and of themselves; the more concerning aspect of self-reports here is the fact that taking time out to consider one’s emotional state may distract from attention paid to learning tasks.
Finally, students may opt to apply minimal effort responding to survey measures. Surveys which require students to select from among a series of choices may be filled out without care or reflection (e.g. responding “Very Much So” to every Likert scale item). In this specific example, students’ genuine desire to be left alone could be misread as the student having very strong feelings, when in reality the student was upset about the assessment itself. It is clear that forcing students to report on their emotions might not be an ideal way to assess emotion.
3.5 Pilot Study
In anticipation of this dissertation a study was conducted using self-report prompts already available within the MathSpring digital learning environment (Schultz et al 2016). Students from two sample groups collected in 2015 (N = 449) and 2011 (N = 464) were asked to make open ended causal attributions of their self-reported emotions. The process is described in greater detail in sections 5.5 and 5.6 which address how the coding scheme for open-response self-reports was determined.
Most students’ self-reports of cognitive attributions were described as “positive” or “negative” in terms of valence and were directed either “internally” or “externally” being attributed either to themselves or to external factors like the digital learning environment, or the domain of mathematics itself. However, all of these attributions were in response to “forced-choice” self-report prompts which were regarding one of four pre-determined emotional
while certain prompts were more likely to result in a given attribution this could be a result of the specific emotion students were asked about, or the internal emotions students were experiencing (if those emotions did indeed differ from the prompt).
Further, in many cases students responded to the cognitive attribution prompt with constructs typically considered to be within the purview of emotion: describing their experiences of boredom or their like or dislike of the material and learning environment. These students may have been using the cognitive attributional prompt to address emotional experiences they were having as the forced-choice prompt did not include the most apt descriptions of what they were feeling. To address this concern and the prior concern of priming students with forced-choice emotion reports I decided to test a prompt which included only open-ended prompts. This way I could test to see if completely open-response prompts yielded different results from those found using open-response cognitive attribution prompts which followed forced-choice emotion reports.
4
Research Goals
The main goal of this dissertation is to understand how tracking students’ appraisals of a situation may help explain emotions and behaviors within a digital learning environment. Attribution and appraisal data including students’ motivation and volition may allow us to predict students’ future behavior more accurately than a combination of pure affective
observations and behavior alone. Tracking students’ causal attributions of their emotional states may allow for two possible improvements on current affect detection. First, it should be possible to see if students’ attributions for why they feel a particular way are reflected in logged data of students’ actions. If, for example, students claim they are bored due to easy material or frustrated due to challenging material it should be possible to look back to find log data which support these claims, the absence of supporting data may also yield important information regarding how students view their experiences as compared to how researchers’ views. Second, regardless of students actual emotional state or the actual cause thereof, by inviting students to construct a causal relationship between events and their current emotional state we can more readily alter the learning environment to address their perceived needs. It is my intention that by including
attributional and volitional components to students emotional self-reports we may form a closer link between the events which occur in an online tutoring environment and students’ perceived well-being, taking us one step closer to closing the loop of affect adaptive online tutors.
This combination of cognitive attributions with emotional components are already present within epistemic emotional states. As described in the introduction, epistemic emotions may be described as emotional (Silvia, 2009), or cognitive (Clore & Huntsinger, 2007), because they are often operationalized as partly dependent on particular events or cognition (Baker et al,
operationalized as both a state of cognitive disequilibrium as well as the feeling of being uncertain how to proceed (D’Mello & Graesser, 2012).
The decision to analyze students’ cognitive attributions in relation to their emotions led to two more specific research questions:
a) What constructs ought to be considered?
b) To what extent should these states be described as cognitive, affective, or epistemic, a combination of cognitive and affective?
An association between students’ emotions and cognitive appraisals has been identified and researched within the control-value theory (CV) of emotions already (Pekrun, 2006). The control-value theory identifies students’ emotions in terms of students valuing of a task’s outcome and their perception of their degree of control in achieving a desirable outcome or avoiding an undesirable outcome. For example students who believe they risk failure in a particular task might anticipate feeling relieved if they believe themselves to have a high degree of control, or feel hopeless if they have a low degree of control. However, these associations have not been investigated within digital learning environments, nor in the moment they occur, which might be very important as expressed earlier. In addition, they have not been explored via a “bottom-up” approach either, starting from student data, but using a top-down approach, starting from prior theory which may originate from especially different student groups or learning environments. Rather than addressing these questions using a top-down approach, by selecting a set of theoretical constructs and then operationalizing them accordingly, I choose instead to approach these research questions from an empirical bottom-up approach, by
providing students with free text open-response prompts, to then find common themes within the responses.
The affective and attribution constructs resulting from this research will be compared to the constructs that have been considered so far by other researchers in this field of emotions in education and learning technologies, to analyze differences and potentially novel contributions.
Besides the relationships between affect and cognitive attributions, a further goal of this research is to find associations between student affect/attributions with student behavior, by tracking students’ written cognitive attributions alongside their students’ actions within the tutoring environment. This leads to the third research question:
c) What are associations between student affect and attributions with student behavior?
Factors that are neither purely affective nor purely cognitive (but instead, something in between) may moderate and explain the relationship between student affect and observable events (e.g., log data). For example, students may attribute feelings of boredom to material that is unchallenging, or frustration to material that is excessively difficult. Alternatively, some students may enjoy particularly easy material and report feelings of confidence. These examples of
emotion due to ease/difficulty relate to emotions largely in terms of students’ perceived degree of control (i.e. dominance) in the learning environment based on academic ability (Broekens & Brinkman, 2013; Fontaine et al., 2007). However, boredom may be modeled in terms of whether or not students perceive a task has value: if students don’t see a learning task as important they may experience boredom regardless their degree of control (Pekrun et al. 2007). Further, students may have prior mistrust of learning environments due to general student disengagement (Henry, 2007; Henry et al., 2012). I have cited a few possible factors which may influence students’ emotional states within learning environments; each of these factors may contribute to students’
possible culprits for students’ emotions and running the risk of overwhelming students with exhaustive survey measures designed to test for specific things (likely resulting in several null effects) I suggest that it might be better to first survey students on their perceptions of how their current emotions relate to possible causes within their learning environments. Let us use the model of physician and patient as an analogy for the relationship between educator and student: a physician begins by openly inquiring as to a patient’s symptoms. Despite a patient’s considerable lack of medical expertise as compared to a physician, a patient’s description of their subjective experience of symptoms provides a physician with a starting point for further diagnosing the patient with specific tests, or treating the patient if diagnosis appears immediately evident based on symptoms reported.
This is why I propose self-report data as an assessment mechanic, a relatively direct and simple means to collect information about students’ causal attributions for their feelings as well as chosen strategies to interact with a tutor environment. I intend on analyzing how these reported emotions and cognitive attributions relate to aggregates of student behavior, such as mistakes, help requests and other behaviors that are expressions of engagement and
disengagement.
4.1 Improving Upon Existing Measures
Our research group has been gathering data through forced-choice self-report measures for several years, alongside open-response measures of causal attribution (see section 5 “Proposed Measures”, particularly Figure 4 for a summary). Those affective self-reports asked students to report one of four experienced emotions (confidence, excitement, frustration, interest) via a forced choice scale going from “very [emotion]” to “not at all [emotion]”, and an open-ended
text box for the student to attribute their emotion to reasons (‘And why is that?’). This also constitutes one of the conditions used in this analysis, as described later.
However, based on the prior concerns mentioned, this dissertation explores the benefit of moving to an entirely open-response model of emotion reporting, where the student reports emotions via an open-text box.
One of the main goals of this dissertation is to evaluate and determine whether moving from forced-choice to open-response measures would make students’ emotional self-reports more closely related to their cognitive attributions of their emotional states and further that this combination of emotional self-report and cognitive attribution might be predictive of and predicted by student behaviors within an online learning environment.
4.2 Consequential Validity
In having students describe their expectations, feelings, and values regarding their work we hope to accurately predict these appraisals from a combination of prior events and students prior appraisals. Additionally, I would like to predict students’ future actions from students’ prior reported emotions and cognitive attributions. Again, this work is meant to more closely link students’ behaviors to their reported emotions by way of cognitive attributions. By getting a more complete model of students’ perceptions of their emotions and the causes thereof we hope to tailor students’ interactions with the learning environment to address elements students believe to have negative impacts on their experience.
Rather than placing emphasis on the veracity of reports, the primary goal I have is to determine which commonly reported symptoms can be used to predict students’ actions and be
“coarse grained”, wherein students’ self-reports may be predicted from pre and posttest survey and assessment items. The second level, “fine grained”, wherein particular sequences of actions may be predicted from students’ self-reports and vice versa (i.e. self-reports predicted from actions).
4.3 Coarse Grained (Student) Level
The pre and posttest survey measures are meant to determine student trait variables and an aggregate measure of students’ appraisals during the use of an ITS learning environment. A simple first sub-goal here is to determine how similar pre and posttest measures are to self-reports made within the tutor (Bieg et al, 2014). Secondly, I plan to examine how students who respond in a particular way to student trait survey measures later view the learning environment. For example, students may claim to be motivated by learning goals on a pretest survey and later within the learning environment report performance goals; if the environment is inducing performance goal orientation we might see a change in student performance as shown in prior work (Butler, 1993; Block et al., 1995). Asking a specific question may prompt a particular response from a student. However, asking them to simply report their predominant concerns may illuminate perspectives on the learning environment that are wholly orthogonal to the
presumptions of a forced-choice measure. Yet, this approach would still allow for students to report impressions that align with forced- choice measures. Finally, pre to posttest learning gains and average performance may be compared against aggregate measures of students’ self-reports within tutor: students’ emotions and attributions during a learning tasks at discrete points of time may be related to overall learning gains and performance over the course of a six month
4.4 Fine Grained (Action) Level
As coarse grained analyses dealt with changes over an entire session within an ITS, fine grained analyses focus on changes from one action to the next. Students’ judgment of their feelings and associated causes/attributions may explain the strategies they employ and the degree of
enthusiasm/commitment they apply to these strategies. We may see these judgments reflected in strategies and styles of use of the tutoring system, engagement behaviors or disengagement behaviors. Likewise, tutorial actions and specific pedagogical actions (e.g. offering examples, suggesting hints, making students reflect on their performance) may cause different reactions on students of varying judgments of emotions and reasons/causes.
4.5 Contributions
This work will act as a foundation for investigating the role of open response self-reports within online tutoring environments. While there is an extensive body of work from several decades ago examining student’s causal attributions in terms of expectancy value within learning
environments (Frieze, 1976; Frieze & Snyder, 1980; Weiner, 1985; Weiner et al., 1979), these self-reports are likely subject to cultural shifts over the years, between populations sampled (Rodrigo et al., 2010; Ocumpaugh et al., 2014), and finally due to the rather large move from pencil and paper assessment to modern intelligent tutoring systems which adapt based on students’ needs.
The potential for changes in what students feel to be salient emotions or the causes thereof lead to the next contribution of this work: an adaptive coding scheme meant to capture meaning from students open response self-reports. There is a tension between designing an emotion self-reporting tool that is applicable to a particular group of students in a particular
different emotions or causes entirely. This work serves as an initial case of creating and testing a final measurement tool and documenting the process of the tool’s creation that it may be entirely recreated to properly address the needs of distinct populations working in distinct learning environments.
The primary mechanism used to test measurement tools is through inter-rater agreement measures of Cohen’s kappa. Cohen’s kappa has been used in the past as a means to measure agreement between separate coders looking for a particular construct by comparing the number of agreements and disagreements about observing this construct in question (Cohen, 1960; Ocumpaugh et al., 2014; Gobert et al., 2015; Henrie et al., 2015). Cohen’s kappa as applied here measures the agreement between coders who have not been instructed to identify a particular construct or list of constructs, but rather coders who have been instructed to try and identify summary tags to classify open response self-reports. As such, the Cohen’s kappa here provides not only a matter of reliability of a defined test measurement, but whether multiple parties will independently create the same sorts of constructs without instruction. Using Cohen’s kappa as a means to develop measurement tools and determine what constructs ought to be measured rather than simply as a test of two individuals agreeing when applying a particular set of instructions required performing several inter-rater agreement tests between coders. Further, the coders might not use the same wording (i.e. tag) for a given construct. This required the creation of a program to measure the high points of coincidence in separate coders classification of a data set, and then to calculate Cohen’s kappa for agreement between those coders. This process is described in greater detail in section 5.7.
Finally, the last major contribution of this work is that it will make more accurate affect detection possible. By incorporating cognitive attributions, hopefully we will be able to more
easily link students’ self-reported emotions to their actions using these attributions as a proxy. Knowing why a student believes they feel a particular way should have some association to events we can observe in the learning environment, perhaps moreso than that student’s emotional self-reports on their own.
5
Methods
5.1 ParticipantsThe first study involved 85 eighth grade students from a central Massachusetts middle school. In order to protect the anonymity of this particular school, school demographic data below (Table 1) was rounded to the nearest quartile. Students at this school outperformed the average schools within the same municipality, but performed below the state average on the Composite
Performance Indices for English Language Arts, Mathematics, and Science.
Table 1 Participant Summary
Variable Hispanic White First Language
Not English English Language Learner High Needs Economically Disadvantaged % Student Population 25% 50% 50% 25% 50% 50%
These studies were conducted with a single teacher, who taught 3 separate periods of mathematics.
5.2 Procedure
As MathSpring covers a variety of topics aligned to the Massachusetts state standards for eighth grade mathematics, the study was performed throughout the school year in tandem with units students were working on in class for a total of 7 days within a 6-month period. On each of these days students spent their entire period of Math class working with MathSpring. During day 1, students completed a brief pretest that included both mathematics content as well as affective and goal orientation survey measures (see section 5.4) and began working on MathSpring
immediately afterward. The following days were spent working within MathSpring. On the final 1-2 days MathSpring experienced technical difficulties, thus we decided to provide an identical posttest to the pretest, this time on pencil and paper.
Each class of students worked with MathSpring as a class in a computer lab within their middle school. Both their teacher and the author were present during students’ work. Students were discouraged from conversing with one another or using a calculator to solve problems and instead encouraged to do their work out on with pencil and paper when necessary.
5.3 Measures
5.3.1 StudentLevelLearningandPerformanceMeasures
Students’ achievement and learning (i.e. learning gains) were assessed at pretest and posttest time with items extracted from the Massachusetts Comprehensive Assessment System Standardized Test (MCAS) practice exams (see Appendix C). Additionally, measures of students’ behavior within the tutoring environment (as described in the following section) were aggregated to the student level to provide an overall student level measurement of students’ behavior and performance.
5.3.2 FineGrainedLearning&PerformanceMeasures
As students worked within MathSpring, their performance and behaviors as they attempted each problem were logged. Students’ interactions with the tutoring environment were tracked in the central relational database on the server where MathSpring runs, at UMASS Amherst (Table 2). Log data including each action and the time at which each action occurs (see table 2) were
recorded and used as predictive measures in the fine-grained analyses covered later in the Results section.
Table 2 Student Actions & System Events
Action Description
Hint Student receives a hint for a given problem
Right When a student solves a problem correctly
Besides detailed per problem measures of performance and behavior (e.g. measures of engagement of a student with each individual math problem), selected problems were aggregated to form performance measures at the beginning and end of each problem set (i.e. topic, or
knowledge unit) to form a within-tutor estimation of pretest performance and a within-tutor estimation of posttest problem solving performance. As a result students’ improvement or growth could be tracked in addition to change as measured by external pre and posttest.
5.3.3 Aggregation
Aggregate variables at the student level were calculated in two ways: first, by a simple average of all of a particular student’s responses for each measure (see table 3). Second, by the change in responses from the beginning of their work (e.g. pretest), and the end of their work (e.g.
posttest).
Table 3 Breakdown of How Features are aggregated at the Student Level
Average vs Change Pre & Posttest Measures Within Tutor Measures
Student Level Average
Mean of Pre & Posttest Scores Mean Performance within Tutor
Differential Across Time
Pre to Posttest Gain Change in Performance throughout tutor use
5.4 Student Level Affective & Disposition Measures
5.4.1 AffectiveMeasures
Students’ affective predispositions were measured at pre and posttest time using previously validated items in table 4 (Arroyo et al, 2012). The validation process showed the items were tightly statistically related to Reinhard Pekrun’s measures in the control value theory of emotion (Pekrun et al., 2016).
Table 4 Student Level Affective Measures Gathered via Pre & Posttest
Affective Measure Appendix of Measure and Cited Work
Interest Pre & Posttest Forced Choice of Interest (Appendix B) from (Arroyo et al, 2012;
Pekrun et al., 2016)
Confidence Pre & Posttest Forced Choice of Confidence (Appendix B) from (Arroyo et al,
2012; Pekrun et al., 2016)
Frustration Pre & Posttest Forced Choice of Frustration (Appendix B) from (Arroyo et al,
2012; Pekrun et al., 2016)
Excitement Pre & Posttest Forced Choice of Excitement (Appendix B) from (Arroyo et al,
2012; Pekrun et al., 2016)
Anger Pre & Posttest Forced Choice of Anger (Appendix B) from (Arroyo et al, 2012;
Pekrun et al., 2016)
Anxiety Pre & Posttest Forced Choice of Anxiety (Appendix B) from (Arroyo et al,
2012; Pekrun et al., 2016)
Boredom Pre & Posttest Forced Choice of Boredom (Appendix B) from (Arroyo et al,
2012; Pekrun et al., 2016)
Enjoyment Pre & Posttest Forced Choice of Enjoyment (Appendix B) from (Arroyo et al,
2012; Pekrun et al., 2016)
Hopelessness Pre & Posttest Forced Choice of Hopelessness (Appendix B) from (Arroyo et al,
2012; Pekrun et al., 2016)
Pride Pre & Posttest Forced Choice of Pride (Appendix B) from (Arroyo et al, 2012;
Pekrun et al., 2016)
5.4.2 Performance/LearningMeasures
Learning, Performance, and Work Avoidance goals were measured through the 18 item GOALS-S survey (Dowson & McInerney, 2004). The difference between these affective survey measures at posttest time and pretest time were also computed.
Table 5 Student Level Learning & Performance Measures Gathered via Pre & Posttest
Performance or Goal Orientation
Appendix of Measure and Cited Work
Math Score Students’ scores on a Math content pre and/or posttest (Appendix C) Items
from MCAS practice exams.
Mastery LO Mastery Learning Orientation (Appendix A) from GOALS-S Survey (Dowson
& McInerney, 2004)
Performance LO Performance Learning Orientation (Appendix A) from GOALS-S Survey
Initial analyses were conducted at the student level, involving many of the measures gathered during the pre and posttest, as described in tables 4 and 5 above. However, data was also collected within the tutoring environment, both through self-report (Table 6) and directly in the form of individual actions performed by students (Table 7). These fine-grained measures were aggregated by student to generate overall student measures for our initial student level analyses.
Table 6 Student Level Affective and Disposition Self‐Reports Aggregated from within the MathSpring tutoring environment Emotion,
Attribution, or Agency Prompt
Description and Relevant Figure of Prompt
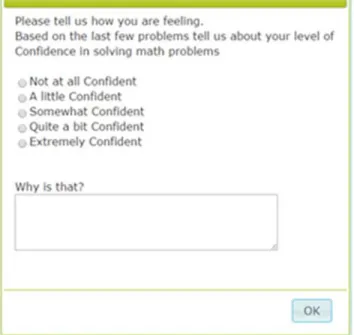
Forced Choice
Confidence
Likert Scale Response on a Scale of 1‐5 (5 being most) to the question of “Tell us
about your level of Confidence in Solving math problems” as in figure 4
Forced Choice
Excitement
Likert Scale Response on a Scale of 1‐5 (5 being most) to the question of “Tell us
about your level of Excitement in Solving math problems” as in figure 4
Forced Choice
Frustration
Likert Scale Response on a Scale of 1‐5 (5 being most) to the question of “Tell us about your level of Frustration in Solving math problems” as in figure 4
Forced Choice
Interest
Likert Scale Response on a Scale of 1‐5 (5 being most) to the question of “Tell us about your level of Interest in Solving math problems” as in figure 4
Forced Choice
Attribution
Human Coded tags for the attribution question “Why is that?” regarding an
emotion self‐report as in figure 4
Open Response
Emotion
Human Coded tags for the emotion question “How would you describe your
emotions now (as opposed to the last time you were asked)? in figure 5
Open Response
Attribution
Human Coded tags for the attribution question “Why do you feel that way?”
regarding an Open Response Emotion self‐report as in figure 5
Open Response
Agency
Human Coded tags for the control/agency centered question “What do you wish
you could do to improve this class right now?” as in figure 5
Table 7 Student Level Behaviors Aggregated from Actions within the MathSpring tutoring environment
Action Description
Hints Per Problem Number of times a student requested hints per problems attempted
Errors Per Problem Number of incorrect attempts a student made per problems attempted
Quits per Problem Number of times a student chose to end a problem without solving per
problems attempted
The measures of students’ behaviors were selected to be as simple as possible, only measuring the frequency of a particular action against problems completed: hints, errors, and quits. These events encompass the most frequent types of actions students may take as they work within the software with the exclusion of a correct attempt or getting a problem right. This is because MathSpring is designed to allow students multiple attempts until they get a problem correct, as well as simply choosing to stop working on a problem and quit out to a new problem instead. So by controlling for both errors and quits we can see how thorough students’ are as they progress through their work, as well as examine the possible causes of errors and quits. Students might quit problems because they are not challenging, or students may make errors as a part of their learning process. Finally, the measure of “seconds per problem” gives an overall idea of how quickly students are working, in addition to the other features we may be able to discern when extra time taken indicates a student being deliberate and thoughtful or alternately disengaged and off-task. Or whether a student is working quickly and competently or simply racing through problems with a combination of rapid guessing, hint abuse, or skipping.
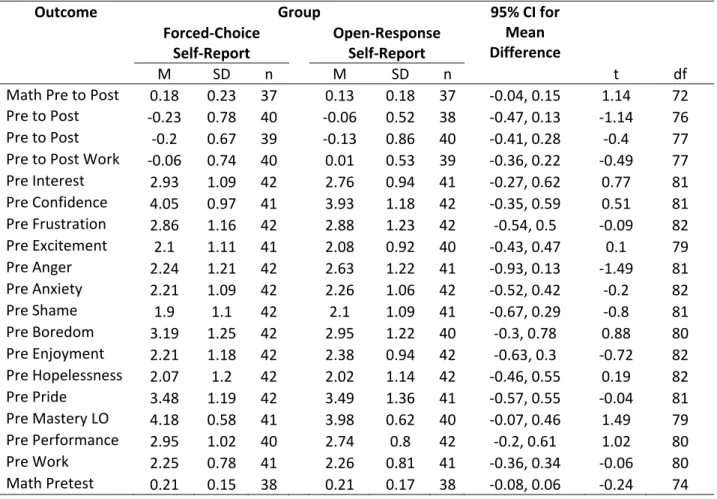
Finally, students’ responses to all pre test measures and pre to post change in terms of math skills, and goal orientation were compared across conditions forced-choice and open-response. Not every student completed all pre test and post test items due to leaving responses blank or transferring between schools or teachers. There were no significant differences between students in each condition according to these measures (see table 8).