Smart Grid, Smart City:
Shaping Australia’s
Energy Future
Executive Report
ABOUT THE AUTHORS
In March 2013, a consortium of Australian-based consultancy firms was commissioned to utilise the
Smart Grid, Smart City trial results and learnings to develop an integrated cost benefit assessment for smart grid technologies in a national context. The ‘AEFI’ consulting consortium included:
Arup Energeia
Frontier Economics
Institute for Sustainable Futures (University of Technology Sydney)
WRITING AND PROJECT
MANAGEMENT TEAM
Arup
Project Director – Richard Sharp, Project Manager – Ranelle Cliff
Michelle Norris (lead writer), Ranelle Cliff, Richard Sharp, Samuel Koci, Hugh Gardner
Energeia
Melanie Koerner, Ezra Beeman, Geoff Erder
Frontier Economics
Andrew Harpham, James Allen
Institute for Sustainable Futures
Edward Langham, Jenni Downes
ACKNOWLEDGEMENTS
AEFI would like to thank Ausgrid and Australian Government staff for their detailed input in providing background information, Smart Grid, Smart City trial data and feedback on different elements of the cost benefit assessment and final report.
This report was prepared by Arup in connection with the Smart Grid, Smart City Program in 2014. It takes into account our client's particular instructions, requirements and priorities at the time. This report is based on specific assumptions which have been outlined in a number of supporting technical documents published in conjunction with this report. No responsibility is taken by Arup to any third party including in relation to their use of the findings in this report and third parties are advised to undertake their own assessments as required to satisfy themselves as to the adequacy or otherwise of the contents on this report.
1 Introduction
8
1.1 The Smart Grid, Smart City Program 9 1.2 Location of smart grid trial activities 10
2
The Smart Grid, Smart City Trials
13
2.1 Common platforms work stream overview 14 2.2 Grid applications work stream overview 15 2.3 Customer applications work stream overview 16 2.4 Distributed generation and distributed storage work stream overview 17 2.5 Electric vehicles work stream overview 18
3
About the final series of reports from the
Smart Grid, Smart City Program
19
3.1 The national cost benefit assessment report 21 3.2 Smart Grid, Smart City Information Clearing House 22
4
Approach to the cost benefit assessment
24
5
Stakeholder Engagement
27
5.1 Rapid stakeholder engagement 27
5.2 Stakeholder forum 28
5.3 Stakeholder priorities 28
6
Customer interaction – Smart Grid, Smart City retail and
network trial survey results
29
6.1 Background to the retail and network customer trials 29 6.2 The Customer Research Survey scope of works 30 6.3 Trial participant experience survey results 31 6.4 Comparing trial participant responses to different feedback technologies and tariff products 34 6.5 Financially vulnerable households 36 6.6 Conclusions from Customer Research Survey 40 6.7 Conclusions from Customer Research Survey 41
7
Introduction to the national integrated cost benefit assessment
42
7.1 Introduction to national integrated cost benefit assessment 42 7.2 Economic deployment of smart grid technologies 43 7.3 Individual technology cost benefit assessments 46 7.4 Medium integrated cost benefit assessment economic scenario results 48
8
Key findings and recommendations for individual
smart grid technologies and products
51
8.1 Introduction 51
8.2 Key findings and recommendations for Fault Detection, Isolation and
Restoration (FDIR) technologies 51
8.3 Key findings and recommendations for Active Volt-VAr Control (AVVC) technologies 56 8.4 Key findings and recommendations for Substation and Feeder Monitoring (SFM) 58 8.5 Observations on wide area measurement systems (WAMS) trials 59 8.6 Key findings and recommendations for Smart Meter Infrastructure (stand-alone) 60 8.7 Key findings and recommendations for dynamic tariffs and
customer feedback technologies (plus SMI) 63 8.8 Key findings and recommendations for Electric Vehicles (EVs) 67 8.9 Key findings and recommendations for Distributed Generation (DG) and Distributed Storage (DS) 70 8.10 Key findings and recommendations in relation to customer electricity bills 74
9
Transitioning industry and consumers to a smart grid future
78
9.1 Electricity distribution networks 78
9.2 Electricity consumers 81
9.3 Transitioning to greater volumes of distributed generation 82 9.4 Australia’s grid emissions intensity 83
10 Maximising the benefits and opportunities in transitioning
to a smart grid in Australia
84
10.1 Balancing financial, reliability and environmental benefits 84 10.2 The case for cost reflective prices 84 10.3 The case for in-grid smart grid technologies 85 10.4 Varying economic conditions and national net benefits 85
11 Prioritising the recommendations from the national integrated
cost benefit assessment
86
Table of Acronyms
91
Preface
This is an independent report that has been prepared and developed following the successful completion of the Australian Government’s $100 million Smart Grid, Smart City Program. This major government initiative was delivered by Ausgrid and its consortia partners for the purpose of supporting and informing the industry-led adoption of smart grid technologies in Australia.
Australia’s electricity network and retail operators, for the most part, are currently able to fulfil their obligations to provide reliable, safe and secure and relatively affordable electricity to all types of consumers.
The continuing efficiency and resilience of the electricity system is fundamental to national productivity and economic growth. However, in recent times, the challenges facing the sector have increased in both scale and complexity. These challenges include changes in the trends of overall electricity demand and consumption (from highly positive growth to negative growth); a sharp increase in distributed generation (rooftop solar photovoltaic in particular); and changes to reliability standards, policies and regulatory frameworks.
Consequently electricity network operators are under growing pressure to anticipate and deliver outcomes that challenge the capabilities of existing infrastructure systems.
The reform agenda currently underway in Australia’s energy sector is occurring in parallel with a global transformation in the way electricity is produced, transported and stored.
In particular, over the past five years, Australians have seen major changes in the electricity sector. Network operators have invested billions of dollars in network refurbishment, while at the same time building additional network infrastructure late last decade to meet record demand for electricity during peak periods.
More than 1 million Australians1 have now embraced
solar power by installing rooftop solar photovoltaic (PV) systems. The number of installed systems will continue to grow in both residential and commercial buildings. Wind power capacity has also grown rapidly, predominantly driven by the Renewable Energy Target (RET).
In most states, residential customers have also experienced significant electricity price increases in response to network capital renewal programs. This has resulted in an increase in the number of households having difficulty in paying their electricity bills. As evidenced by these issues and others, the Australian energy sector will continue to face growing challenges in providing resilient and affordable electricity to consumers.
Smart grid technologies have a role in addressing a number of these challenges.
In 2009 the Australian Government recognised the importance of investing in commercial-scale trials of promising smart grid technologies, and as a result allocated funding in the order of $100 million2 in the
Smart Grid, Smart City Program. In total, around $490 million was invested in the Smart Grid, Smart City Program by all contributors.
The Program, which ran from 2010 to 20133, sought
to determine whether there were benefits from the deployment of these technologies for Australia.
1 Climate Commission, The critical decade – Australia’s future – solar energy, 2013
2 Unless otherwise specified, all dollar figures in this Report are quoted in AUD.
3 The Smart Grid, Smart City customer application trials were extended over the summer 2013-14 period, to enable additional data to be collected on residential customer behaviour and willingness to modify electricity usage. This allowed a greater amount of trial data to be used in the cost benefit assessment analysis
The Smart Grid, Smart City Program was arguably one of the widest-ranging technology assessments of smart grid products in the world. It saw:
● The deployment and testing of several smart ‘in-grid’ and ‘customer-focussed’ technology groupings across the Ausgrid network and EnergyAustralia retail business in New South Wales
● Examined the impacts and benefits of additional distributed generation and distributed storage solutions
● Involved approximately 17,000 electricity customers in consumer-focussed trials examining how residential customers could contribute to peak demand management through behavioural changes
The Smart Grid, Smart City Program focused on residential customers, as they represent the largest user group in Australia, and generally have more discretion over when and how much energy they use. Little was known before the Smart Grid, Smart City
trials about how customers perceived, or how they might respond to, the opportunities that smart grid technologies offer.
Most residential electricity customers in Australia are currently provided with limited information and very few incentives and tools to manage their domestic electricity use. A quarterly electricity bill is the main source of customer feedback, and this only shows the total amount of energy used during the previous three months, limiting the opportunities to systematically modify behaviour in order to save electricity and money.
Based on the trials undertaken, this final Smart Grid, Smart City report, Shaping Australia’s Energy Future: National Cost Benefit Assessmentfound the potential for a net economic benefit of up to $28 billion ($2014) over the next 20 years from the deployment of smart grid technologies in Australia.
This report demonstrates that there are four key aspects to realising these benefits and improving consumer pricing outcomes:
● Technological development and deployment of enabling (smart grid) technologies
● The introduction of cost reflective electricity pricing including dynamic tariffs
● Consumer behaviour change with respect to electricity consumption (to better manage any future growth in peak demand)
● Energy market reform4 (many aspects of which are
already underway)
Realising the potential benefits requires an integrated solution – if any one aspect is not implemented, then the extent of net national economic benefits available will be reduced.
A large proportion of the net benefits identified can be derived from the economic deployment of a number of in-grid technologies which improve operational efficiency, reduce capital investment (through better managing peak demand) and deliver improved reliability for consumers at a lower cost. There are vast differences across Australia’s electricity grid, from highly populated suburban areas to sparsely populated rural areas, and different smart grid technologies are better suited in different circumstances. For those Australians living in
suburban areas, there are significant potential benefits from certain in-grid technologies. Likewise, for less densely populated rural networks, there are alternative in-grid technologies which can assist in improving the reliability and cost of managing the grid.
At present, commercially mature forms of distributed storage have limited availability and are not financially viable for most Australians. However, this cost benefit assessment indicated that from the early-to-mid 2020’s, distributed storage could begin to be financially attractive for consumers and will grow in installed capacity over the period through to 2034. In the future, electricity networks in Australia will be expected to continue to provide sufficient capacity to deliver electricity and meet demand peaks. Analysis undertaken as part of the Smart Grid, Smart City Program has shown that it is possible to more effectively manage peak demand through consumer behavioural change and with the assistance of feedback technologies and dynamic tariffs. This analysis showed that with the appropriate pricing signals and behavioural changes it could be possible to improve electricity bill outcomes for consumers and increase the level of network asset utilisation compared to traditional approaches of additional network and generator capital investment.
Changes in tariff structures (dynamic pricing signals), and the associated consumer behaviour change, will need to be carefully considered in conjunction with governments, consumer groups, network operators and retailers to ensure that the solutions developed has regard for all stakeholder perspectives. Some of this work is already underway with the Australian Energy Market Commission (AEMC) considering proposed rule changes from the Council of Australian Government (COAG) Energy Council. In addition the COAG Energy Council has a work program which is focussed on improving consumer demand side participation through time-varied electricity pricing. For Government, the findings of this report will need to be considered within the context of the existing energy market reform agenda and is intended to provide empirical data which supports future decision making and identifies where additional future investigations may be warranted.
Electricity grids have developed over time and in an environment where planning and managing the provision of reliable, safe and secure electricity supply was predicated on key assumptions. “The implicit assumption of grid planners and managers has been that electricity will be generated at a few locations and distributed to many energy users, and that the behaviour of both generators and users can be predicted with a reasonable degree of confidence over time scales of hours, days and years.5”
These long-held assumptions are now being called into question, and in many parts of Australia, may no longer hold in the very near term.
For the most part, networks across Australia are currently able to fulfil their obligations to provide reliable, safe and secure electricity to all types of consumers. This is largely due to the robust regulatory environment in which they operate. However, in recent times, the challenges of network planning, management and associated costs are increasing in scale and complexity. These challenges include changes in the trends of overall electricity demand and consumption (from highly positive growth to negative growth); a sharp increase in distributed generation (rooftop solar PV in particular); and changes to reliability standards, policies and regulatory frameworks. Consequently, electricity network operators are under growing pressure to anticipate and deliver outcomes that challenge the capabilities of existing infrastructure systems.
5 Standards Australia AS5711 Australian Standard: Smart Grid Vocabulary, 2013 ISBN 978 1 74342 585 5
This need for more advanced decision-making abilities for network operators is reasonably
consistent throughout the world. As a consequence a range of innovative information and communication systems have been developed and are now driving an electricity grid ‘modernisation’ – often termed a
smart grid.
Standards Australia defines a ‘smart grid’ as “an electricity system incorporating electricity and communications networks, that can intelligently integrate the actions of parties connected to it”. “The implicit assumption in smart grids is that energy may be generated and used anywhere on the grid, the behaviour of both generators and users is much more variable and less predictable, and that both will continuously react to the other6”.
Smart grid technologies offer the potential to better predict electricity supply and demand at specific locations in the grid, continuously monitor the condition of the grid and major assets, dynamically reconfigure the network and more efficiently utilise labour and materials. These technologies also provide the opportunity to interact with customers in order to actively manage demand on different parts of the network. However, the boundary between a conventional grid and a smart grid is not easily identified.
6 Standards Australia AS5711 Australian Standard: Smart Grid Vocabulary, 2013 ISBN 978 1 74342 585 5
“There is no absolute level of capability or set of attributes which marks the transition of a specific electricity network from conventional to smart. Grids may become more smart over time as they acquire more of the transactional, operational and technical features defined in this Standard.
In general, a smart grid is distinguished from a conventional grid by the deployment of enhanced information and communications systems, in order to manage equipment in a way that achieves outcomes remotely, automatically, more rapidly and more precisely7”.
Modernising the grid using ‘smart’ technologies will require additional capital investment. Determining the most economically efficient technologies and deployment opportunities for Australian conditions was a key driver of the Australian Government’s investment in the Smart Grid, Smart City Program in 2010.
1.1 The
Smart Grid,
Smart City
Program
In 2010, the Australian Government committed approximately $100 million in funding to the Ausgrid consortium which included: Ausgrid (one of the three New South Wales electricity distribution entities); IBM Australia; GE Energy Australia; Grid Net; CSIRO; TransGrid; EnergyAustralia; Landis+Gyr; Sydney Water; Hunter Water; the University of Newcastle; the University of Sydney; Lake Macquarie City Council and the City of Newcastle.
Ausgrid and its trial partners provided additional funding resulting in total funding for the Smart Grid, Smart CityProgram of approximately $490 million in both cash and in-kind support. The Smart Grid, Smart CityProgram represents one of the largest commercial-scale trial deployments of smart grid infrastructure of its kind in the world.
The objectives of the Smart Grid, Smart City Program were to:
● Deploy a demonstration and/or commercial scale rollout, as specified in the Guidelines, that informs a business case for key applications and technologies of a smart grid
● Build public and corporate awareness of the economic and environmental benefits of smart grids and obtain buy-in from industry and customers
● Gather robust information and data to inform broader industry adoption of smart grid applications across Australia
● Investigate synergies with other infrastructure (such as gas, water and the National Broadband Network)
As part of awarding the funding, the Australian Government specified a range of activities, outcomes and data priorities for each of the trial work streams. These activities and data priorities were designed to answer a number of research questions.
The Australian Government also specified a number of key datasets and results which it expected the
Smart Grid, Smart Citytrials to produce. Each of these activities, outcomes and data priorities was specified in contractual obligations and have been reported against over the trial period.
In essence, the Smart Grid, Smart City trials focused on producing results which could be used to determine whether individual or combinations of smart grid technologies could achieve economic benefits for Australian electricity consumers.
1.2
Location of smart
grid trial activities
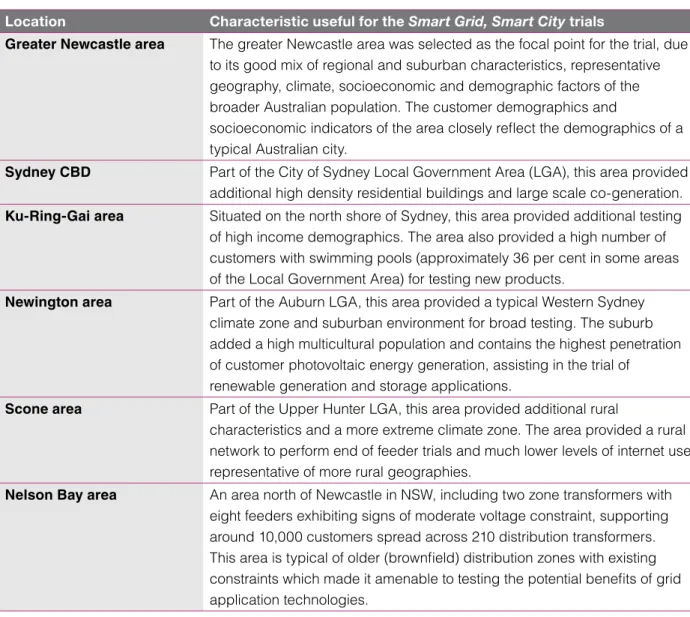
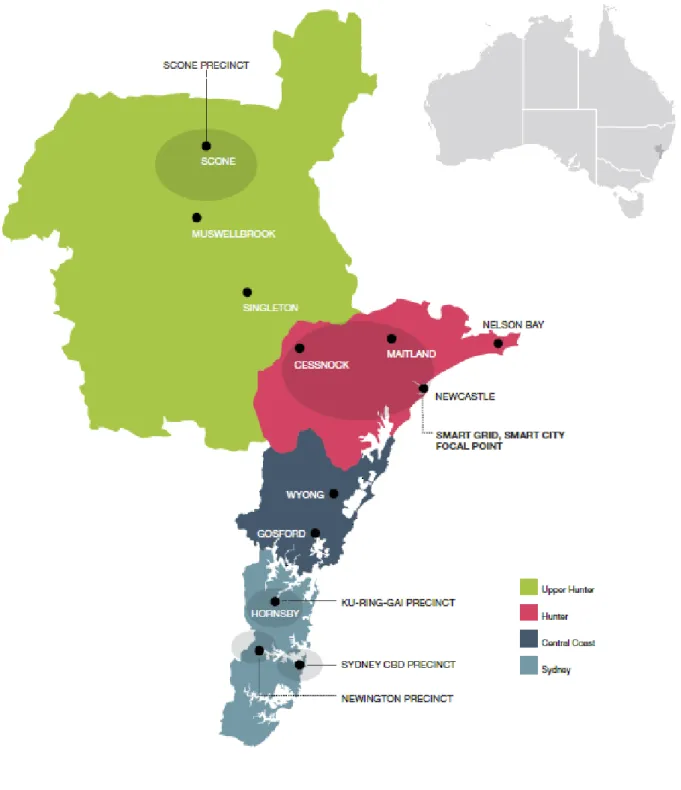
The trial was largely focussed on the greater Newcastle and Sydney CBD areas with some additional areas selected to test specific smart grid applications on long rural network topologies. The selection of appropriate geographic locations for the trial was considered critical to producing reliable data that could be accurately extrapolated to assess the viability of a large scale smart grid roll-out in Australia. The greater Newcastle area was selected as one of the focal points for the trial due to its mix of regional and suburban characteristics that result in representative geography, climate, socioeconomic and demographic factors. The customer
demographic and socioeconomic indicators in Newcastle closely reflect the demographic attributes of a typical Australian city. Newcastle’s close relationship to the Australian average for customer demographics is widely accepted and has resulted in the city being used as a test market for products and services prior to their rollout across Australia in the past.
The Smart Grid, Smart City trial locations (see Figure 1) were designed to provide a sound representation of the geographic, climate, customer demographic and electricity network characteristics of a number of regions throughout Australia. It was felt that this would produce nationally transferrable results. Importantly, the trial locations:
● Included a mix of both urban and regional areas
● Had demographic characteristics closely reflecting the national average in terms of household income, household occupancy, English proficiency, housing types, tenure types, energy sources and appliance stock. In addition, the trial locations contained sufficient variability in these characteristics to test their impact on measured outcomes
● Had similar climates to a large portion of the Australian population including both Climate Zones 5 and 68, in which 60-65 per cent of Australia’s
population is located
● Demonstrated energy consumption patterns reflective of the Australian population, including both summer and winter peaks in energy demand
● Had sufficient variability in topographic and terrain characteristics to allow accurate testing of alternative technologies
● Demonstrated a range of different overhead and underground network configurations, both radial and meshed networks, and had rural, urban and CBD characteristics typical of Australian networks
● Contained several areas with high network utilisation making them good locations to demonstrate energy efficiency and demand management initiatives.
● Given the different network types captured by these varying geographic, socioeconomic, demographic and electricity network conditions, it was determined that these areas were broadly representative of a large portion of the Australian population. These are discussed further in Table 1.
8 The climate zones used for the purposes of the
Smart Grid, Smart City Project were based on those
produced by the Australian Building Codes Board,
http://www.abcb.gov.au/en/major-initiatives/energy-efficiency/climate-zone-maps last published in December 2012.
Location Characteristic useful for the Smart Grid, Smart City trials
Greater Newcastle area The greater Newcastle area was selected as the focal point for the trial, due to its good mix of regional and suburban characteristics, representative geography, climate, socioeconomic and demographic factors of the broader Australian population. The customer demographics and
socioeconomic indicators of the area closely reflect the demographics of a typical Australian city.
Sydney CBD Part of the City of Sydney Local Government Area (LGA), this area provided additional high density residential buildings and large scale co-generation.
Ku-Ring-Gai area Situated on the north shore of Sydney, this area provided additional testing of high income demographics. The area also provided a high number of customers with swimming pools (approximately 36 per cent in some areas of the Local Government Area) for testing new products.
Newington area Part of the Auburn LGA, this area provided a typical Western Sydney climate zone and suburban environment for broad testing. The suburb added a high multicultural population and contains the highest penetration of customer photovoltaic energy generation, assisting in the trial of
renewable generation and storage applications.
Scone area Part of the Upper Hunter LGA, this area provided additional rural
characteristics and a more extreme climate zone. The area provided a rural network to perform end of feeder trials and much lower levels of internet use representative of more rural geographies.
Nelson Bay area An area north of Newcastle in NSW, including two zone transformers with eight feeders exhibiting signs of moderate voltage constraint, supporting around 10,000 customers spread across 210 distribution transformers. This area is typical of older (brownfield) distribution zones with existing constraints which made it amenable to testing the potential benefits of grid application technologies.
The aim of the Smart Grid, Smart City Program was to gather robust information about the costs and benefits of smart grids to help inform future decisions about smart grid technologies by government, electricity providers, technology suppliers and consumers across Australia.
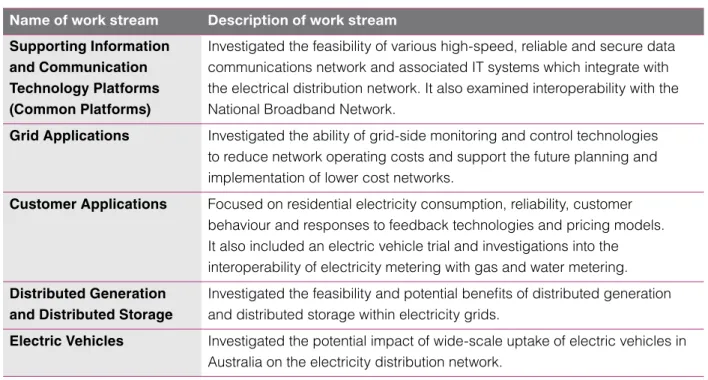
The trials involved the development, deployment, trial and analysis of smart grid infrastructure, products and solutions. For the purpose of the trials, the smart grid technologies and applications were categorised into work streams described in Table 2.
A high level overview of the individual Smart Grid, Smart City work streams is provided in the following sections. A more detailed account of the timelines and deliverables, trial findings, conclusions, lessons learned and recommendations can be found in individual Technical Compendia or Part One of the main report.
Name of work stream Description of work stream Supporting Information
and Communication Technology Platforms (Common Platforms)
Investigated the feasibility of various high-speed, reliable and secure data communications network and associated IT systems which integrate with the electrical distribution network. It also examined interoperability with the National Broadband Network.
Grid Applications Investigated the ability of grid-side monitoring and control technologies to reduce network operating costs and support the future planning and implementation of lower cost networks.
Customer Applications Focused on residential electricity consumption, reliability, customer behaviour and responses to feedback technologies and pricing models. It also included an electric vehicle trial and investigations into the interoperability of electricity metering with gas and water metering.
Distributed Generation and Distributed Storage
Investigated the feasibility and potential benefits of distributed generation and distributed storage within electricity grids.
Electric Vehicles Investigated the potential impact of wide-scale uptake of electric vehicles in Australia on the electricity distribution network.
2 The Smart Grid,
Smart City Trials
2.1 Common
platforms work
stream overview
Unlike the rest of the Smart Grid, Smart Citytrials, which evaluated specific smart grid technologies, the purpose of this work stream was to provide an evaluation of how successfully these trials were able to leverage the common platform developed as part of the Smart Grid, Smart City Program. In addition this work stream sought to identify any learnings that could inform the design and implementation of a smart grid common platform for other network businesses.
The project aimed to evaluate the requirements for a smart grid common information and communication technology (ICT) platform in the following areas:
● The effectiveness of current standards and the degree to which they permit interoperability of the wide variety of systems and devices making up the smart grid
● The data security and information privacy implications of the common platform
● The processing, management, correlation and storage of large amounts of data available from the smart grid
● The data centres, disaster recovery, backup, and monitoring systems necessary to support the common platform
● In addition, this study assessed the potential for the National Broadband Network (NBN), which was being rolled out in Australia at the time of the trial, to provide communication services to field-based smart grid infrastructure.
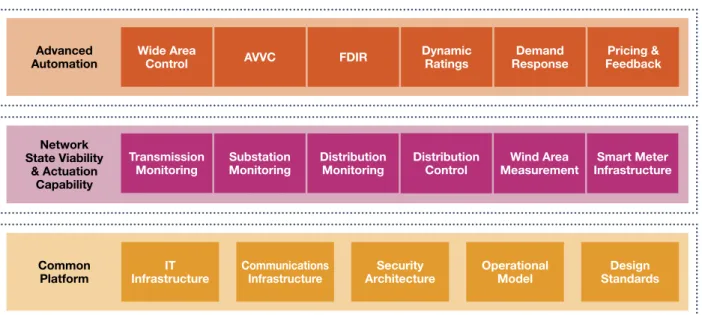
The smart grid common platform developed for the Smart Grid, Smart CityProgram consisted of a communications network providing connectivity between the various elements of the smart grid, together with supporting IT infrastructure. This is described in Figure 2.
Figure 2 Smart grid common platform layers
AVVC Transmission Monitoring IT Infrastructure Advanced Automation Network State Viability & Actuation Capability Common Platform FDIR Substation Monitoring Communications Infrastructure Dynamic Ratings Distribution Monitoring Security Architecture Demand Response Distribution Control Operational Model Wide Area
Control FeedbackPricing &
Wind Area Measurement Design Standards Smart Meter Infrastructure
2.2
Grid applications
work stream overview
The Grid Application work stream included a combination of projects which trialled grid-facing smart technologies within Ausgrid’s distribution network. The intent of the Grid Application trials was to deploy and integrate smart grid technologies (generally) with the existing infrastructure at various points on the electrical network. The Grid Application technology trials aimed to assess:
● Whether smart grid monitoring and control technologies could reduce the cost of running an electrical network
● Whether integrating smart grid technologies and techniques had the potential to enable the design of a lower cost electrical network
● How smart technologies could improve the reliability of the distribution network
● How smart technologies could improve the quality of service
● Which technologies had the potential to deliver the best results for different network densities and characteristics
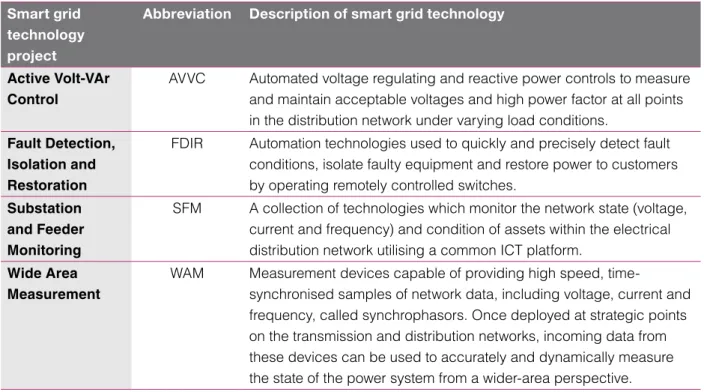
Table 3 provides an overview of the different smart grid technologies trialled in the grid applications work stream.
Smart grid technology project
Abbreviation Description of smart grid technology
Active Volt-VAr Control
AVVC Automated voltage regulating and reactive power controls to measure and maintain acceptable voltages and high power factor at all points in the distribution network under varying load conditions.
Fault Detection, Isolation and Restoration
FDIR Automation technologies used to quickly and precisely detect fault conditions, isolate faulty equipment and restore power to customers by operating remotely controlled switches.
Substation and Feeder Monitoring
SFM A collection of technologies which monitor the network state (voltage, current and frequency) and condition of assets within the electrical distribution network utilising a common ICT platform.
Wide Area Measurement
WAM Measurement devices capable of providing high speed,
time-synchronised samples of network data, including voltage, current and frequency, called synchrophasors. Once deployed at strategic points on the transmission and distribution networks, incoming data from these devices can be used to accurately and dynamically measure the state of the power system from a wider-area perspective.
2.3 Customer
applications work
stream overview
The Smart Grid, Smart City Customer Applications Program trialled different methods of interacting with customers purchasing electricity as part of the broader Smart Grid, Smart City Program. Customers play a major role in smart grids, however, little is known about how they might perceive or respond to the opportunities that smart grid technologies offer. The Customer Applications Program sought to understand whether providing residential consumers with smart grid devices and different pricing would enable customers to make informed choices and potentially better control their consumption of electricity over the long-term and/or during peak events.
The Customer Applications trials tested:
● Whether consumer-focussed smart feedback devices and near real-time electricity consumption information could influence residential customer behaviour on how and when electricity is used and reduce consumer energy bills
● Whether integrating consumer-focussed smart feedback devices with different pricing strategies and near real-time electricity consumption information could influence residential customer behaviour on how and when electricity is used and reduce consumer energy bills
● Behavioural changes and responsiveness from different residential consumer demographic groups against each of the different combinations of smart feedback devices and / or pricing strategies. In particular, emphasis was placed on assessing the effect of interventions on vulnerable energy users
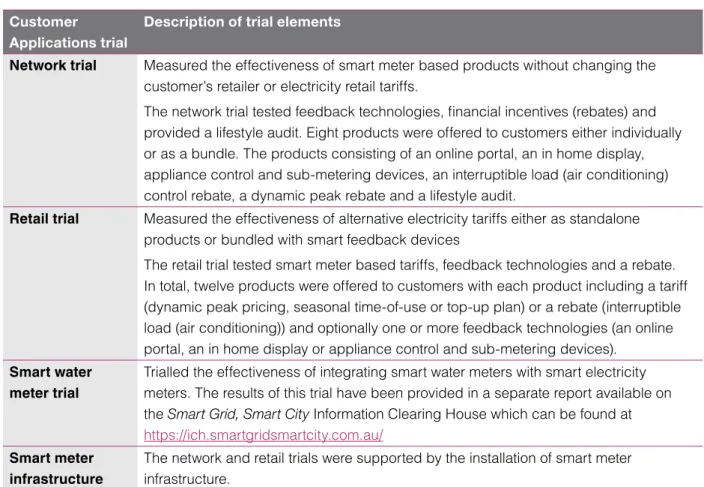
Table 4 provides an overview of the different smart grid devices and pricing strategies trialled as part of the customer applications work stream.
Customer Applications trial
Description of trial elements
Network trial Measured the effectiveness of smart meter based products without changing the customer’s retailer or electricity retail tariffs.
The network trial tested feedback technologies, financial incentives (rebates) and provided a lifestyle audit. Eight products were offered to customers either individually or as a bundle. The products consisting of an online portal, an in home display, appliance control and sub-metering devices, an interruptible load (air conditioning) control rebate, a dynamic peak rebate and a lifestyle audit.
Retail trial Measured the effectiveness of alternative electricity tariffs either as standalone products or bundled with smart feedback devices
The retail trial tested smart meter based tariffs, feedback technologies and a rebate. In total, twelve products were offered to customers with each product including a tariff (dynamic peak pricing, seasonal time-of-use or top-up plan) or a rebate (interruptible load (air conditioning)) and optionally one or more feedback technologies (an online portal, an in home display or appliance control and sub-metering devices).
Smart water meter trial
Trialled the effectiveness of integrating smart water meters with smart electricity meters. The results of this trial have been provided in a separate report available on the Smart Grid, Smart City Information Clearing House which can be found at
https://ich.smartgridsmartcity.com.au/ Smart meter
infrastructure
The network and retail trials were supported by the installation of smart meter infrastructure.
2.3.1 Smart meter infrastructure
To enable the Customer Applications trials 17 134 smart meters were installed at residential customer premises. In addition smart meter infrastructure was also deployed. This infrastructure included:
● The various communications technologies required to transport data to and from the smart meter, the feedback technologies and the Ausgrid and EnergyAustralia back office systems
● The firmware that controlled how the smart meter interacted with the meter’s communication module
● The Meter Management System (MMS)
● Back office operational systems at Ausgrid, EnergyAustralia and Sydney Water
● The customer acquisition application
The smart meter infrastructure enabled the remote collection of residential electricity usage data, the storage and analysis of these data, and the delivery of these data to smart grid feedback devices in trial participant’s homes. Smart meter infrastructure also provided the ability for off-peak scheduling for hot water systems.
These capabilities aimed to provide the information and tools necessary to help consumers, Ausgrid and EnergyAustralia manage and reduce over electricity consumption and demand during peak periods for the network or wholesale market.
2.3.2 Trial participant surveys
Retail and network trial participants were surveyed twice in the last year of the trial to ascertain their level of engagement and satisfaction with the trial feedback technology products and tariffs. Analysis undertaken for this report also sought to determine whether these technologies and pricing signals led to changes in behaviour around electricity consumption. These findings are discussed in Section 6 of this Executive Report.
2.4 Distributed
generation and
distributed storage
work stream overview
The Smart Grid, Smart CityDistributed Generation and Distributed Storage (DGDS) Project was initiated to provide critical data and information to help understand the implications of greater penetration of distributed storage integrated with distributed generation and other smart grid technologies. The Distributed Generation and Distributed Storage Project sought to:
● Understand the maturity and suitability of distributed generation and distributed storage devices
● Assess the impacts on the grid from increased penetration of distributed generation and distributed storage devices
● Understand the value distributed generation and distributed storage devices can potentially deliver for network operators and customers
The program consisted of field trials, advanced modelling and simulation trial elements. The field trial results were used to validate the models and gain insights into the commercial-scale deployment of these technologies. The advanced modelling and field simulations provided additional analytical tools for different penetrations of distributed generation and distributed storage devices which are not commercially and physically possible in a field trial.
2.5 Electric vehicles
work stream overview
The overall objective of the Smart Grid, Smart City
EV Project was to understand the potential impact of wide-scale uptake of electric vehicles in Australia on the electricity distribution network.
To date, the majority of studies in Australia have focussed on travel behaviour, driver perceptions, uptake rates and the impact of electric vehicles on the electricity network at a whole-of-system level (a number of these are described in the following sections). Many of these studies identified that the greatest potential impact is likely to be at the distribution level, but to date investigations into the magnitude of this impact tend to be generalised. In addition, existing studies did not link spatial analysis of electric vehicle uptake with localised feeder impacts. This study represented the first investigation in Australia which has investigated the sensitivity of distribution network to spatial variation in electric vehicle uptake.
The Smart Grid, Smart City EV Project was
informed by four distinct trial components: charging infrastructure deployment; road trials; uptake and behaviour modelling; and grid impact modelling. Twenty Mitsubishi iMiEV electric vehicles were used in the trials which included business trialling at Ausgrid and separate fleet and home trials.
Significant effort was invested in the original design of the Smart Grid, Smart City Program to endeavour to meet the key objectives and priorities of the Australian Government and its stakeholders. It was the intention that the Smart Grid, Smart City trial elements produce meaningful data that could be extrapolated in a national context and utilised by industry and other interested stakeholders. With this in mind, the Australian Government specified a range of activities, outcomes and data priorities for each of the program / trial work streams. The activities and data priorities were designed to prove (or challenge) a number of trial hypotheses (assumptions). The hypotheses were focussed on determining whether different smart grid technologies could achieve an economic or other benefit for Australian electricity consumers.
In March 2013, a consortium of Australian-based consultancy firms was commissioned to utilise the
Smart Grid, Smart City trial results and learnings to develop an integrated cost benefit assessment for smart grid technologies in a national context. The ‘AEFI’ consulting consortium included:
● Arup
● Energeia
● Frontier Economics
● Institute for Sustainable Futures (University of Technology Sydney)
While undertaking an integrated financial and economic assessment and developing conclusions and recommendations, AEFI considered the broad requirements of the program, including:
● The key questions and assumptions that the Australian Government was seeking to validate, or challenge
● Existing energy market reforms under investigation or in progress
● Australian Government energy policies, programs and its strategic intent for the energy sector and energy consumers
● Stakeholder priorities and expectations including those identified during the stakeholder engagement processes completed as part of AEFI’s assessment of the Smart Grid, Smart City Program
In addition, a clear expectation of the Smart Grid, Smart City Program was that there would be significant effort focussed on presenting the results of the trial for different audiences. To this end, there are several levels of reporting being delivered as part of completion of the program:
● The National Cost Benefit Assessment Report (for which this is the Executive Summary) which provides stakeholders with an independent assessment of the potential integrated national cost benefit assessment using (predominantly) data produced by the Smart Grid, Smart City trials to determine the potential national net benefits of deploying economically efficient smart grid devices, customer feedback technologies and dynamic (cost reflective) electricity tariffs. The integrated methodology used to develop the analysis and costings within this report ensures that there is no double counting of benefits provided by two or more technologies and any under or overestimation of the value proposition achieved from technology interdependencies is minimised.
● The Technical Compendia prepared by Ausgrid and partners that provide a detailed overview of the results for each of the work streams. These documents are technically complex and aimed at an audience that is familiar with energy sector terminology and technology. The intended audience includes network operators, energy retailers, technology providers, universities, regulators, governments and energy sector personnel. In addition these documents are intended to have global reach and contribute to the global knowledge base of smart grids
3
About the final series
of reports from the
Smart Grid,
● The Modelling Inputs Compendium is also part of this suite of technical documents. This compendium provides detailed information as to where data and information generated from the Smart Grid, Smart City trials have been used either as direct inputs or to validate and inform the modelling inputs to the national cost benefit assessment.
● The Modelling Inputs Compendium also provides a series of stand alone cost benefit assessments for individual smart grid technologies which could be applied in the instance that only one device or technology (or a series of discrete technologies or devices which do not have any interaction) is deployed in the Australian context. These stand alone cost benefit assessments represent a less sophisticated approach than the integrated cost
benefit assessment, but remain a valid estimate of
costs and benefits under some circumstances.
● Supporting documentation prepared by Ausgrid, AEFI and partners that provides the detailed information and data upon which the Technical Compendiums are based.
● An Information Clearing House (ICH) that provides the communication mechanism for the data, analytic tools and results from the Smart Grid, Smart City Program and will be maintained until 30 September 2015. This site can be found at
https://ich.smartgridsmartcity.com.au/
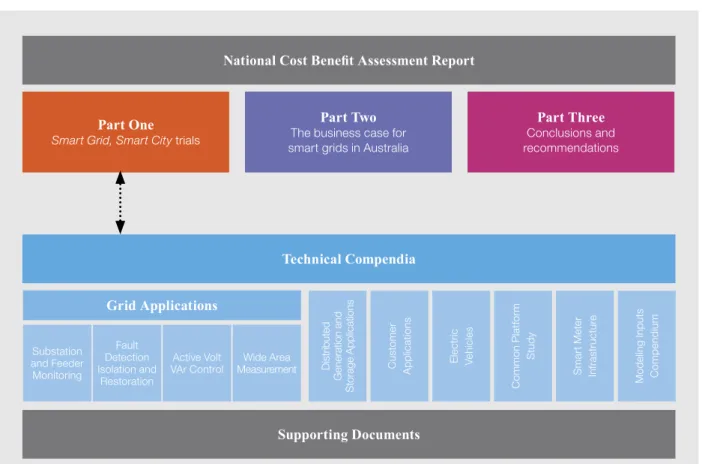
The breadth of the subject areas investigated as part of the Smart Grid, Smart City Program is shown in Figure 3.
Figure 3 Structured reporting and access to information for the Smart Grid, Smart City trial
National Cost Benefit Assessment Report
Supporting Documents Technical Compendia Grid Applications Substation and Feeder Monitoring Fault Detection Isolation and Restoration Active Volt
VAr Control MeasurementWide Area Dis
tr ib ut ed G en er at ion a nd S to rag e A pp lic at io ns Cu st om er A p p lic at io ns E le ctr ic Ve hic le s C omm on P la tf or m S tu d y S m ar t M et er In fr ast ru ct ur e M od el in g I np ut s C om p endi um Part One Smart Grid, Smart City trials
Part Two The business case for smart grids in Australia
Part Three Conclusions and recommendations
3.1 The national
cost benefit assessment
report
This is the final report to the Australian Government for the Smart Grid, Smart City Program and differs from previous progress reports. Importantly, it is an independent assessment that provides the analysis and discussion necessary to form:
● The business case (potential net economic benefit) associated with a future implementation of individual smart grid technologies, compared to a business as usual approach using the results of the integrated assessment9
● The business case (potential net economic benefit) associated with a future implementation of an optimised group of smart grid technologies (an integrated assessment), compared to a business as usual approach
● The business case (potential net economic benefit) for smart grid technologies for electricity networks and electricity generators (on a state-by-state10 basis)
● The description of how the costs and benefits accrue to electricity customers and the potential impact on retail electricity prices for a smart grid scenario compared with a business as usual approach.
9 Reporting the analysis in this way prevents double
This report is broken into a number of sections including:
● Executive Report (this report) – A standalone synopsis of the main report which provides a full summary of the Smart Grid, Smart City Program, the key trial findings, conclusions and recommendations
● Part One – An overview and the high level findings of the individual technology and customer trials
● Part Two – A cost benefit assessment for the deployment of a national smart grid across Australia
● Part Three – A discussion on the potential benefits, barriers and opportunities to implement a smart grid in Australia including the independent conclusions and recommendations from this assessment
● Appendix One – An overview of Australia’s energy sector including the policy, regulatory and investment drivers
● Appendix Two – The cost benefit assessment methodology that AEFI used to complete the cost benefit assessment
● Appendix Three – Tables of results for each of the three macroeconomic scenarios and for each Australian state
3.2
Smart Grid,
Smart City
Information
Clearing House
The Smart Grid, Smart City Information Clearing House (ICH) is a web portal designed to make reports and data from each of the Smart Grid, Smart City projects readily available to registered parties including electricity industry members, governments, individual researchers, suppliers and members of the public. The Smart Grid, Smart City ICH provides registered users with a user-driven online data selection, visualisation and download facilities. The intent is that registered users will be able to download and use the
Smart Grid, Smart City data and research to further their own knowledge and research and in so doing contribute to the global knowledge base of smart grids and associated technologies. In addition users will be able to access a public version of the model used by AEFI in the cost benefit assessment. Registration to the Smart Grid, Smart City ICH is free and available to all members of the community and can be accessed at: https://ich.smartgridsmartcity.com.au/
Context – Australia’s energy market and the Smart Grid, Smart City Program
TheSmart Grid, Smart CityProgram was intended to provide an understanding and, where possible, quantify the costs and benefits of a range of smart grid technologies and products such as dynamic tariffs, in-home displays and web portals.
At the time the Smart Grid, Smart City Program was instigated, Australia had been in a period of year-on-year growth, and in some cases rapid growth, in both electricity consumption and peak demand. Of particular importance, during this period, peak demand growth outstripped consumption growth by a significant amount in some states in Australia. This, combined with the need to replace a significant amount of existing electrical assets which were around 50 years old, resulted in an unprecedented upswing in network investment around Australia. The economy was also in a high growth period, driven by a mining boom and strong demand for Australian raw and processed products both domestically and overseas.
However, over the past four years, the trend of rapid demand growth and high investment has been replaced by a period of lower total demand for grid-sourced electricity and lower growth in total system peak demand. This situation has meant that there are parts of electricity distribution networks where there is excess capacity and similarly in the generation sector, several large baseload power stations have been temporarily or permanently withdrawn from service as a direct result of excess capacity. The reduction in total system demand is a result of a number of drivers including the global financial crisis, reduced manufacturing presence in Australia, improvements in the energy efficiency standards for appliances and buildings, and consumers responding to the increase in electricity prices by modifying behaviour. In addition, over the past few years the deployment of rooftop solar PV systems in Australia has outstripped all government and industry projections. This trend was driven by sharply increasing electricity prices, strong cost reductions in the price of solar PV systems and generous state government feed-in-tariffs (most of which have now been withdrawn).
The Smart Grid, Smart City trials were underway during this unprecedented period of change in the electricity sector and now, amid projections of an economic recovery and a return to a period of low electricity demand growth in the near future, it is timely to consider whether smart grid technologies and products have a role in managing future demand growth and price increases.
The business case assessment is an economic evaluation of the technologies and products trialled in the Smart Grid, Smart City Program. The economic assessment sought to determine:
● Which technologies, customer feedback products and dynamic tariffs, deployed in which combination, over what timeframe could maximise national net economic benefit
● How these benefits are transferred within the electricity system to impact the price of electricity and customer bills
Eight different groups of smart grid technologies, products and tariffs were assessed11 including: ● Fault Detection, Isolation and Restoration (FDIR)
technologies
● Substation and Feeder Monitoring (SFM) technologies
● Active Volt-VAr Control (AVVC) technologies
11 All data inputs and the relevant sources for these inputs are described in the Modelling Inputs Compendium which can be sourced from the Smart
Grid, Smart City Information Clearing House
https://ich.smartgridsmartcity.com.au/
● Dynamic tariffs which included combinations of:
― Voluntary adoption of dynamic tariffs with feedback technologies for some customers
― Mandatory adoption of dynamic tariffs for customers installing distributed generation and distributed storage technologies
― Inclining block tariffs for the remaining customers
― Provision of a smart meter infrastructure for customers on dynamic tariffs
― Smart Meter Infrastructure (SMI)
● Electric Vehicles (EVs)
● Distributed Generation (DG)
● Distributed Storage (DS)
4
Approach to the
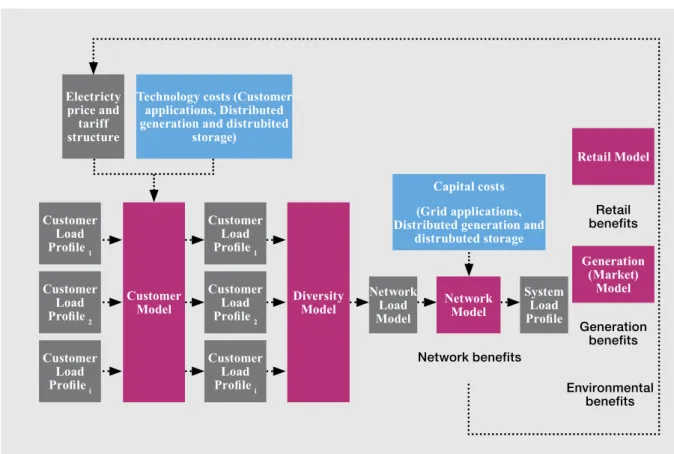
Electricty price and tariff structure Customer Load Profile 1 Customer Load Profile 2 Customer Load Profile i Customer Load Profile 1 Customer Load Profile 2 Customer Load Profile i Network Load Model System Load Profile Diversity
Model Network Model
Retail Model Generation (Market) Model Customer Model Network benefits Retail benefits Generation benefits Environmental benefits
Technology costs (Customer applications, Distributed generation and distrubited
storage)
Capital costs (Grid applications, Distributed generation and
distrubuted storage
A model was developed which allowed the impact of the interactions between customer behaviour and different smart grid and traditional technologies to be quantified. This model sought to replicate the interactions and behaviours within and between different stakeholders in the electricity industry in both the BAU and smart grid cases. These stakeholders include customers, network operators, electricity retailers and electricity generators. This model is known as the integrated benefits modeland is illustrated in Figure 4.
The integrated benefits model was developed for the purpose of assessing the net economic benefit of smart grid technologies. The model was used to assess both individual technologies and an integrated smart grid deployment which includes a combination of technologies.
The integrated benefits model was run for both a business as usual (BAU) and smart grid case at five points in time – 2014, 2019, 2024, 2029 and 2034. The model was also run separately for five states12.
Due to their relatively low numbers, Northern Territory customers were assigned to the Queensland network and ACT customers to the NSW analysis.
The model was also run for three macro-economic scenarios (low, medium and high) to understand the sensitivity of the results to macroeconomic factors. The business case assessment did not provide a financial assessment or business model for individual stakeholders. In fact, for non-grid technologies, the assessment is deliberately agnostic in terms of which market stakeholder would bear the costs or accrue the benefits of smart grid technologies. There is still significant work to be done to understand the right business model for deployment of a number of products to ensure that the full value can be captured.
12 Refer to Appendix Two of the main report which provides a detailed description of the methodology, and Appendix Three which provides the State by State results
The scope of the business case assessment is limited to the electricity system. However, when combined with the Customer Research Survey results this assessment provides a broader perspective of the economic and societal opportunities and challenges for deploying smart grid technologies and dynamic tariffs in Australia.
The technologies and retail products assessed were limited to those trialled as part of the Smart Grid, Smart CityProgram.
The results of the cost benefit assessment are
complex, given the number of smart grid technologies, products and tariffs that were considered throughout the analysis. In addition, state-based results have also been presented within the report. It is therefore recommended that the results presented in this report be read in conjunction with the full methodology contained in Appendix Two and complete results presented in Part Two of the full report.
Throughout the analysis and reporting stages of the
Smart Grid, Smart City cost benefit assessment, a range of stakeholder engagement activities were undertaken. The broad objectives of stakeholder engagement were to ensure:
● Stakeholders understood the scope and objectives of the cost benefit assessment and reporting phase of the Smart Grid, Smart City Program
● Stakeholder priorities for the cost benefit assessment and reporting phase of the Smart Grid, Smart City Program were understood and addressed to the extent practicable
● Stakeholders had an opportunity to validate or provide alternative data and information to inform the cost benefit assessment modelling process
● Identification of other ongoing studies and programs within the electricity sector which could inform or be informed by the analysis and reporting phase of the Smart Grid, Smart City Program.
5.1
Rapid stakeholder
engagement
At the commencement of the analysis and reporting phase (i.e. in 2013), a rapid stakeholder engagement process was undertaken to identify stakeholder priorities. This took the form of web-based and phone-based group and individual interviews. This initial rapid stage was required to quickly identify stakeholders’ expectations for reporting and modelling outcomes. Once identified, stakeholders’ expectations were used to inform the technical models’ structure, as far as practicable.
The rapid engagement phase targeted stakeholders who had already had some involvement with the
Smart Grid, Smart City Program. This allowed a deeper level of engagement across fewer stakeholders than would have otherwise been achieved with stakeholders with limited or no understanding of the program.
5 Stakeholder
Engagement
5.2
Stakeholder forum
Following the rapid engagement process, a stakeholder forum was held on
12 June 2013 with a broader range of stakeholders many of whom had not been previously involved in the program. The aim of the forum was to:
● Present a summary of the results of the first phase of engagement by stakeholder group, and offer opportunity for discussion, update or comment
● Offer the opportunity for diverse stakeholder groups to hear the competing interests in smart grid outcomes, to place their own views in perspective
● To offer broader participation than the initial rapid stakeholder interview phase
5.3 Stakeholder
priorities
In total, a list of 38 stakeholder priorities was identified over the first two stages of stakeholder engagement. Some of the priorities were not able to be addressed as they were not directly related to the business case assessment or the Smart Grid, Smart City Program, but related to broader energy market and consumer issues.
A description of the stakeholder priorities and an indication of where these priorities have been reported on within the various Smart Grid, Smart City
reports, supporting documents and supporting data sets is provided in Section 2.3 in Part Two of the main report. It should be noted that the degree to which these issues are discussed varies across each of the documents (including the Technical Compendia, Customer Research Report and the National Cost Benefit Assessment Report), supporting documents and data sets.
Whilst the majority of stakeholder priorities have been investigated and reported in at least one of the trials (Technical Compendia), other Smart Grid, Smart City
reports, or the cost benefit modelling, there were a small number of priorities which have not been comprehensively investigated. These priorities were not in the original scope (or only partially within the scope) of the Smart Grid, Smart City Program or cost benefit assessment.
In some cases it has been noted that these issues are the subject of a recommendation in this report (refer to Part Three) for further investigations beyond this project.
6.1 Background to
the retail and network
customer trials
As described in Part One of this report and within the Customer Applications Technical Compendium, there were two key trials completed as part of the Smart Grid, Smart City Customer Applications Program:
● A Network Trial which measured the effectiveness of smart meter based products without changing the customer’s retailer or electricity retail tariffs.
● The network trial tested feedback technologies, financial incentives (rebates) and a lifestyle audit. Eight products were offered to customers either individually or as a bundle. The products consisted of an online portal, an in home display, appliance control and sub-metering devices, an interruptible load (air conditioning) control rebate, a dynamic peak rebate and a lifestyle audit.
● A Retail Trial which measured the effectiveness of alternative electricity tariffs either as standalone products or bundled with feedback technologies.
The retail trial tested smart meter based tariffs, feedback technologies and a rebate. In total, twelve products were offered to customers with each product including a tariff (dynamic peak pricing, seasonal time-of-use or top-up plan) or a rebate (interruptible load (air conditioning)) and optionally one or more feedback technologies (an online portal, an in home display or appliance control and sub-metering devices).
As part of investigating the outcomes of the Customer Applications network and retail trials, a Customer Research Survey was commissioned. The key findings and conclusions from this work are summarised in the following section, with the full Customer Research Report available from the Information Clearing House at
https://ich.smartgridsmartcity.com.au.
The impact of the Customer network and retail trial findings on the integrated costs benefit assessment is discussed in Section 6.6 of this Executive Report.
6 Customer interaction –
Smart Grid, Smart City
retail
6.2 The Customer
Research Survey scope
of works
The primary purpose of the Customer Research Survey was to:
● Obtain household profiling data to enable a more accurate depiction of household demographics and energy profiles, and
Analyse the customer experienceof Smart Grid, Smart City trial participants with the smart grid technology and tariff products they were trialling Data collected from the household profiling and customer experience was used to:
● Analyse the efficacy of different smart grid products in delivering real world benefits to customers
● Understand customer perceptions of trialled smart grid products
● Undertake a granular analysis of the customer experience that included consideration of how relevant socio-demographic factors influence customer experience of smart grid products
● Analyse the perceived effects of smart grid products on customers’ ability to control and manage their consumption
● Examine how the product experiences of vulnerable groups differ from the broader population
● Compare survey respondents’ own perceptions of their trial experiences and bill savings with data on total energy savings, peak demand savings and bill savings
Over the two deployment periods in 2013 and 2014, a total of 3,215 trial participant responses were obtained. In addition, 241 control group responses were also received in 2013. All Smart Grid, Smart City
network and trial products were well represented in these survey responses, with between 22 per cent and 53 per cent of participants who trialled a product undertaking the survey.
Two customer research surveys were conducted approximately six months apart. Both surveys were offered to over 8 000 participants in the Smart Grid, Smart City Customer Applications Program. From the 8,000 participants, more than 1,700 participants responded to the initial customer research survey, while almost 2,500 participants responded to the second survey which included almost 1000 respondents from the initial survey.
Data collected from both surveys was pooled to create a sample of 3,215 responses. For participants who answered both surveys, only their latest
responses were included.13
For additional information on which of the different trial participant groups were included in the analysis presented in the Customer Research Survey Report findings, refer to the full report available on the Information Clearing House.
13 To streamline the longer survey for repeat respondents, some of the profiling and energy perspective questions were not asked of these respondents in the 2014 survey. Instead their answers were drawn from their responses to the 2013 survey
6.3
Trial participant
experience survey
results
The following sections provide an overview of some of the key findings from the customer survey focussed on the customer experience in trialling the different combinations of customer feedback technologies and dynamic tariff products within the Smart Grid, Smart City Customer Applications Program.
6.3.1 Feedback technologies –
level of engagement
The Customer Applications Program trialled three types of feedback devices including:
● A home energy monitor (also known as an ‘in-home display’), showing basic live energy consumption and cost data
● An online portal, which showed more detailed information but required computer access
● An online portal paired with a Home Area Network (HAN). The HAN included smart plugs that enabled tracking and remote control of individual appliances
There were diverse results from the respondents when they were asked how often they used their feedback technologies, with the data suggesting a clear advantage of the home energy monitors for capturing user engagement. This was likely due to the lower entry barriers, as the in-home display was in view within the home and did not require a dedicated login. On average user engagement with energy data reduced slightly over time, due to both positive (user learning) and negative (apathy) factors (Figure 5).
A key finding was that 83 per cent of trial participants reported that the use of their customer feedback technology and/or tariff product had resulted in them taking some action to reduce or change the way they consumed electricity.
Three-quarters of respondents reported that the quantity of information provided by the feedback technologies was ‘about right’, while almost one-quarter would have preferred more information. Almost no respondents felt that they were given too much information. Further, the more information provided to customers (through the Portal and the Portal+HAN), the greater the likelihood that they reported that they wanted more.
Monitor (n=1264) Portal (n=673) Portal+HAN (n=239) 0% 20% 40% 60% 80% 100% 31% 13% 5% 19% 11% 21% 21% 19% 23% 27% 13% 12% 7% 8% 11% 7% 31% 22%
Daily 2-3 times per week Weekly Every now and then Once / twice Never