Discussion Papers No. 468, August 2006 Statistics Norway, Research Department
Suzan Hol and Nico van der Wijst
The financing structure of
non-listed firms
Abstract:
This paper presents an analysis of how Norwegian non-listed firms are financed. Using a unique database covering all limited liability firms in Norway, both the size (leverage) and composition (maturity structure) of debt are investigated. The empirical evidence provides support for the effects of taxes, asymmetric information and size suggested in the theoretical literature, and rejects the effects of agency costs and the pecking order theory.
Keywords: financing structure; non-listed firms; debt maturity; panel data JEL classification: classification: G32, D92
Acknowledgement: The authors would like to thank an anynomous referee and the participants of the 29th EuroWorking Group on Financial Modeling conference in Haarlem who read an earlier version of this paper for valuable comments.
Address: Suzan Hol,, Statistics Norway, Research Department. E-mail: sua @ssb.no
Nico van der Wijst, Department of Industrial Economics and Technology Management, Norwegian University of Science and Technology. E-mail: [email protected]
Discussion Papers comprise research papers intended for international journals or books. A preprint of a Discussion Paper may be longer and more elaborate than a standard journal article, as it may include intermediate calculations and background material etc.
Abstracts with downloadable Discussion Papers in PDF are available on the Internet:
http://www.ssb.no
http://ideas.repec.org/s/ssb/dispap.html For printed Discussion Papers contact: Statistics Norway
Sales- and subscription service NO-2225 Kongsvinger
I. INTRODUCTION
Only a very small minority of European firms is listed on a stock ex-change. In Norway, for example, some 200-250 (231 on July 6th, 2006) of the more than 100,000 limited liability firms are quoted on Oslo Stock Ex-change. In spite of their overwhelming numerical majority, unlisted firms receive little attention in empirical studies of financial structure. Since pub-lication requirements for unlisted firms usually are minimal or absent, the non-availability of data can partly explain this lack of attention. In Norway, however, all limited liability firms are required by law to deposit their an-nual financial statements in a central register, which is open to researchers. Given the diversity within the business community and the variety of capital structure theories, analyzing the way firms are financed can clearly benefit from using a large database covering the entire population.
Using this unique database, this paper studies thefinancial structure of non-listed firms. This can be an important addition to the literature, since the empirical evidence on the determinants of financing decisions predomi-nantly refers to the single, albeit large, environment of American listedfirms. Testing the empirical implications of capital structure theories on unlisted
firms that operate in a differentfinancial environment contributes to the em-pirical evidence and may broaden insight into the capital structure choice. Few studies of the capital structure of European companies have been pub-lished (e.g. Carlsen and Nilsen, 1993; Demirgüç-Kunt and Maksimovic,1999; Ozkan, 2002) and even fewer of non-listed companies (e.g. Scherr and Hul-burt, 2001).
for this paper. More specifically, the objective of this paper is to supplement the existing literature with an analysis of the factors determining thefinancial structure of non-listed firms in Norway. This is done by empirically testing theories of capital structure and debt maturity using panel data for
non-financial firms. A data set that includes all unlisted firms in Norway for 1995-2000 is used. Scherr and Hulburt (2001) who also analyzed unlisted
firms used a much smaller selection for 1987 and 1993 in the United States. To our knowledge, the financing decisions for non-listed firms has not been analyzed on such a large scale before.
The next section provides an explanation of the different theories regard-ing the financing of firms, as well as the results of some previous empirical papers. Section 3 presents the data and the empirical proxies used in this paper. Section 4 reports on the empirical analyses and the last section, 5, concludes.
II. FINANCING DECISIONS AND EMPIRICAL STUDIES
Theories of capital structure and debt maturity
The origins of capital structure theory lie in the models of optimal capital structure that were developed in the wake of the famous Modigliani-Miller irrelevance theorem. These models later became know as the static trade-off theory (see e.g. Modigliani and Miller (1958, 1963), Baxter (1967), Gor-don (1971), Kraus and Litzenberger (1973), Scott (1976, 1977), Kim (1978), Vinso (1979), and Scott (1981)). In this theory, the combination of leverage related costs (associated with e.g. bankruptcy and agency relations) and a tax advantage of debt produces an optimal capital structure at less than a
100% debtfinancing, as the tax advantage is traded offagainst the likelihood of incurring the costs. This theoretical result is now widely accepted in the profession.
To a large extent, theories of debt maturity are based on the same mar-ket imperfections that are modelled in theories of optimal capital structure. Although the extension of capital structure models with different debt cat-egories seems obvious, the composition of corporate debt did not attract much academic interest until the 1980’s. Since then, several different theo-ries of debt maturity choice have been formulated. These theotheo-ries typically model the effect of thefinancial environment on debt maturity, whereby the
financial environment is expressed in cashflow characteristics and the above mentioned market imperfections.
Brick and Ravid (1985) show that taxes can also imply an optimal debt maturity structure. Depending on the term-structure of interest rates, long-term (short-long-term) debt is optimal, since it accelerates the tax benefit of debt given an increasing (decreasing) term structure. DeAngelo and Masulis (1980) argue that the expected tax advantage of debt is decreased by depre-ciation charges (and other non-debt tax shields) that are a substitute for the tax benefits of interest payments. The combined implication for debt matu-rity structure is that firms with large non-debt tax shields have an incentive to take on more debt and lengthen the maturity of debt to make sure that the remaining tax advantage is not less than the costs of issuing new short-term debt.
Whenfirms cannot reveal the true quality of their cash flows, i.e. when information asymmetry exists, they can prevent or abate undervaluation by
using a variety of signaling devices, such as debt (leverage), dividend pay-ments or the maturity structure of debt. In the presence of information asymmetry, firms have an incentive to signal their quality and credibility by taking on more debt and shortening their debt maturity1. A higher
lever-age, especially more short-term debt, signals favorable inside information to the market because it offers the possibility to renegotiate terms in the fu-ture, when more information has become available. Long-term debt entails larger information costs than short-term debt, because the market expects a higher deterioration of quality than insiders do. Firms with a low level of information asymmetry are therefore more likely to issue long-term debt (Flannery, 1986). Information asymmetry is higher forfirms with large R&D activities (Alam and Walton, 1995). In addition, a complex legal structure (e.g. a holding company or large cross investments in daughter companies) will make a firm less transparent and, thus, give rise to a higher level of information asymmetry.
A rivaling capital structure theory is Myers’ pecking order theory. This theory is based on information asymmetry which causes outside financing to be more expensive than internal financing. This information asymmetry is modelled by Myers (1984) and Myers and Majluf (1984). They argue that asymmetric information lowers the price that investors are willing to pay for issued shares. Therefore, firms prefer internal to external financing to fund investments, and debt to equity if external financing is used. If no, or not enough, retained earnings are available in the firm, debt will be issued. Debt 1This assumes that issuing costs are not too high and that the liquidity risk and the interest rate uncertainty are taken into account.
is less mispriced than equity, since it has a prior claim to equity. Issuing new equity is the last choice of firms raising capital. In this pecking order theory, as Myers calls it, observed debt ratios will reflect the cumulative requirement for externalfinancing which is inversely related to the cumulative profitability (Myers, 1984). Short-term debt is less sensitive to mispricing than long-term debt. Therefore short-term debt should be exhausted before the firm issues long-term debt. It should be noted, however, that Jensen’s (1986) free cash flow theory, which is based on conflicts of interest between management and stockholders, predicts the opposite, i.e. a positive relation between profitability and debt ratio. Free cash flow can be defined as cash
flow in excess of the funds required to finance positive net present value projects. When profit levels are high, management may be enticed to use the free cash flow on perquisites or negative net present value investments. An increase in the level of debt forces the managers to pay out cash and thus reduces the free cash flow.
Firms with risky debt and large future growth opportunities are espe-cially prone to incur the agency costs that can arise from conflicts of interest between different stakeholders. In thesefirms, shareholders have an incentive to choose investment strategies that are suboptimal for the firm as a whole. These strategies, characterized as asset substitution (Jensen and Meckling, 1976) and underinvestment (Myers, 1977), are beneficial to the shareholders because they transfer wealth from the bondholders to the shareholders or prevent a transfer in the opposite direction. Rational bondholders will antic-ipate these strategies and protect themselves by adjusting their terms. The resulting decrease infirm value is an agency cost of debt. More debt increases
agency costs. Furthermore, Barnea, Haugen and Senbet (1980) showed that issuing short-term debt mitigates these costs, since short-term debt reduces managerial flexibility by offering frequent renegotiation possibilities.
Myers (1977) reasons that by matching the maturities of debt and assets, debt repayments are scheduled to correspond with the decline in value of assets currently in place. This matching reduces the agency costs of debt. Stohs and Mauer (1996) contend that a debt maturity shorter than the asset’s life will increase the risk of default, since not enough cash may be available when the debt is due. When the maturity of debt is longer than the life of the assets, the firm may encounter problems finding new assets to support the debt. An extensive survey of the theories concerning capital structure can be found in Harris and Raviv (1991), and for debt maturity structure and their empirical tests in Ravid (1996).
Empirical studies
Few studies have analyzed the financing decisions of small, non-listed
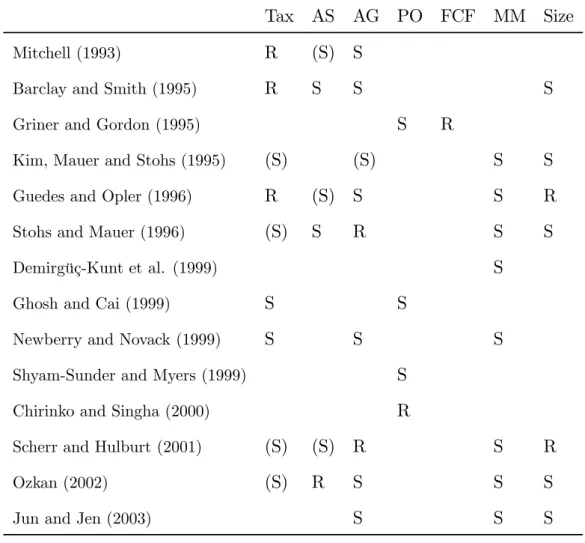
firms. Scherr and Hulburt found strong support for the maturity matching principle, weak support for the effects of taxes and information asymmetry, while they rejected the effects of agency theory and size. To compare the results of this study with the literature, which is dominated by listed firms in large countries as the United States, we also provide an overview of those empirical studies in Table 1. Demirgüç-Kunt and Maksimovic (1999) and Ozkan (2002) give results for non-American data, but also use listed firms.
As will be evident from Table 1, only the maturity matching principle is supported in all studies. There is no univocal support for or rejection of
any of the theories and the size effect. Newberry and Novack (1999), which specifically tests the tax theory, supports this theory. Otherwise, the tax effect is usually rejected or weakly supported for the capital structure and debt maturity structure. Shyam-Sunder and Myers (1999) found the pecking order theory to provide an adequate description of the capital structure of
firms. However, Chirinko and Singha (2000) argue that there are serious difficulties2 with Shyam-Sunder and Myers’ models. They conclude that
alternative tests are needed to identify the determinants of capital structure. Ghosh and Cai (1999) find evidence for both the trade-off theory and the pecking order theory and suggest both models can coexist. The empirical support for agency effects, asymmetric information/signaling effects, and size effects is also mixed.
III. DESCRIPTION OF DATA AND PROXY VARIABLES
Data
The database contains standardized yearly accounting data of all Nor-wegian limited liability firms throughout the period 1995-2000. The total number of thesefirms increases from slightly over 100,000 in 1995 to around 130,000 in the year 2000. Including such a large number of firms directly in the analysis is not a sound research design for at least two reasons. First, since the database contains the entire population offirms, repeated use would lead to data snooping. Second, any population of registered firms is likely 2The test used by Shyam-Sunder and Myers (1999) is based on the pecking order’s prediction that a large variation in debt is explained by deficits. The test will reject the pecking order hypothesis incorrectly when a firm has a financial structure consistent with the pecking order theory, but uses mostly equity in externalfinancing (Chirinko and Singha, 2000).
to contain some non-operative firms, which are established or maintained for e.g. tax advantages only. We use two samples from the database for our analysis and limit the analysis to the population of non-financialfirms. Ob-servations for financial firms, such as banks, are not used. First, a random sample of 4,500firms is extracted, around 5 percent of the total population. To exclude non-operative companies, companies with total assets or total sales less than 100,000 Norwegian kroner (approximately $15,000) are ex-cluded from this sample. Furthermore, all firms with a negative book value of equity are deleted. Small firms with negative equity are usually financed by personal guarantees of their owner and the personal financing of firms is not the subject of the theories investigated here. This reduces the sample to 2,875 non-financial unlisted companies for which a financial statement was available for each year of the period, yielding a total number of observations3
of 14,375. To verify that this sample of 2,875 firms represents the entire population, a second random sample is extracted with the same selection process. This resulted in 2,787 firms, none of which are included in the first sample. Some descriptive statistics of the samples are given in Table 2. As can be seen from Table 2, both samples cover a wide range offirm sizes, from total asset sizes just over 100,000 kroner to over 3 resp. 9 billion (109) kroner.
However, the averages of the two samples are quite close. The sectors defined in the data sets can be found in Table 5 in the appendix.
Capital structure is measured as the ratio of debt to total assets. Since 3For both samples one year of observations is used to compute the growth of sales or the change in earnings. Some extreme outliers (0.1 percent extremes of the observations) are deleted from the dataset prior to estimation. This results in 14,357firm-year observations for thefirst random sample and 13,910 for the second sample.
the database consists of accounting data, all values are book values. No di-rect measure of debt maturity is available in the data, but the amounts of long-term debt and short-term debt are registered. In Norwegian balance sheets, the division between short-term and long-term debt is set at one year maturity. Consequently, there are two alternative ways to analyze debt ma-turity in these data. Thefirst is to use some ratio of long-term to short-term debt. The second is to estimate separate relations for long-term debt and short-term debt. We use the second option. An advantage of this indirect estimation method is that effects on long-term and short-term debt will not cancel out. This gives the opportunity to determine whether the factors that influence short-term debt differ from those that determine long-term debt. Since an identical, linear specification is used for long and short term debt, the effects on total leverage are simply the sum of the effects on both debt categories. For convenience, a (superfluous) separate analysis of total debt is also provided.
Proxy variables
The empirical model is constructed to reflect, as far as the data will allow, the theoretical determinants of capital structure and debt maturity structure discussed in section 2. The dependent variables in this study are the ratios of short-term debt, long-term debt and total debt to total assets. We use a measure for all variables that is unaffected by the level of trade credit, since trade credit is likely to be jointly influenced by factors that are specific to each industry (Rajan and Zingales, 1995). Accounts payable and accounts receivable are thus subtracted from debt and assets.
Although the Norwegian tax system has been changed many times, it still offers the possibility to deduct interest payments from taxable income. However, this incentive to prefer debt over equity has become smaller over the years. According to Bøhren and Michalsen (2001, p. 261) the tax ad-vantage of debt changed from 0.75 per Norwegian kroner in 1980 to 0.28 in 1993. Following this period the tax system remained stable until 2000, which includes our observation period. To test the effect of taxes on debt maturity we use depreciation charges, the substitute variable suggested by DeAngelo and Masulis (1980). The empirical proxy is the ratio of depreciation charges to total costs, used earlier by Van der Wijst and Thurik (1993). As non-debt tax shields give firms an incentive to take on more debt, as well as to lengthen the maturity of debt, the hypothesis is a positive relation between the depreciation charges and leverage and long-term debt, and a negative relation with short-term debt.
In presence of information asymmetry, the change in earnings per share can be regarded as a signal of the insiders’ expected change in firm quality (Barclay and Smith, 1995, and Stohs and Mauer, 1996). Earnings per share is, however, only available for listed firms. For the non-listed firms in this paper, information asymmetry is proxied by the amount of cross-investments in daughter companies relative to total assets. These investments make a
firm less transparent, which is hypothesized to be associated with less debt, relatively high short-term debt, and relative less long-term debt.
Following Scherr and Hulburt (2001) growth of sales is used as a proxy for agency problems of debt for the non-listedfirms, since again the standard proxy in the literature, book-to-market value, is not available. This implicitly
assumes that past growth is an indicator for future growth. The empirical implication is that more growth is associated with less leverage, more short-term debt and less long-short-term debt.
Profitability is used as a proxy variable when testing the pecking order theory (Wald, 1999). A negative relation is expected between profits (mea-sured as return on assets) and all forms of leverage. Short-term debt is higher on the pecking order as it is less sensitive to mispricing than long-term debt. Therefore, its estimated coefficient should be lower than the coefficient of long-term debt. Notice that, as profits are a prerequisite forfirms to use the tax shield of debt, the trade-off theory expects a positive relation between profit and both short-term and long-term debt. Furthermore, Jensen’s (1986) free cashflow theory also expects a positive relation between profit and debt, as the latter is used as a disciplinary instrument at high free cashflow levels. The maturity matching principle is empirically tested with the maturity of assets, measured by the ratio of current to total assets (in book values). The hypothesis is a positive relation between this ratio and short-term debt and a negative relation with long-term debt.
In addition to the proxies reflecting the different capital structure and debt maturity theories,firm size is often included in empirical studies, as Ta-ble 1 shows. Most studies argue for a positive relation betweenfirm size and debt maturity. The arguments used are that large firms have: (1) economies of scale in issuing long-term debt (Barclay and Smith, 1995), (2) better ac-cess to capital markets (Ozkan, 2002), (3) fewer growth opportunities (Kim, Mauer and Stohs, 1995), (4) a higher credit quality (Guedes and Opler, 1996), (5) more possibilities to publish information about themselves (Scherr and
Hulburt, 2001), and, finally, (6) more collateral (Ozkan, 2002). We include size as measured by the logarithm of the book value of total assets. Most of these arguments also suggest a positive relation between size and total lever-age. Combined this means that a positive effect of firm size on long-term debt is expected, and that this effect outweighs the smaller or negative effect on short-term debt.
Finally, Harris and Raviv (1991) argue thatfirms within an industry are more similar than those in different industries are. An industry effect will be measured by industry (or sector) dummies. Adding dummies in the regres-sion helps avoiding correlation among residuals. To avoid perfect correlation with the dummies, the intercept is excluded from the regressions.
IV. RESULTS
The proxy variables discussed in the previous section are included infi xed-effects panel data regressions for both samples, with leverage, short-term debt and long-term debt, in the given definitions, as dependent variables. The resulting estimates for the 2,875 non-listedfirms in thefirst sample and the 2,878 non-listedfirms in the second sample are presented in Tables 3 and 4, respectively.
Tables 3 and 4 show that the tax hypothesis is supported for allfinancing decisions in the non-listed firms. All estimated coefficients of the non-debt tax shield have the hypothesized sign and are significantly different from zero. Leverage and debt maturity appears indeed to be positively related to the size of non-debt tax shields. These findings are similar to Newberry and Novack (1999) and in contrast with Barclay and Smith (1995) and Guedes
and Opler (1996).
The hypothesized effect of information asymmetry is not supported for the capital structure, and only partly for the maturity structure. For thefirst random sample, only the coefficient of the proxy variable for long-term debt is significantly different from zero in the hypothesized (negative) direction. For the second random sample the hypothesis is supported. The corresponding coefficient of short term debt is not significant, so the non-listedfirms appear indeed to shorten debt maturity to curtail information asymmetry problems, but not to change the level of leverage. This evidence is consistent with Ozkan (2002), who does not find support for an asymmetric information effect for listed firms in the UK. However, the evidence conflicts with Barclay and Smith’s (1995) finding of a significantly negative relationship between debt maturity and change in earnings for firms in the US.
The hypothesized effect of agency costs for all financing decisions is ei-ther significant with the incorrect sign or not significant. The agency cost hypothesis is thus rejected. These results are consistent with the findings of Scherr and Hulburt (2001), who rejects the agency effect for small, mostly unlisted, firms in the US. However, the evidence is in contrast with Ozkan (2002), who finds support for the agency cost theory for listed firms in the UK.
Little support is found for the prediction from the pecking order theory that profitability is inversely related to total debt, because the negative effect on long term debt dominates. The coefficient of return on assets is positive for short-term debt and negative for long-term debt and (highly) significant in both cases. The combined effect is a shortening of debt maturity, as the
pecking order theory predicts, but the effect on total leverage is positive, rejecting the pecking order theory. The positive effect on short-term debt clearly dominates the negative effect on long-term debt.
The hypothesis thatfirms match the maturity of their debt and assets is supported by the empirical analysis. The coefficients of the ratio of current-to-total assets all have the hypothesized signs and are (highly) significant. As the negative coefficient for short-term debt is larger than the positive coefficient for long-term debt, an increase in asset maturity is mainlyfinanced with short-term debt. This evidence is in line with the previous empirical studies, all of which support the maturity matching principle (see Table 1).
The size effect is supported for debt maturity analysis. Short-term debt decreases and long-term debt increases with size, and both significantly so. Debt maturity increases with size for thesefirms. This is in line with Titman and Wessels (1988), where short-term debt is found to be negatively related to firm size, but not in line with the rejection of a size effect for unlisted
firms in Scherr and Hulburt (2001). This conflicts with the support for a size effect for listed firms in Kim, Mauer and Stohs (1995) and Jun and Jen (2003). The effect on total leverage is negative: the use of debt diminishes with size.
The coefficients in both analyses do not differ in sign and (with only one exception) significance and their numerical values are comparable This underlines the robustness of the results across the two different samples.
The coefficients of the industry dummies are all of the same order of magnitude, see Table 6 in the appendix. So no industry specific effects on the determination of the maturity structure of debt are found in the data.
V. CONCLUSIONS
The purpose of this paper is to supplement the existing literature with an analysis of the factors determining thefinancial structure of non-listedfirms. The database used covers all limited liability firms in Norway. The analyses give rise to the following conclusions.
First, taxes and the maturity matching principle appear to be the most important determinants of the financing decision for non-listedfirms in Nor-way. In two random samples, leverage and debt maturity are seen to increase with the size of non-debt tax shields and with the maturity of the firms’ as-sets. The latter, i.e. support for the maturity matching principle, is in line with practically all empirical studies of debt maturity. The former, i.e. sup-port for a tax effect, is much less common in the existing literature. Perhaps using data for the non-listed firms contributes to this result.
Second, size and information asymmetry are found to be additional de-terminants of the financial structure for non-listed firms. For these firms, debt maturity increases with size and decreases with cross investments in daughter companies that makefirms less transparent. The results are robust as the same conclusions are reached for a second random sample of unlisted
firms.
Third, the hypotheses that were formulated on the basis of the pecking order theory and agency theory are rejected for the non-listed firms. Prof-itability appears to be positively, rather than negatively, related to debt. Similarly, sales growth is not found to be associated with a shorter debt maturity, as agency theory predicts, but with a longer maturity.
apart from most of the literature. The support for the maturity matching principle is a common element with the empirical literature. Support for the other hypotheses is mixed and, as such, not essentially different from that in most of the literature.
Finally, and in line with the arguments of Mikkelson (1984), we can con-clude that the analysis of corporate capital structure can be strengthened by incorporating more characteristics of firms’ claims structures, such as debt maturity structure. A similar conclusion is presented in Bevan and Danbolt (2002) who state that an analysis of capital structure is incomplete without a detailed examination of all forms of corporate debt. Determinants may have different effects on different debt categories and if this occurs, the effects will be diminished or obscured if the analysis is restricted to total debt. This is clearly the case in this paper: more often than not, the empirical proxy variables have opposite effects on the two debt categories distinguished here.
APPENDIX
Table 1. Overview of empirical studies on capital structure and debt maturity
Tax AS AG PO FCF MM Size
Mitchell (1993) R (S) S
Barclay and Smith (1995) R S S S
Griner and Gordon (1995) S R
Kim, Mauer and Stohs (1995) (S) (S) S S
Guedes and Opler (1996) R (S) S S R
Stohs and Mauer (1996) (S) S R S S
Demirgüç-Kunt et al. (1999) S
Ghosh and Cai (1999) S S
Newberry and Novack (1999) S S S
Shyam-Sunder and Myers (1999) S
Chirinko and Singha (2000) R
Scherr and Hulburt (2001) (S) (S) R S R
Ozkan (2002) (S) R S S S
Jun and Jen (2003) S S S
Notes: S = support, correct sign and significant, (S) = weak support, correct sign, but insignificant, R = rejected, no support. AS = asymmetric informa-tion/signaling, AG = agency cost, PO = pecking order, FCF = free cash flow, MM = maturity matching principle.
Table 2: Descriptive statistics of the two samples used sample 1 mean std.dev min max total assets 18311 114264 101 3935087 depreciation 0.083 0.199 -3.57 2.12 investm. daughter 0.0057 0.046 0 0.97 growth of sales 0.163 1.553 -1.00 136.66 return on assets 0.174 0.253 -3.66 5.22 CA/TA 0.609 0.306 -0.08 1.1 ln (BV TA) 7.91 1.54 2.3 15.19 sample 2 mean std.dev min max total assets 25763 218358 101 9307000 depreciation 0.080 0.189 -1.17 2.80 investm. daughter 0.0061 0.047 -0.01 0.97 growth of sales 0.135 1.479 -0.99 101 return on assets 0.1553 0.235 -4.64 5.09 CA/TA 0.607 0.301 -0.03 1.24 ln (BV TA) 8.05 1.573 3.09 16.04
Table 3. Estimates fromfixed-effects regression analysis from 1st random sample TD Exp. STD Exp. LTD sign sign depreciation/costs -0.14* - -0.30* + 0.16* (-7.68) (-17.71) (14.35) investments in -0.09 + 0.10 - -0.19* daughter companies (-1.36) ( 1.67) (-4.90) growth of sales 3.33·10−3 + 0.90·10−3 - 2.43·10−3* (1.66) (0.49) (2.05) return on assets 0.42* +/- 0.52* +/- -0.10* (31.58) (42.73) (-12.50) current assets / TA -0.21* + 0.21* - -0.42* (-17.28) (19.41) (-59.38) ln (TA) -0.03* - -0.05* + 0.01* (-16.96) (-24.68) (9.38) R2 0.79 0.70 0.60 no.obs. 14,357
Notes: STD = short-term debt, LTD = long-term debt, TA = total assets.R2
= adjusted R-squared. t-statistics in parentheses. * Significant at 5 percent level.
Table 4. Estimates fromfixed-effects regression analysis from 2nd random sample TD Exp. STD Exp. LTD sign sign depreciation/costs -0.14* - -0.23* + 0.09* (-7.88) (-13.83) (8.33) investments in -0.005 + 0.25* - -0.26* daughter companies (-0.07) ( 4.03) (-6.35) growth of sales 4.90·10−3* + 2.48·10−3 - 2.41·10−3* (2.51) (1.37) (2.05) return on assets 0.43* +/- 0.52 +/- -0.09* (34.80) (45.00) (-11.95) current assets / TA -0.18* + 0.25* - -0.43* (-14.83) (22.23) (-58.95) ln (TA) -0.04* - - 0.05* + 0.01* (-18.64) (-26.55) (10.19) R2 0.80 0.71 0.60 no.obs. 13,910 13,910 13,910
Notes: STD = short-term debt, LTD = long-term debt, TA = total assets. R2
Table 5. Description of the sectors in the Dun and Bradstreet database NACEcode Sector
1 Mining industry 2 Miscellaneous industry
3 Production of electrical and optical products, production of transportation vehicles and other 4 Power and water supply, building and
construction operations
5 Trading of goods, repairing of vehicles and working with domestic appliances, hotels and restaurants 7 Management of properties, business services and
rental businesses, public administration 8 Education and healthcare
9 Miscellaneous services, paid housework, international organs and organizations
Table 6. Estimates of the sector dummies TD STD LTD TD STD LTD 1st 2nd sector 1 1.05* 0.65* 0.40* 1.06* 0.67* 0.39* sector 2 1.01* 0.64* 0.37* 1.05* 0.67* 0.37* sector 3 1.07* 0.67* 0.40* 1.07* 0.67* 0.40* sector 4 1.12* 0.74* 0.38* 1.11* 0.76* 0.36* sector 5 0.99* 0.59* 0.40* 1.01* 0.60* 0.41* sector 7 1.05* 0.70* 0.35* 1.09* 0.72* 0.37* sector 8 0.95* 0.61* 0.34* 0.98* 0.63* 0.36* sector 9 0.96* 0.60* 0.35* 0.96* 0.61* 0.35* F-test 31.19* 51.82* 20.32* 29.04* 58.44* 16.13*
Notes: Sample with unlisted firms for the first and second random sample. STD = short-term debt, LTD = long-term debt, TA = total assets. F-test for the hypothesis that all the sector dummies are equal. t-statistics in parentheses. * significant at 5 percent.
References
Alam, P. and Walton, K. (1995) Information asymmetry and valuation effects of debt financing, Financial Review, 30, 289-311.
Barclay, M. and Smith, C. (1995) The maturity structure of corporate debt, Journal of Finance, 50, 609-631.
Barnea, A., Haugen, R. and Senbet, L. (1980) A rationale for debt maturity structure and call provisions in the agency theoretic framework, Journal of Finance, 35, 1223-1234.
Baxter, N. D. (1967) Leverage, the Risk of Ruin and the Cost of Capital, Journal of Finance 22 (3), 395-403.
Bevan, A. and Danbolt, J. (2002) Capital structure and its determinants in the UK - Decompositional analysis, Applied Financial Economics, 12, 159-170.
Brick, I. and Ravid, A. (1985) On the relevance of debt maturity structure, Journal of Finance, 40, 1423-1437.
Bøhren, Ø. and Michalsen, D. (2001), Finansiell økonomi: Teori og praksis (Financial economics: theory and practise), Skarvet Forlag, Gjøvik.
Carlsen, F. and Nilsen, Ø. (1993) En empirisk analyse av norske bedrifters gjeldsandel (An empirical analysis of Norwegian firm’s debt), Scandinavian Journal of Business Beta, 2, 1-13.
Chirinko, R. and Singha, A. (2000) Testing static trade-off against pecking order models of capital structure: A critical comment, Journal of Financial Economics, 58, 417-425.
DeAngelo, H. and Masulis, R. (1980) Optimal capital structure under cor-porate and personal taxation, Journal of Financial Economics, 8, 3-29.
Demirgüç-Kunt, A. and Maksimovic, V. (1999) Institutions, financial mar-kets, andfirm debt maturity, Journal of Financial Economics, 54, 295-336. Flannery, M. (1986), Asymmetric information and risky debt maturity choice, Journal of Finance, 41, 19-37.
Gordon, M. (1971) Towards a Theory of Financial Distress, Journal of Fi-nance 26 (2), 347-356.
Gosh, A. and Cai, F. (1999), Capital structure: New evidence of optimality and pecking order theory, American Business Review, 17, 32-38.
Griner, E. and Gordon, L. (1995) Internal cash flow, insider ownership, and capital expenditures: A test of the pecking order theory and managerial hypothesis, Journal of Business Finance and Accounting, 22, 179-198
Guedes, J. and Opler, T. (1996) The determinants of the maturity of corpo-rate debt issues, Journal of Finance, 51, 1809-1833.
Harris, M. and Raviv, A. (1991) The theory of capital structure, Journal of Finance, 46, 297-355.
Jensen, M. (1986) Agency costs of free cash flow, corporate finance, and takeovers, American Economic Review, 76, 323-329.
Jensen, M. and Meckling, W. (1976) Theory of the firm: Managerial behav-ior, agency costs, and ownership structure, Journal of Financial Economics, 3, 305-360.
Jun, S. and Jen, F. (2003) Trade-offmodel of debt maturity structure, Review of Quantitative Finance and Accounting, 20, 5-35.
Kim, E. (1978) A Mean-Variance Theory of Optimal Capital Structure and Corporate Debt Capacity, Journal of Finance 23 (1), 45-63.
investor tax-timing options: Theory and evidence, Financial Management, 24, 33-45.
Kraus, A. and Litzenberger, R. (1973) State Preference Model of Optimal Leverage, Journal of Finance 28 (4), 911-922.
Mikkelson, W. (1984) On the existence of an optimal capital structure: The-ory and evidence: Discussion, Journal of Finance, 39, 878-880.
Mitchell, K. (1993) The debt maturity choice: An empirical investigation, Journal of Financial Research, 16, 309-320.
Modigliani, F. and Miller, M. (1958) The cost of capital, corporationfinance and the theory of investment, American Economic Review, 48, 261-297. Modigliani, F. and Miller, M. (1963) Corporate income taxes and the cost of capital: A correction, American Economic Review, 53, 433-443.
Myers, S. (1977) Determinants of corporate borrowing, Journal of Financial Economics, 5, 147-175.
Myers, S. (1984) The capital structure puzzle, Journal of Finance, 39, 575-592.
Myers, S. and Majluf, N. (1984) Corporatefinancing and investment decisions whenfirms have information that investors do not have, Journal of Financial Economics, 13, 187-221.
Newberry, K. and Novack, G. (1999) The effect of taxes on corporate debt maturity decisions: An analysis of public and private bond offerings, Journal of the American Taxation Association, 21, 1-16.
Ozkan, A. (2002) The determinants of corporate debt maturity: Evidence from UKfirms, Applied Financial Economics, 12, 19-24.
Some evidence from international data, Journal of Finance, 50, 1421-1460. Ravid, A. (1996) Debt maturity - a survey, Financial Markets, Institutions and Instruments, 5, 1-69.
Scherr, F. and Hulburt, H. (2001) The debt maturity structure of smallfirms, Financial Management, 30, 85-111.
Scott, J. (1976) A Theory of Optimal Capital Structure, Bell Journal of Economics 7 (1), 33-54.
Scott, J. (1977) Bankruptcy, Secured Debt, and Optimal Capital Structure, Journal of Finance 32 (1), 1-19.
Scott, J. (1981) The Probability of Bankruptcy, a Comparison of Empirical Predictions and Theoretical Models, Journal of Banking and Finance 5, 317-344.
Shyam-Sunder, L. and Myers, S. (1999) Testing static trade-offagainst peck-ing order models of capital structure, Journal of Financial Economics, 51, 219-244.
Stohs, M. and Mauer, D. (1996) The determinants of corporate debt maturity structure, Journal of Business, 69, 279-312.
Titman, S. and Wessels, R. (1988) The determinants of capital structure choice, Journal of Finance, 43, 1-19.
Van der Wijst, N. and Thurik, R. (1993) Determinants of small firm debt ratios: An analysis of retail panel data, Small Business Economics, 5, 55-65. Vinso, J. (1979) A Determination of the Risk of Ruin, Journal of Financial and Quantitative Analysis 14 (1), 77-100.
Wald, J. (1999) How firm characteristics affect capital structure: An inter-national comparison, Journal of Financial Research, 22, 161-187.
Recent publications in the series Discussion Papers
376 B.J. Holtsmark and K.H. Alfsen (2004): Implementation of the Kyoto Protocol without Russian participation 377 E. Røed Larsen (2004): Escaping the Resource Curse and
the Dutch Disease? When and Why Norway Caught up with and Forged ahead of Its Neughbors
378 L. Andreassen (2004): Mortality, fertility and old age care in a two-sex growth model
379 E. Lund Sagen and F. R. Aune (2004): The Future European Natural Gas Market - are lower gas prices attainable?
380 A. Langørgen and D. Rønningen (2004): Local government preferences, individual needs, and the allocation of social assistance
381 K. Telle (2004): Effects of inspections on plants' regulatory and environmental performance - evidence from Norwegian manufacturing industries
382 T. A. Galloway (2004): To What Extent Is a Transition into Employment Associated with an Exit from Poverty 383 J. F. Bjørnstad and E.Ytterstad (2004): Two-Stage
Sampling from a Prediction Point of View 384 A. Bruvoll and T. Fæhn (2004): Transboundary
environmental policy effects: Markets and emission leakages
385 P.V. Hansen and L. Lindholt (2004): The market power of OPEC 1973-2001
386 N. Keilman and D. Q. Pham (2004): Empirical errors and predicted errors in fertility, mortality and migration forecasts in the European Economic Area
387 G. H. Bjertnæs and T. Fæhn (2004): Energy Taxation in a Small, Open Economy: Efficiency Gains under Political Restraints
388 J.K. Dagsvik and S. Strøm (2004): Sectoral Labor Supply, Choice Restrictions and Functional Form 389 B. Halvorsen (2004): Effects of norms, warm-glow and
time use on household recycling
390 I. Aslaksen and T. Synnestvedt (2004): Are the Dixit-Pindyck and the Arrow-Fisher-Henry-Hanemann Option Values Equivalent?
391 G. H. Bjønnes, D. Rime and H. O.Aa. Solheim (2004): Liquidity provision in the overnight foreign exchange market
392 T. Åvitsland and J. Aasness (2004): Combining CGE and microsimulation models: Effects on equality of VAT reforms
393 M. Greaker and Eirik. Sagen (2004): Explaining experience curves for LNG liquefaction costs: Competition matter more than learning
394 K. Telle, I. Aslaksen and T. Synnestvedt (2004): "It pays to be green" - a premature conclusion?
395 T. Harding, H. O. Aa. Solheim and A. Benedictow (2004). House ownership and taxes
396 E. Holmøy and B. Strøm (2004): The Social Cost of Government Spending in an Economy with Large Tax Distortions: A CGE Decomposition for Norway 397 T. Hægeland, O. Raaum and K.G. Salvanes (2004): Pupil
achievement, school resources and family background 398 I. Aslaksen, B. Natvig and I. Nordal (2004):
Environmental risk and the precautionary principle: “Late lessons from early warnings” applied to genetically modified plants
399 J. Møen (2004): When subsidized R&D-firms fail, do they still stimulate growth? Tracing knowledge by following employees across firms
400 B. Halvorsen and Runa Nesbakken (2004): Accounting for differences in choice opportunities in analyses of energy expenditure data
401 T.J. Klette and A. Raknerud (2004): Heterogeneity, productivity and selection: An empirical study of Norwegian manufacturing firms
402 R. Aaberge (2005): Asymptotic Distribution Theory of Empirical Rank-dependent Measures of Inequality 403 F.R. Aune, S. Kverndokk, L. Lindholt and K.E.
Rosendahl (2005): Profitability of different instruments in international climate policies
404 Z. Jia (2005): Labor Supply of Retiring Couples and Heterogeneity in Household Decision-Making Structure 405 Z. Jia (2005): Retirement Behavior of Working Couples
in Norway. A Dynamic Programming Approch 406 Z. Jia (2005): Spousal Influence on Early Retirement
Behavior
407 P. Frenger (2005): The elasticity of substitution of superlative price indices
408 M. Mogstad, A. Langørgen and R. Aaberge (2005): Region-specific versus Country-specific Poverty Lines in Analysis of Poverty
409 J.K. Dagsvik (2005) Choice under Uncertainty and Bounded Rationality
410 T. Fæhn, A.G. Gómez-Plana and S. Kverndokk (2005): Can a carbon permit system reduce Spanish
unemployment?
411 J. Larsson and K. Telle (2005): Consequences of the IPPC-directive’s BAT requirements for abatement costs and emissions
412 R. Aaberge, S. Bjerve and K. Doksum (2005): Modeling Concentration and Dispersion in Multiple Regression 413 E. Holmøy and K.M. Heide (2005): Is Norway immune
to Dutch Disease? CGE Estimates of Sustainable Wage Growth and De-industrialisation
414 K.R. Wangen (2005): An Expenditure Based Estimate of Britain's Black Economy Revisited
415 A. Mathiassen (2005): A Statistical Model for Simple, Fast and Reliable Measurement of Poverty
416 F.R. Aune, S. Glomsrød, L. Lindholt and K.E. Rosendahl: Are high oil prices profitable for OPEC in the long run?
417 D. Fredriksen, K.M. Heide, E. Holmøy and I.F. Solli (2005): Macroeconomic effects of proposed pension reforms in Norway
418 D. Fredriksen and N.M. Stølen (2005): Effects of demographic development, labour supply and pension reforms on the future pension burden
419 A. Alstadsæter, A-S. Kolm and B. Larsen (2005): Tax Effects on Unemployment and the Choice of Educational Type
420 E. Biørn (2005): Constructing Panel Data Estimators by Aggregation: A General Moment Estimator and a Suggested Synthesis
422 H. Hungnes (2005): Identifying Structural Breaks in Cointegrated VAR Models
423 H. C. Bjørnland and H. Hungnes (2005): The commodity currency puzzle
424 F. Carlsen, B. Langset and J. Rattsø (2005): The relationship between firm mobility and tax level: Empirical evidence of fiscal competition between local governments
425 T. Harding and J. Rattsø (2005): The barrier model of productivity growth: South Africa
426 E. Holmøy (2005): The Anatomy of Electricity Demand: A CGE Decomposition for Norway
427 T.K.M. Beatty, E. Røed Larsen and D.E. Sommervoll (2005): Measuring the Price of Housing Consumption for Owners in the CPI
428 E. Røed Larsen (2005): Distributional Effects of Environmental Taxes on Transportation: Evidence from Engel Curves in the United States
429 P. Boug, Å. Cappelen and T. Eika (2005): Exchange Rate Rass-through in a Small Open Economy: The Importance of the Distribution Sector
430 K. Gabrielsen, T. Bye and F.R. Aune (2005): Climate change- lower electricity prices and increasing demand. An application to the Nordic Countries
431 J.K. Dagsvik, S. Strøm and Z. Jia: Utility of Income as a Random Function: Behavioral Characterization and Empirical Evidence
432 G.H. Bjertnæs (2005): Avioding Adverse Employment Effects from Energy Taxation: What does it cost? 433. T. Bye and E. Hope (2005): Deregulation of electricity
markets—The Norwegian experience 434 P.J. Lambert and T.O. Thoresen (2005): Base
independence in the analysis of tax policy effects: with an application to Norway 1992-2004
435 M. Rege, K. Telle and M. Votruba (2005): The Effect of Plant Downsizing on Disability Pension Utilization 436 J. Hovi and B. Holtsmark (2005): Cap-and-Trade or
Carbon Taxes? The Effects of Non-Compliance and the Feasibility of Enforcement
437 R. Aaberge, S. Bjerve and K. Doksum (2005): Decomposition of Rank-Dependent Measures of Inequality by Subgroups
438 B. Holtsmark (2005): Global per capita CO2 emissions -
stable in the long run?
439 E. Halvorsen and T.O. Thoresen (2005): The relationship between altruism and equal sharing. Evidence from inter vivos transfer behavior
440 L-C. Zhang and I. Thomsen (2005): A prediction approach to sampling design
441 Ø.A. Nilsen, A. Raknerud, M. Rybalka and T. Skjerpen (2005): Lumpy Investments, Factor Adjustments and Productivity
442 R. Golombek and A. Raknerud (2005): Exit Dynamics with Adjustment Costs
443 G. Liu, T. Skjerpen, A. Rygh Swensen and K. Telle (2006): Unit Roots, Polynomial Transformations and the Environmental Kuznets Curve
444 G. Liu (2006): A Behavioral Model of Work-trip Mode Choice in Shanghai
445 E. Lund Sagen and M. Tsygankova (2006): Russian Natural Gas Exports to Europe. Effects of Russian gas market reforms and the rising market power of Gazprom
446 T. Ericson (2006): Households' self-selection of a dynamic electricity tariff
447 G. Liu (2006): A causality analysis on GDP and air emissions in Norway
448 M. Greaker and K.E. Rosendahl (2006): Strategic Climate Policy in Small, Open Economies
449 R. Aaberge, U. Colombino and T. Wennemo (2006): Evaluating Alternative Representation of the Choice Sets in Models of Labour Supply
450 T. Kornstad and T.O. Thoresen (2006): Effects of Family Policy Reforms in Norway. Results from a Joint Labor Supply and Child Care Choice Microsimulation Analysis 451 P. Frenger (2006): The substitution bias of the consumer
price index
452 B. Halvorsen (2006): When can micro properties be used to predict aggregate demand?
453 J.K. Dagsvik, T. Korntad and T. Skjerpen (2006): Analysis of the disgouraged worker phenomenon. Evidence from micro data
454 G. Liu (2006): On Nash equilibrium in prices in an oligopolistic market with demand characterized by a nested multinomial logit model and multiproduct firm as nest
455 F. Schroyen and J. Aasness (2006): Marginal indirect tax reform analysis with merit good arguments and environmental concerns: Norway, 1999 456 L-C Zhang (2006): On some common practices of
systematic sampling
457 Å. Cappelen (2006): Differences in Learning and Inequality
458 T. Borgersen, D.E. Sommervoll and T. Wennemo (2006): Endogenous Housing Market Cycles
459 G.H. Bjertnæs (2006): Income Taxation, Tuition Subsidies, and Choice of Occupation
460 P. Boug, Å. Cappelen and A.R. Swensen (2006): The New Keynesian Phillips Curve for a Small Open Economy
461 T. Ericson (2006): Time-differentiated pricing and direct load control of residential electricity consumption 462 T. Bye, E. Holmøy and K. M. Heide (2006): Removing
policy based comparative advantage for energy intensive production. Necessary adjustments of the real exchange rate and industry structure
463 R. Bjørnstad and R. Nymoen (2006): Will it float? The New Keynesian Phillips curve tested on OECD panel data
464 K.M.Heide, E. Holmøy, I. F. Solli and B. Strøm (2006): A welfare state funded by nature and OPEC. A guided tour on Norway's path from an exceptionally impressive to an exceptionally strained fiscal position
465 J.K. Dagsvik (2006): Axiomatization of Stochastic Models for Choice under Uncertainty
466 S. Hol (2006): The influence of the business cycle on bankruptcy probability
467 E. Røed Larsen and D.E. Sommervoll (2006): The Impact on Rent from Tenant and Landlord Characteristics and Interaction
468 Suzan Hol and Nico van der Wijst (2006): The financing structure of non-listed firms