Master’s Thesis
Master's Degree in Automatic Control and Robotics
Control of a hand prosthesis using mixed
electromyography and pressure sensing
MEMORY
Author: Eduardo Ruiz Ramírez
Supervisors: Cecilio Angulo Bahón and Claudio Castellini
Call: September 2016 S e p te mb e r 2016 Mas te r's D e gre e i n A ut o m a ti c C ontr ol a nd R obot ic s E d u a rd o R u iz R a mí
Escola Tècnica Superior
C O N T R O L O F A H A N D P R O S T H E S I S U S I N G M I X E D E L E C T R O M Y O G R A P H Y A N D P R E S S U R E S E N S I N G
e d ua r d o r u i z r a m í r e z
Master’s Degree in Automatic Control and Robotics
Universitat Politècnica de Catalunya
Escola Tècnica Superior d’Enginyers Industrials de Barcelona (ETSEIB)
Deutsche Zentrum für Luft- und Raumfahrt Robotics and Mechatronics Center
Claudio Castellini Cecilio Angulo Bahón s u b m i t t e d:
September2016
Eduardo Ruiz Ramírez: Control of a hand prosthesis using mixed electromyogra-phy and pressure sensing,© September2016
A B S T R A C T
During the last years, new technologies approaches have helped to develop realistic robotic hands for prosthetic use. Even so, the strategies to con-trol them (input signals, prediction algorithms) are still limiting a complete match between the robotic hand and the real hand movements and behav-iors.
On this thesis, two different input signals (FMG and sEMG) were evalu-ated. From this analysis characteristic properties from each kind of signal were obtained, related with wrist and hand movements. In this way two different learning methods were implemented for the first time on robotic hand research. The goal of these two methods was to combine both kind of input signals, supported by the feature analysis previously done, in order to improve the movements prediction performance. The methods’ performance were compared with the separate input signals methods, so the improvement could be measured.
Both mixing methods presented better results than the single input signal ones. These results along with other considerations defined, could lead to a robotic hand performance improvement from different perspectives.
A C K N O W L E D G E M E N T S
First of all, I would like to thank God for the experiences lived, for the opportunities given. God’s timing is perfect timing.
In the same way I want to thank my parents and my sister for all their support during the two years abroad. In spite of the ten thousand kilometers between us, they were always at my side.
I want to express my gratitude to Dr. Claudio Castellini, not just for giving me the chance to develop this thesis on DLR, but for all the knowledge shared, the advices given and the support provided.
Thanks a lot to all the DLR’s people who contributed in the development of this project. Specially to Mathilde Connan and Bernhard Vodermayer for their collaboration on the first experiment and to Markus Nowak for his collaboration on the second experiment.
Furthermore I want to thank Dr. Cecilio Angulo Bahón, for all the help given since the beginning of my Master’s until the supervision of this work. I also want to thank Tamara von Sawitzky for reviewing this thesis even she did not have to do it. It came as a great relief.
Last but not least, my deepest gratitude to CONACYT for giving Mex-ican students the opportunity to rise above ourselves, having as goal the development of our country.
C O N T E N T S
1 i n t r o d u c t i o n 1
1.1 Objectives and hypothesis . . . 2
1.2 Thesis structure . . . 3
2 s tat e o f a r t 5 2.1 Human hand structure and movements . . . 6
2.2 Robotic hand prosthesis . . . 7
2.3 Non-invasive sensing methods . . . 9
2.3.1 sEMG . . . 9
2.3.2 FMG . . . 10
2.3.3 Ultrasound imaging . . . 10
2.3.4 OMG . . . 11
2.3.5 IMU and accelerometers . . . 11
2.3.6 Discussion . . . 11
2.4 Machine learning algorithms . . . 12
2.4.1 Pattern classification . . . 12
2.4.2 Extreme Learning Machine . . . 13
2.4.3 Linear Least Squares Regression . . . 13
2.4.4 Random Fourier Features Regularized Least Squares . . 13
2.4.5 Ensemble Learning . . . 14
3 p r e v i o u s w o r k o n d l r 17 3.1 Acquisition device . . . 18
3.1.1 Sensors . . . 18
3.1.2 Data acquisition wireless device . . . 20
3.2 3D hand model . . . 20
3.3 GUI . . . 21
3.3.1 PC GUI . . . 21
3.3.2 Mobile phone GUI . . . 23
3.4 Machine learning . . . 24
4 q ua l i tat i v e a na ly s i s o f f m g a n d s e m g s i g na l s a n d d e -v i c e u s e r e x p e r i e n c e 27 4.1 Experiment 1definition . . . 28
4.2 Experiment 1results . . . 30
4.2.1 Qualitative signal analysis . . . 30
4.2.2 Device user experience . . . 36
4.3 Experiment 1discussion . . . 39
4.3.1 Comparison between sEMG and FMG . . . 39
4.3.2 User satisfaction . . . 40
5 p r e d i c t i o n p e r f o r m a n c e i m p r ov e m e n t b y s e n s o r s m i x -t u r e 43 5.1 Ensemble learning . . . 44
5.2 Further first experiment analysis . . . 45
5.2.1 σparameter tuning . . . 46
5.2.2 Prediction performance . . . 47
. . Variable sort design . . . .
5.3.2 Modifications to DLR’s previous work . . . 56
5.4 Experiment 2results . . . 57
5.4.1 Learning method performance results . . . 57
5.4.2 User experience surveys results . . . 64
5.5 Experiment 2discussion . . . 65
5.5.1 Experiment performance . . . 65
5.5.2 User experience surveys . . . 68
6 s o c i a l, e n v i r o n m e n ta l a n d e c o n o m i c a l c o m m i t m e n t s 71 6.1 Social commitment . . . 72 6.2 Environmental commitment . . . 72 6.3 Economical commitment . . . 72 6.3.1 Costs . . . 72 7 c o n c l u s i o n s a n d f u t u r e w o r k 75 i a p p e n d i x. u s a b i l i t y a n d u s e r e x p e r i e n c e s u r v e y s 79 b i b l i o g r a p h y 85 viii
L I S T O F F I G U R E S
Figure1 Hand bones and joints . . . 6
Figure2 Hand and wrist joints movements [11] . . . 8
Figure3 FSR and sEMG sensor . . . 18
Figure4 FSR amplifier circuit diagram [8] . . . 19
Figure5 Sensors’ housings and bracelet arrangement [8] . . . . 19
Figure6 Wireless device . . . 20
Figure7 3D hand model (Left:Training/performance. Right:Prediction) 21 Figure8 PC GUI . . . 22
Figure9 Mobile phone GUI . . . 23
Figure10 Device setup for experiment performance. . . 29
Figure11 Typical FSR and sEMG signals obtained from one sub-ject two repetitions of the instructed hand and wrist movements (wrist flexion, wrist extension, wrist prona-tion, wrist supinaprona-tion, power grasp and rest). . . 30
Figure12 Sensor’s samples difference plot. Five repetitions of the wrist flexion movement. . . 31
Figure13 PCA projection of typical data for each type of sensor. 32 Figure14 Mean Safety Index matrices for each type of sensor. Lower is better. . . 34
Figure15 Standard deviation of the Safety Index matrices for each type of sensor. . . 34
Figure16 Prediction accuracy plot, separated by FSRs, sEMG sensors and both of them mixed. . . 36
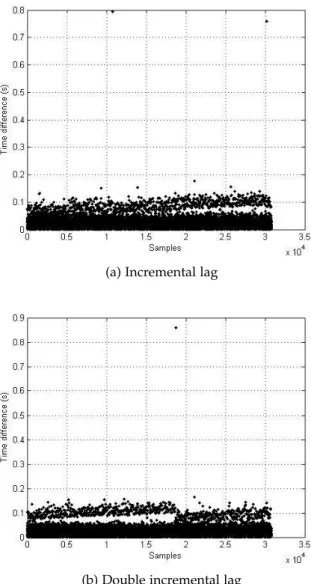
Figure17 Samples time period plots. . . 37
Figure18 Workload percentage plot. . . 38
Figure19 Word clouds from the results of the desirability sur-vey . . . 38
Figure20 Radial chart showing the user satisfaction surveys’ re-sults summarized in different device features. . . 41
Figure21 Ensemble learning stacking approach block diagram . 45 Figure22 CV diagram for σtuning 46 Figure23 Prediction performance on the test set using the opti-malσfor each subject . . . 48
Figure24 Prediction performance on one repetition for each method considering the CV approach . . . 49
Figure25 Prediction performance after a 10-fold CV using the generalized σfor each subject . . . 49
Figure26 Prediction performance after a 10-fold CV using the generalized σfor each action . . . 51
Figure27 Second experiment setup and performance . . . 51
Figure28 Experiment block diagram . . . 52
Figure29 Training stage state diagram . . . 52
Figure Visual feedback face drawings . . . . Figure32 Modified PC GUI . . . 57 Figure33 Overall measurement variables for all the subjects . . . 59 Figure34 Average measurement variables for each action and
the overall approach . . . 60 Figure35 Average effectiveness percentage for each intensity level
considering each action and an overall approach . . . . 62 Figure36 Average effectiveness percentage evolution across the
experiment sections for each action and the overall approach . . . 63 Figure37 Overall average effectiveness percentage evolution across
the experiment tasks . . . 65 Figure38 Experiment 2workload percentage plot . . . 65
L I S T O F TA B L E S
Table1 Means and SD of the sensor’s samples difference. Three
repetitions of the wrist flexion movement. . . 31
Table2 Mean of the Safety Indexes (without counting the di-agonal) for each user, and their total means. . . 34
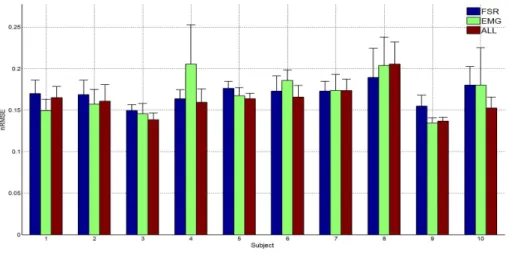
Table3 Prediction accuracy (nRMSE) obtained by each sub-ject for a movement sequence repetition prediction. Were considered the FSRs, the sEMG sensors and both of them together. . . 35
Table4 Subject’s system usability total scores. . . 37
Table5 NASA TLX workload percentages. . . 38
Table6 Optimalσvalues obtained by CV for all subjects . . . . 47
Table7 Performance measurement on the test set for each subject . . . 48
Table8 Performance measurement using the generalized σ and applying CV for each subject . . . 50
Table9 Average of all the subjects performance measurement (nRMSE) for each action using the generalizedσ. . . . 50
Table10 Action blocks including different sorts of the actions to perform (1- Wrist Flexion, 2- Wrist Extension, 3 -Wrist Pronation,4- Wrist Supination,5- Power Grasp) . 54 Table11 Methods, action blocks and level sort across the sub-jects (for the methods: 1- Stack, 2- sEMG, 3- FSR, 4 -Ensemble) . . . 55
Table12 Experiment performance for the first subject . . . 56
Table13 Overall experiment 2performance (Experiment com-pletion time, successful tasks percentage and unsuc-cessful tasks InGoal rate) . . . 58
Table14 Experiment2average performance (Experiment com-pletion time, successful tasks percentage and unsuc-cessful tasks InGoal rate) by action . . . 60
Table15 Experiment 2 average successfulness percentage by action level intensity for each action (High, medium and low) . . . 61
Table16 Average effectiveness percentage evolution across the experiment sections for each action and the overall approach . . . 64
Table17 Overall average effectiveness percentage evolution across the experiment tasks . . . 65
Table18 User experience survey results . . . 66
Table19 Experiment 2NASA TLX workload percentages. . . 66
Table20 Hardware resources costs . . . 73
Table21 Software resources costs . . . 74
Table Total costs . . . .
A C R O N Y M S
AVG Average
CV Cross-validation
DLR Deutschen Zentrums für Luft- und Raumfahrt (German Aerospace Center
ELM Extreme Learning Machine ENS Ensemble
FMG Forcemyography FSR Force-sensing resistor GUI Graphical user interface IMU Inertial measurement unit iRR Incremental ridge regression
iRRRFF Incremental ridge regression with random Fourier features NASA National Aeronautics and Space Administration
nRMSE Normalized root-mean-square error OMG Optical Myography
PC Personal computer RFF Random Fourier features
RMC Robotics and Mechatronics Center RMSE Root-mean-square error
SD Standard deviation
sEMG Surface electromyography SUS System usability scale TLX Task Load Index US Ultrasound
1
I N T R O D U C T I O N
Around49million people are living with limb loss around the world [6,18].
35% of them have an upper limb amputation [6], and according to British statistics [15],2% have a wrist disarticulation (hand amputation).
The most common causes for amputation are vascular diseases and trauma at work or car accidents [6], but also diabetes is taking strength being nowa-days one of the main causes too. Furthermore, in war-torn countries losses caused by war effects are a considerable quantity on amputees statistics [32].
The scope of the amputee statistics is most of the times only focused to the United States and, even there, it is limited and sometimes non-existing. Even so, LeBlanc [18] proposes that the global statistics could be scaled for each country according the rate between the country population and the world population. If this approach is applied, then global and country statistics can be estimated (was this the way the very first statistic of this work was calculated).
Through the years, prostheses have been created for replacing the ampu-tated limbs. With the development and improvement of technology, robotic prosthesis appeared. In this way the user can move an automatic device by using signals from the rest of his/her body (bio-signals). Despite this fact, there are not enough users who prefer to use a bio-signal control prosthe-sis. Just25% of them are using myoelectric prostheses for instance [16]. The main reason of this gap is the fact that most of the prosthesis control are not robust, they sacrifice robustness for more joint movements accuracy, losing at the same time potential real life applications.
As mentioned in Jiang et al. [16], this gap can disappear by mixing the advantages that both, commercial and academic prostheses, offer: on one hand a robust system, and on the other hand an intuitive control. This gap is the starting point for upper limb prosthetics control research, based on the experimentation with different kind of sensors or acquisition methods.
The replacement of a human limb with an artificial one implies several challenges. The human involved needs to interact with the prosthesis the same way with a real limb. The main key for a successful interaction is communication [9]. Communication can be understood as the link between what the human wants to do and what the prosthesis can do, in other words how similar the artificial limb compared with a human one is. Although in the last years there have been significant improvements in the electronics, mechanics and materials of the prosthetics limbs, managing to build for in-stance robotic hands with 22 joints that approximates to the human hand dexterity [9], if this communication feature is not the proper one, then the patient would have a limited performance using the robotic hand, reducing completely the real life application of the prosthesis.
This is the main problematic in prosthetics field, great mechanical designs close to a real hand, with innovative materials built in innovative ways (3D printed for instance), but they cannot be controlled properly by users who need more robust and real behavior from their new limbs. Hence, instead of really working as physiologically replacement of the human hand, most of the prosthesis work only as tools, to provide some functions that were lost (like grasping), but then, after the desired task performance, they could be ignored, as they are not working for something else. Despite those facts actual research is doing a hard work to focus the field progress toward the creation of true hand replacements [35].
The main goal of robotic prostheses development is to help people with limb loss to recover at least some of their usual tasks and activities that were used to do before their loss. Just as an example, 36% of people living with limb loss experience depression [6]. Here lies one of the main motivations for this project.
The German Aerospace Center (DLR) in Oberpfaffenhofen, by its Robotic and Mechatronics Center (RMC), has been working in the research of up-per limbs improvement, has been working to reduce the gaps, to overcome the challenges and limitations previously defined. The development of this project is just a small part of the entire research.
1.1 o b j e c t i v e s a n d h y p o t h e s i s
Following the motivation line, and based on the work previously done on DLR, the next objectives were established for being accomplished by the current project:
Test and design a software suite for acquisition and control devices. Design two experiments:The first one to make a comparison between two different bio-signals (FMG and sEMG). The second experiment has as objec-tive the effecobjec-tiveness test of a multi-sensor control, as opposed to the single-sensor one used on the first experiment.
Identify from the first experiment, what type of sensor (sEMG or FSR) has better response to different hand and wrist movements.
Apply the results of the second experiment to predict movements and test the results in a3D hand model.
Improve the user interface, adapting it to the needs of the experiment. Finally, improve the machine learning algorithm for better prediction.
All these goals are focused to deal with the limitations exposed previ-ously in this section. The main hypothesis of this porject is that the hand movements prediction performance could be improved by combining the defined bio-signals from the two kind of sensors, as those signals are pre-senting different features and behaviors.
It is important to remark that due to the unavailability of the robotic pros-thesis hand, this project is limited by the tests on a3D hand model, however the project is still focused on the goals appliance on a robotic hand. In fact
1.2 t h e s i s s t r u c t u r e 3
it is relatively simple to move from the 3D hand model control to a real prosthesis one.
1.2 t h e s i s s t r u c t u r e
This thesis is composed by seven chapters.Chapter1is the current introduc-tion.
Chapter2is a literature review showing the background and state of art of the hand anatomy, robotic hand prostheses, sensing methods and machine learning algorithms.
Chapter3 presents the state of art of the work previously done on DLR, as much of the work used on this project was already used in other projects. This chapter is important as it is a direct background of the project, definitely needed for a proper understanding of it.
On Chapter4, the first experiment is executed and evaluated. This exper-iment is considering the use of sEMG sensors and FSR in order to compare their signals and identify special characteristics and properties for each of the sensors. This chapter also contains a study about the usability and user experience of the device.
On Chapter 5, on a similar way as in the previous chapter, the second experiment is exposed, showing first the work done for a better experiment design, then is presented the experiment definition, the results and the dis-cussion.
Chapter6exposes the social, environmental and economical commitments this project has. Additionally a cost analysis is evaluated.
Finally on Chapter7 the conclusions and recommended future work are presented.
Going further, the project work was planned to be done on six months, dividing it into four stages:
Familiarization with the work previously done on DLR, which corresponds to Chapters2and3, this stage was performed on two months.
Feature analysis of the two types of sensors (sEMG and FSR), the goal of this stage was the development of Chapter 4, along with it a publication was written with the research findings. This stage took one and a half month.
Machine learning development for prediction performance improvement by com-bining sensors, the work done in this stage is documented on Chapter 5. It was performed on two months.
Thesis Documentation, even though the thesis writing was done during the 6months, supported also by the publication of the second stage results, the last two weeks of the project were used for a final arrangement.
2
S TAT E O F A R T
This chapter is a literature review showing the background and state of art of the hand anatomy, robotic hand prostheses, sensing methods and machine learning algorithms. All this information is needed for the project develop-ment.
(a) Hand bones [11]
(b) Hand joints [27]
Figure1: Hand bones and joints
2.1 h u m a n h a n d s t r u c t u r e a n d m ov e m e n t s
The anatomical explanation is based on the work completed by Chen [5]. In prosthetics field, the system of the hand considered, at least in most of the prosthesis, is the skeletal system, considering that there are also integumen-tary, muscular, lymphatic, nervous and cardiovascular systems. The skeletal system includes bones and tendons. For the purposes of this project, the main goal is the performance of wrist movements, so there will be consid-ered also the forearm and wrist skeletal systems. The interested skeletal region goes from the elbow passing through the forearm, where the Ulna and Radius bones are located, then goes across the wrist, which works as a connection for the hand and forearm (the Scaphoid, Lunate, Triquetrum, Pisi-form, Hamate, Capitate, Trapezoid and Trapezium bones are located in this part). Finally there is the hand, which is first composed of five Metacarpals
2.2 r o b o t i c h a n d p r o s t h e s i s 7
(palm bones) and five Digits. Each Digit is built by three bones, the Proximal, Distal and Middle phalanxes; except for the thumb that has just two bones.
If the anatomical terms are translated to robot kinematics, then each bone can be considered as a link. Connecting those links, as always, there are joints. Starting with the Radiocarpal one at the wrist, then the Carpo-metacarpal that is connecting the Hamate, Capitate, Trapezoid and Trapezium with the Metacarpals; after that, there is the Metacarpal-phalangeal, that is located between metacarpal and the proximal phalange bones, and finally the prox-imal and distal interphalangeal joints that separates the phalangeal bones.
This hand anatomy explanation is important for a 3D Hand Model con-struction, and, in a closer way to this project, with the wrist and finger move-ments explained in the next paragraph. For a better understanding, Figure1 shows in a detailed and graphical way the human hand bones and joints. The joints can perform gliding movements, angular movements, circular move-ments and special movemove-ments (like inversion, eversion, protraction, and re-traction). This thesis deals with the angular (flexion/extension) and circular (rotation and pronation/supination) movements.
These movements are shown on Figure2for both, fingers and wrist joints. Each joint can be able to perform one or more movements, but the joints and movements which this project focuses on are the following:
Wrist Flexion/Extension, wrist (Forearm) Pronation/Supination and grasp-ing movement (which includes fgrasp-ingers and thumb flexion and thumb rota-tion).
Summarizing, the human hand is composed by27 bones and33muscles, which result in a total of 22 DOFs [8]. The hand system is able to perform basically the following tasks, which are the ones that the robotic prosthesis hand tries to emulate [39]: Reaching and pre-shaping, grasping, manipu-lation with stable grasp, exploration with sensori-motor coordination and gesture expressiveness.
2.2 r o b o t i c h a n d p r o s t h e s i s
In order to control let a user control a prosthesis, Craelius [9] proposes two basic requirements.The first requirement prescribes, that the user must have control over the motor function somewhere in the residual limb, such that he could sense and imagine the manipulation of the lost limb. If the residual muscles are damaged, there is the option of surgery to restore the nerves or reroute them to healthy areas, for example, the hand residual signals could be rerouted to the pectoral muscles, so then the muscular activity is easier to access.
The second requirement implies that a device can acquire and decipher the information generated in the previous requirement. This requirement is more challenging because of the complexity of the human movement control. Our smooth and precise movements are the result of functioning sensor-monitor system, that transforms the result of all senses (tactile, posi-tional, visual) into fine movements via millions of electrical impulses. The
(a) Wrist movements
(b) Finger movements
Figure2: Hand and wrist joints movements [11]
challenge for the prostheses is to restore the lost sensor-monitor function by the assistance of an artificial limb.
There are four functional issues that need to be considered for the design and construction of a prosthetic hand: grasping, sensing, actuation and con-trol strategy. These four issues should be combined in order to fulfill some of the tasks listed section 2.1. For instance, the hand should provide a natu-ral grasping capability, a natunatu-ral appearance, secure grasping, and a natunatu-ral and friendly command interface [4].
g r a s p i n g: Grasping, holding an object, is a complex task because does not involve just kinematic motion, but also force control. This action depends on the goal object geometry, strength, stiffness, and surface finish; as well as on the fingertips features. For a successful grasping, the robotic hand should be robust and compliant, must have control of the force and slippage of the object and also needs to be manipulable while grasping [17].
s e n s i n g: The sensing in a prosthetic hand could be divided in two types: The first one are the sensors used for acquiring body signals for the hand joints movement, this kind of sensors ideally should be non invasive, and actually are present din the next section.
The second type are the internal sensors of the , not just the ones for used in the joints for hard control, but also other sensors that could give feedback
2.3 n o n-i n va s i v e s e n s i n g m e t h o d s 9
to the user so he or she could feel a more real sensation with the hand, this kind of sensing is called exterioceptive sensing.[17]
a c t uat i o n: The actuators should occupy as least amount of space in-side the hand structure. The most common actuators used are DC motors and minimotors coupled with gear reductions, both of them are used for joints movements. Nevertheless, other actuators have been tried, artificial muscles for example. These artificial muscles are built using pneumatic de-vices or different materials like shape memory alloy, or ionic polymer metal composite. The problem with the artificial muscles actuators is that they are still under development, facing problems in the size of auxiliary elements and the power of actuation. Finally need to be considered the power storage and supply issues.[17]
c o n t r o l s t r at e g y: The main goal of the hand prosthesis, is to move and react as a human hand. In order to reach that goal the robotic hand should apply control strategies that convert the sensed signals into output signals that are able to move the joints and links and produce natural flow and forces.
According to Naidu et al. [23], there are two kind of control strategies: the hard and soft ones. The hard computing includes: multivariable feedback, optimal, nonlinear, adaptive and robust control techniques; applied, for in-stance, in impedance control (moment of inertia, joint stiffness or viscosity of a muscle model). The soft computing involves: artificial intelligence, neural networks, machine learning, fuzzy logic, genetic algorithms. Some applica-tions of this techniques are the prediction of the joints movements depending the sensing of a body signal. After all, the final goal for robotic hand control is the fusion of both approaches to achieve a more realistic behavior of the hand.
2.3 n o n-i n va s i v e s e n s i n g m e t h o d s
Different sensing methods are described in this chapter apart of the chosen sEMG and FMG. These last two methods are compared with each other in subsection2.3.6.
2.3.1 sEMG
Electromyography is evaluating and recording the electrical manifestation of the human muscle movements, it is possible to get information about the neural signals that control the muscles from the central nervous system [16]. In prosthetics the sEMG signals are used due to the relation between the neural drive to the desired movement and the power intensity of the signal. The sEMG signals are acquired by surface sensors located in the remnant muscles of the stump, they are processed and after that activate certain pros-thetic functions or movements. Although there are researches with other bio-signals for the prosthesis control, the surface sEMG signals have been
the only one that have worked with practical uses of multifunction upper limb prosthesis since the middle of the last century, consequence of the easy acquisition of the signal (non invasive, commercial sensors), and it is likely to be a trend in the near future [16].
2.3.2 FMG
Forcemyography is a relatively unexplored technique that captures, by us-ing Force Sensor Resistors(FSR), the expansion/contraction of the muscle surface by registering its pressure. Before they were applied in the prosthet-ics area, FMG signals were used to monitor physical activity. They were able to distinguish different limb movements and predict them. Although this analysis was done in a non real time mode, those applications showed the feasibility of using FMG for muscle movement capture.[38]
The main difference between FMG and sEMG is that the first one is sensing mechanical signals, which represents a low-bandwidth and degraded ver-sion of the neuroelectrical signals, due to this fact, it cannot define activities for individual muscles [36].
A force sensor resistor (FSR) is made of a polymer film that decreases its electrical resistance when a force is applied over its sensing area [38]. That means that the output voltage is inversely proportional to the force applied, additionally, the output response is not linear, presenting different curves shape depending the resistor used in the voltage divisor of the signal conditioning circuit.
Until the date of the publication of [36], FMG was the only neuromus-cular imaging method that had worked with simultaneous, multifunctional and multi-DOF control of prosthetic hands. But what is really important about the FMG is that it needs to fulfill practical needs. For example the sensors and wearing devices must be reliable and durable, easy to calibrate and compatible with control and learning interfaces so earlier works with other sensors could be applied for FMG and also the new work done with FMG could be used in other devices. Preliminary trials have demonstrated that the FMG devices are easy to wear and calibrate and have had a good performance with several damaged amputees residual limbs [36].
2.3.3 Ultrasound imaging
The ultrasound waves have a frequency over20kHz. They can penetrate soft tissues without harming them, due to this fact, they are used a diagnostic tool to visualize innards of the human body.
Ultrasound Imaging (US imaging) builds2D- or3D-live images from the interest body parts by the partial reflection of the waves at the tissues with different acoustic impedance. Until now US imaging does not have any known side effect, so it is used in most hospitals.
US imaging detects conditions of the muscoloskeletal system, the informa-tion obtained is starting to be exploited to build a Human-Machine Interface with clear and potential future applications, like advanced hand prosthetics
2.3 n o n-i n va s i v e s e n s i n g m e t h o d s 11
control, becoming a great competitor of the already established non invasive HMIs, such as sEMG.
There is a relation between the fingers joints and the spatial features ex-tracted from US images of the forearm, so it is possible to reconstruct the hand configuration using those US images. The information extracted is based on the forearm position so it does not depend on the subject’s speed movement, having its only limitation in the hardware and software features [31].
2.3.4 OMG
Thanks to the high quality and cheap cameras that exist nowadays, the op-tical motion tracking and image processing are applied in more complex tasks, for instance rehabilitation devices for disabled.
Optical Myography (OMG) is based on the idea that, by using optical tracking and recognition, an amputee’s intended movement can be recon-structed, just by looking at the muscle activity deformations of the user’s stump and associated them with movements the subject is trying to perform. The idea stems from the principles of pressure and tactile sensors.
The first drawback is the fact that human skin provides very little texture features for computer vision applications, so an artificial tag attached to the human limb that offers robust and reliable texture fixtures is needed for the detection and posterior tracking. Even so the tracking of precise features problem still exists.
At the end the use of plain optical recognition to track the forearm could improve the interaction between an amputee and a virtual world (virtual environments, robotic prosthesis) without using any wearable device [24].
2.3.5 IMU and accelerometers
Another option to measure arm movements is the use of accelerometers, there are commercial wrist accelerometers that can give measures of the arm movements reading their multidirectional acceleration data. The disad-vantages of this type of sensors are, first of all, that they cannot provide real-time feedback to the user, nor are able to capture information about the hand [38]. So for the purposes of this project the use of accelerometers is limited. These sensors can be used only for the arm tracking and to improve the prediction response [14].
2.3.6 Discussion
Among the non-invasive methods, other than the ones here presented, can be found electroencepahlography (EEG), mechanomyography (MMG), func-tional magnetic resonance imaging, etc [12, 19]. Anyway, recently the re-search community is pushing the development and rere-search of multi-sensing methods.
Even though the sEMG sensors have been the most used input in the re-search of prostheses control methods, it is difficult to preform a robust con-trol solely using this kind of sensors. The point here is that several studies and works have demonstrated the potential of the sEMG signal processing to predict limb movements, but none of them has shown that this features have been implemented in a real and practical prosthetics application [36]. It is necessary to mix different kind of inputs to control complex prosthetic devices and also give them more intelligence and autonomy, so the the oper-ation can be simple to the user [16].
Additionally it is important to keep the device in an accessible price for the user. On one hand there are the sEMG sensors which can reach, at least the ones used for this project, 150eeach sensor, on the other hand there are the FSRs, which each sensor can be purchased for less than5eeach [29].
Furthermore, on the same work done by Ravindra and Castellini [29], a comparison between FMG, sEMG and ultrasound imaging is done, discard-ing the ultrasound imagdiscard-ing due to its bad performance wearability and cost, but putting sEMG and FMG in similar levels, giving some advantage to the FMG cause its stability and the already mentioned low cost.
Considering these facts, FMG and sEMG were the signals chosen in the previously DLR’s projects and hence in this one. Afterwards it is expected to go further through the signals comparison already done.
2.4 m a c h i n e l e a r n i n g a l g o r i t h m s
The algorithms presented in this section have been used for prosthetic hand movements prediction, except for the ensemble learning, which is firstly pro-posed in this field as a method for mixing different models. Further infor-mation about the algorithms can be found in the references pointed in each subsection.
2.4.1 Pattern classification
The Pattern Classification applied to the myoelectric control is based on the assumption that the obtained signals are distinguishable and repeatable pat-terns depending the muscular activation performed. The drawback of clas-sification is that the accuracy and usability are inversely proportional. The reason of this is that while the human limb usually has simultaneous and proportional movements, given by the articulations of the limb’s DOFs, the number of patterns is limited, so what is obtained from the pattern classi-fication is just an approximation of the real parameter space. This approx-imation produces two problems, the first one is that only one class can be selected as a decision, the second one is that proportional control is not ob-tained directly from classification, actually to try to perform a proportional control affects the accuracy of classification [16].
2.4 m a c h i n e l e a r n i n g a l g o r i t h m s 13
2.4.2 Extreme Learning Machine
The Extreme Learning Machine (ELM) is a batch regression learning algo-rithm for training one kind of Artificial Neural Network, the Single-Hidden Layer Feedforward Network (one input, one hidden and one output layer). The algorithm is similar to the non linear regression explained in the next subsections, it performs linear least squares on a projected feature space [33].
ELM has been used for FSR signals processing and learning [38]. This algorithm has similar and sometimes better performance compared to the Support Vector Machine algorithm and Artificial Neural Networks, but with the advantage of being simpler and having a faster learning speed. This features are important if the learning is desired to be applied in portable devices, so it could be programmed using a microcontroller. If the sensor’s position changes then the learning can be redone fast without any problem [38].
2.4.3 Linear Least Squares Regression
Linear Regression is a supervised learning algorithm, used to train relation-ships between an input variable and continuous outputs values from defined data sets, so future output predictions can be performed using new inputs. This relationship is represented as a function f: X → Y, that should be lin-ear, sof(x) is represented as a line (for one dimension), as a plane (for two dimensions) or hyperplane (for three or more dimensions).
The main goal of this learning approach is to find a vector that contains the slopes of the linear function. The method for this vector search is the least squares algorithm. It works based on the idea of minimizing the sum of the squared distance between observed values, ground truth, and the prediction, f(x). This algorithm is explained as a background for the Random Fourier Features Regularized Least Squares method, that actually is the one that has been used in research for hand movements prediction [33].
2.4.4 Random Fourier Features Regularized Least Squares
The Linear Least Squares Regression algorithm can be translated to a non-linear regression approach in two different ways. The first one by building a new model product of the mixture of linear models (each one using distinct input-dependent weighting functions). The second way to reach the non linearity consists in project the input space into a feature space using a non linear kernel function, then a Linear Least Squares Regression is performed in this feature space. For prediction is used a model built by a weighted sum of the kernel functions.
A way to build those kernels is by using randomly sampled cosine fea-tures, as defined in the Fourier Transform Theory. This method called Ran-dom Features Regularized Least Squares was first purpose by Rahimi and Recht [28] and improved adding an incremental feature by Gijsberts and Metta [13] [33].
This approach has been used in several papers for robotic prostheses con-trol using biosignals as input data, for instance the one done by Gijsberts et al. [14], being this algorithm the one previously used in DLR research, which was the base of this project.vHow this method has been applied in DLR’s projects is explained in deeper way on Chapter 3.
2.4.5 Ensemble Learning
As was defined in the Introduction, one of the goals for this project is to mix both kind of sensors (sEMG and FSR) to improve the prediction performance. In the Machine Learning field, this improvement could be performed by the appliance of the Ensemble Learning approaches.
In a normal learning algorithm just a single hypothesis is proposed, which explains the data in the best way. Ensemble Learning on the other hand construct a set of hypotheses, this hypotheses are voted to predict the new data samples. Experimental tests have proved that ensemble methods are often much more accurate than single models.[10].
Ensemble Learning includes three methods that are applied for different purposes. The one interested, as will be explained on Chapter5, is the stack-ing one. Anyway, all the three algorithms are presented in the next para-graphs.
2.4.5.1 Bagging
Was the first effective ensemble learning method and it is one of the sim-plest ones. The method uses different "versions" of the training data set by using bootstrap. Each of this versions are used to train a different model (usually are classification models, but also could be used with regression). The outputs of the models are averaged (for regression models) or voted (for classification models) in order to combine them. This method is only useful when unstable non-linear models are used [30].
2.4.5.2 Boosting
Boosting is the most used ensemble method, and actually one of the most important findings in the learning topic in the last twenty years. Its main idea is to create a weak classifier, which means that the accuracy on the training set is just a little bit better than a random prediction. After that, iter-atively, the model is trained using a weighted training set, where the poorly predicted values from the previous iteration are more weighted. After all, the successive models are weighted according their success and the outputs are voted/averaged and combined, creating in this way the final model. The most popular boosting algorithm is the AdaBoost [30].
2.4.5.3 Stacking
Stacking method is most of the times used for combining two or more dif-ferent machine learning methods. It works by dividing the training set in
2.4 m a c h i n e l e a r n i n g a l g o r i t h m s 15
folds, so a cross-validation can be performed, training in a certain number of folds and validating in the rest, then change the folds involved, so after all the training all the folds are trained and validated the same number of times. For each repetition, the prediction performed with the validation set is stacked, creating a new input space for a new machine learning appliance, usually a higher level learner [30].
3
P R E V I O U S W O R K O N D L R
As was mentioned in the Introduction, this project is the continuation of the work previously done in the DLR related with upper limb prostheses control. Most of the devices and software used for the project’s experiments were already developed. This chapter presents a more specific background in which this work was directly based.
This chapter is structured in4parts, the first one explains the acquisition device used, a second part explaining the 3D Hand Models used , then a section that shows the GUI applied and finally a fourth part that presents the learning approach applied.
3.1 a c q u i s i t i o n d e v i c e
3.1.1 Sensors
For the previous projects done in DLR, sEMG sensors and FSRs were used. For the sEMG acquisition signal, the Ottobock MyoBock 13E200 sensors were used (Figure 3). This sensors already provide an on-board amplifica-tion, rectification and filtering, in order to give a high-quality signal. Addi-tionally this sensors are the standard ones used for clinical prosthetic appli-cations, furthermore they are commercially available.
(a) FSR [8] (b) sEMG sensor
Figure3: FSR and sEMG sensor
For the FMG signal acquisition, the FSRs 400 Short (Figure 3) manufac-tured by Interlink Electronics were used . They are made of a polymer thick film, having a 5.6 mm diameter sensitive area. They have a large force sen-sitivity range (0.2N-40N), despite of these facts, FMG also presents some drawbacks: a non-linear behavior, a non-negligible hysteresis at high force appliance, and no guarantee of repeatability through sensors. Even so, it has been shown that this drawbacks are reduced for small forces (0N- 15N), so the sensors behavior is comparable and almost linear [29].
In order to condition and process the FSR signal, a circuit board was made. It consists in a voltage amplifier which voltage output corresponds to: Vout = RR21V+CCR2− RR1R1+4VRCC2 ×RFSR1 , where RFSRis the lowest admissible
re-sistance and its equal to RFSR = R1R4
R2 = 6kΩ, this value corresponds to a theoretical maximum force applied to the FSR surface of3.33N.(Figure4)
Both kind of sensors are arranged in Velcro straps, so can be created sen-sors bracelets that are tightened to the user’s forearm. In order to allow the attachment of the sensors to the strap, 3D-printed housings have been designed. These housings are made of flexible thermoplastic polyurethane (Figure5). They are designed with braces to allow them sliding on the strap, so the sensor position can be individually adjusted, changed and maintained,
3.1 a c q u i s i t i o n d e v i c e 19
Figure4: FSR amplifier circuit diagram [8]
having a big range of possibilities for the sensor arrangement. This feature allows any combination of FSR and sEMG, so a complete forearm circumfer-ence signal acquisition could be performed. For the experiments done, the sensors were arranged in alow-density surface electrode layoutor uniform elec-trode positioningapproach, that basically puts the sensors in an evenly spaced placement around the forearm (Figure 5). This approach has already been proved to be effective and useful for robotic hand prosthesis in a number of previous publications.
The FSR housings are not only useful as a retainer, but also have a struc-ture that concentrate the force produced by the muscles on the FSR sensitive area. This concentration is possible thanks to a cone shape in the housing that points inwards to the sensor sensitive area. The real impact of this struc-ture in the force signal has not been object of study, so it is assumed that it increases the signal stability, and hypothetically could add some mechanical filtering to the signal. A detailed information about the sensors and housing design can be found in [8]
(a) Bracelet with sensor arrange-ment
(b) Sensors’ housings (Left FSR, right sEMG)
3.1.2 Data acquisition wireless device
The device used for the sensors’ signals acquisition(Figure6) was designed and built in DLR and is presented in [8]. It is sending the sensors’ data to a GUI in a wireless way, by using Bluetooth communication. Going deeper in its structure, the device consists, first, in a multiplexing stage, so a sensor number higher than 15 (microcontroller analog inputs) could be used. The multiplexed signals are then sent to a microcontroller, that converts the ana-log signals into digital ones. In this way, the signals could be sent via serial communication to the Bluetooth chipset, which in turn sends the signal to the device where the GUI is running. This chipset allows data emission and reception.
In fact this device can also send the prediction obtained in the machine learning to a robotic hand (iLimb1
), so its Bluetooth chipset is working in a two communication channels way (one for the iLimb, and the other for the GUI). However as will be later explained, for this project purposes, the device is used just for data acquisition, so it is working just in with the GUI communication channel. It is important to remark that the device is just a communication/acquisition device, the training and prediction tasks, the data saving, and other signal condition features are performed by the device in charge of the GUI.
Figure6: Wireless device
3.2 3 d h a n d m o d e l
There are two ways to test the prediction and have visual feedback of the performance. One way is to apply the predicted output to a real prosthetic hand, the other one to use a 3D hand model. The latter option is also used for having a visual feedback during training.
1 Robotic hand manufactured and distributed by Touch Bionics, for more information please consult the product datasheet [Bionics2016]
3.3 g u i 21
The values representing the DOF of the training 3D hand model, which will be called stimulus in this thesis, are acting as the ground truth for the machine training and for performance calculation.
The hand model was designed in Blender. To control it, the degrees of freedom from the stimulus (9 or 12) are coupled with the real hand de-grees of freedom (26, now including also wrist DOF). Each of the real hand DOF is matched also with a model bone, so for instance the wrist prona-tion/supination DOF is matched with the forearm bone, or both the finger metacarpophalangeal adduction and the metacarpophalangeal flexion DOF are matched to the proximal phalange bone.
Figure7:3D hand model (Left:Training/performance. Right:Prediction)
On the screen there are two hands displayed. The purpose of displaying two hands is to use one for a stimulus ground truth for training or for perfor-mance measurement, while the other hand is used for prediction, so the user can have a visual feedback about what the machine learning is performing. The communication between the model and the GUI is done using a UDP protocol, so for each hand model (training / performance and prediction) a UDP Port is assigned.
3.3 g u i
In this approach, a mobile phone or a PC can be used for visualizing the GUI. For each of the options was developed a different GUI, with common and specific tasks.
3.3.1 PC GUI
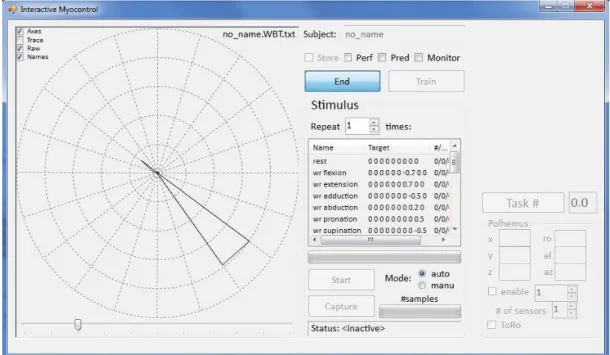
Basically the GUIs previously programmed on DLR, offered a training and prediction stage, fingers and wrist movement selection, data storage, and communication to different applications (iLimb prosthesis, the3D hand model), it allows also to use not only the sEMG sensor or FSRs, but additionally other types of sensors for different kind of measurements, such as fingertip forces or position tracking. The language used for the GUI programming was C#
Figure8: PC GUI
The GUI is shown on Figure8. As could be appreciated, it has a Radial Plot that shows all the sensors’ values, the name of the subject can be assigned, and also has options for storing the sensors data and the stimulus one. The GUI provides information about the data capture rates, so the user can know if the stimulus or the acquisition device is having any delay or lag. It is important to say, that this code was designed for working not only with the wireless device already presented, but with the sEMG braceletMyoand with a PC signal generator (so the GUI could be tested without any acquisition device).
Continuing with the GUI, the user can select the actions to train from a list of possible ones, and the number of repetitions the training will perform. This training could be done in automatic mode (the data capture for training is done in a previously established time) or manual mode (the user decides how long the capture stage will last). The GUI is user-friendly, in the way that it displays in the radial plot also the representations of previous repe-titions, so the user can have a reference when he or she is performing the movements. Additionally the GUI shows two progress bars, one showing the progress of the entire learning stage, and a second one showing the progress of the data capture stage. Finally the GUI allows the use of other sensors for hand position tracking (not used for this project).
Internally the GUI code performs the training and prediction of finger and wrist movements considering all the sensors of the device as input data and using the incremental Ridge Regression (iRR) algorithm and its non linear representation, the using Random Fourier Features (iRRRFF) algorithm, as machine learning approaches (explained in the last section of this chapter). Apart of that, the code creates and manage the communication between the Hand Model and the PC using the already mentioned UDP protocol. In this
3.3 g u i 23
way the data used by the code could be sent for visual feedback to the hand model.
This GUI was used for the second part of the thesis that is presented on Chapter5.
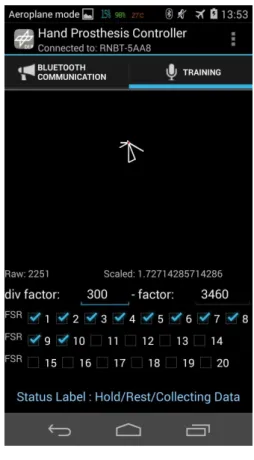
3.3.2 Mobile phone GUI
The code for this approach was developed in the Xamarin Studio software, which allows the development of Android applications using C# (and other languages) syntax, so the code structure previously done could be used for the mobile phone application.
This GUI, shown on Figure9, is a simplified version of the PC one, mainly because of the mobile phone limitations (processor speed, screen size). Its advantage over some previous C# codes is that this GUI was designed spe-cially for the wireless device, which main purpose was the use not only of the sEMG sensors but also of FSRs, that is why the interface included some features for the FSR management.
Figure9: Mobile phone GUI
The GUI has, as the PC one, a radial plot for sensor readings, a list for the actions selection, the modifiable number of repetitions, the storing feature, and some text labels showing instructions for the user. Internally the training and prediction were performed using the same iRRRFF approach.
The difference compared with the PC GUI, as was mentioned, is the pos-sibility to manage in different ways both kind the sensors. First of all the
user can select the number of sensors and which of them are FSR. It is im-portant to differentiate them due to the inverse behavior compared with sEMG, so then can be applied some kind of signal conditioning to convert the FSR signals to a similar behavior compared with the sEMG ones. Thanks to the sensors selection features, the bracelets can be customized, changing the number of sensors on them or their arrangement. While the system is used in the training stage, there is a stimulus signal generated, that repre-sents the movement that is followed by the user. This signal has as elements as DOF (12in this case), and the element’s values go from0to1.
The drawback of this interface, at least when it was used for this project experiments, was the lack of visual feedback for the user. First of all there was not a display of previous repetitions (as in the PC GUI), also there was not possible the connection with the PC to move and work with the 3D Hand Models. The only visual feedback was the normal sensor data polar plot, and the text labels indicating the movement to perform. This fact could produce some uncertainty in the measures, nonetheless this uncertainty is reduced depending the user performance. After all this lack of visual feed-back did not affect the experiment performance, as will be explained in the next chapter.
This GUI was used for the development of the experiment presented on Chapter4.
3.4 m a c h i n e l e a r n i n g
There has been used a machine learning approach to predict the prosthesis movements for a number of hand prosthesis works, experiments and papers in DLR, this approach is the incremental Ridge Regression Random Fourier Features (iRRRFF), already introduced on Chapter2. In order to understand how it is applied to hand prosthesis control, it is necessary to start with the Ridge Regression(RR) approach.
RR is a regularized variant of least squares regression. It builds a linear output model of the form:
f(x) =wTx (1)
where x represents the input space (sensors values) and w is a weighting vector, trained from a set of input/target pairs (training set) previously col-lected. The way to trainwfollows the next equation:
w= (XTX+λI)−1XTy) (2)
HereXdenotes the input training set, andyis a vector collecting the target values for each collected sample, this vector is considered as the ground truth and is obtained by the stimulus values gotten in the training stage. The regularization coefficientλis normally set at a standard value of 1.[29]
One of the motivations found to use RR algorithm is that it allows incre-mental updates (from this fact the increincre-mental name of the algorithm) of the model without the storage of any training samples. A more detailed
expla-3.4 m a c h i n e l e a r n i n g 25
nation of the RR algorithm (specially the incremental part) could be found in Gijsberts et al. [14].
For sEMG and FSR prediction, a linear approach is not enough, so RR is limited due its linearity, this limitation is overcome by using the Random Fourier Features applied to least squares regression (in this case the regular-ized RR)also already explained on Chapter2.
The goal of this improvement is to perform the algorithm implicitly in a n-Dimension feature space, using for that kernel functions. As standard kernel functions(Radial Basis Function for instance) requires high computa-tional time due to its potentially infinite dimension, a solution found was to perform a finite dimensional feature mapping.Rahimi and Recht [28] ap-plied this strategy and proposed to take a finite number of random samples in the Fourier domain.
The Random Fourier Feature is represented by:
φ(x) =cos(ωTx+β) (3)
It produces an unbiased estimation of a kernel ifωis drawn from a normal distribution with mean1and ifβis drawn from a uniform distribution from 0to2π. Furthermore thisωvalue could be scaled by a learning architecture parameterσ, that can be tuned for a better algorithm performance. Anyway, such as theλparameter, normallyσis set at a value of1.
To make RR non-linear, should be replaced the input vector (x,X from equations1 and2) with its projectionφ(x), so the new, and final equations for RR involving RFF are:
f(x) =wTφ(x) (4)
4
Q U A L I TAT I V E A N A LY S I S O F F M G
A N D S E M G S I G N A L S A N D D E V I C E
U S E R E X P E R I E N C E
This chapter presents the first experiment performed, which main goal was to analyze the properties and features of each of the sEMG and FMG sig-nals. The chapter shows a brief introduction, then the experiment definition, followed by the experiment results and a discussion of the results.
This first experiment was designed to perform a qualitative analysis of each kind of sensor signal, so the next goals can be accomplished: Identify specific characteristics for each kind of signal, analyze the separability of different hand and wrist movements according to each kind of sensor and define pros and cons of each signal for future prosthetic control applications.
Along with the qualitative analysis, another goal of the experiment was the analysis of the subject experience using the wireless device presented in the previous chapter. This experiment was the first time the device was tested on subjects. An important point was to get to know about how the subjects feel during the experiment and how they evaluate their experience. The output of this user study provides information, if further experiments on this topic can be performed using the wireless device.
For the posterior analysis, the most important data were the raw sensor values and the stimulus ones (the ground truth of the movements performed by the user). The reasons, and how were used this values, are explained later in this chapter. The experiment was applied and guided by the author of this thesis (experimenter). Furthermore the work presented on this chapter is part of a paper submitted for publication [8].
4.1 e x p e r i m e n t 1 d e f i n i t i o n
The experiment was applied to ten intact subjects, nine of which were right-handed. Summarizing, the subjects were 3 females and 7 males, with an average age of 28±7 years old, an average weight of 72.4±9.91 kg, and an average height of 177.8±12.14 cm tall. Each subject received a detailed description of the experiment, both in oral and written form. In order to support the experiment for publication, an informed consent was signed from all participants. Also for the experiment support, as the experiment is using sensors for bio-signals acquisition, it must be approved by the DLR’s Ethical Committee.
The experiment consisted on performing a sequence of wrist and hand movements ten times: wrist flexion, wrist extension, wrist pronation, wrist supination and power grasp (already explained on Chapter 2), with a rest stage at the end of each repetition task set. Each movement could be fol-lowed by the subject using the polar plot from the cell phone GUI, addition-ally the experimenter was always paying attention, in case the subject was not performing correctly the tasks. For this experiment, the sensors were separated in two different bracelets, the first one with ten sEMG sensors, po-sitioned on the left forearm and the second one with10FSRs, positioned on the right forearm. The bracelets were located approximately10cm below the subject’s elbows. After the bracelets attachment, the subject was asked to sit in a relaxed position with their forearms over their thighs and the hands in a lateral position (with the palms looking towards each other); the experiment movements had to be performed in a bilateral way (Figure10).
The user experience was measured using: The System Usability Scale (SUS) [3], the NASA Task Load Index [22] and a modified version of the rework of the Microsoft Desirability Toolkit by David Travis [34].
4.1 e x p e r i m e n t 1 d e f i n i t i o n 29
Figure10: Device setup for experiment performance.
The SUS consists of ten questions (Appendix) with answers represented on a5 point Likert scale (1 - strongly disagree to 5 - strongly agree). For this experiment were used the statements just as Brooke proposes, except for one. TheI think that I would like to use this system frequentlystatement was changed byI felt comfortable with the device.
As can be noticed, the even statements are negative focused and the odd ones are focused in a positive way. Due to this fact, the scoring is performed in a different way depending the statement. For the positive statements, from the original score, there must be subtracted one point. For the negative ones, the original score must be subtracted from 5. With this score method, the scoring in this survey is such that the answers to thestrongly agreepositive questions and to the strongly disagree negative questions generate a higher impact over the final score.
The NASA Task Load Index provides an overall task workload score on six subscales: Mental, Physical and Temporal Demands; Own Performance, Effort and Frustration. For each subscale, one question was asked in a way, such that the answer could be in a range of21points, reaching fromvery low to very high (except in the 4th question, Own Performance, that goes from perfectto failure). The questions are showed on the Appendix. In the exper-iment results the scores are shown in a percentage way, so the higher the value is, the higher the workload is. All the subscales were considered with the same importance weight.
Travis’s survey is based on the idea that, according to him, the surveys pre-sented previously are not reliable, mainly because of the user predisposition to answer in a positive way to help the experiment results or to show that he or she had a good experiment performance. The survey is based on the Microsoft Desirabilty Toolikt, which consists in a series of "reaction cards" with adjectives that could be applied to the system tested; the user is asked to select the five cards that most closely match their personal reactions to the system.
Travis applied a similar questionnaire and saw that the methodology seems to allow the participants to be critical with the system, selecting both positive and negative adjectives.
For this experiment in specific, there were used a list of 75 adjectives in-stead of the cards (most of them based on Travis’s questionnaire), then the subject was asked to choose all the adjectives he or she felt more related with the device. After that, in a more precise selection, the user had to choose only the5most important words and try to give a simple reason about his or her decision. For a complete view of this survey, please consult the Appendix. 4.2 e x p e r i m e n t 1 r e s u lt s
This section displays the results of the first experiment. 4.2.1 Qualitative signal analysis
Using the signals recorded during the experiment, an off-line evaluation was performed after the experiment. The first thing done with the signals, was to apply the same filtering in both of them (3rd order low-pass digital Butterworth filter with a cutoff frequency of 1Hz). This off-line assessment was done usingMATLABsoftware. Figure 11shows typical FSR and sEMG signals obtained while a subject was doing two repetitions of the already explained task set.
Figure11: Typical FSR and sEMG signals obtained from one subject two repetitions
of the instructed hand and wrist movements (wrist flexion, wrist exten-sion, wrist pronation, wrist supination, power grasp and rest).
From Figure11, can be appreciated that the amplitudes obtained for each kind of sensor are comparable, each movement is well separated in time from each other and produces a distinguishable pattern.
It is here where the first big difference between FSR and sEMG signals ap-pears. FSR signals display a better stability over time compared with sEMG
4.2 e x p e r i m e n t 1 r e s u lt s 31
signals, could be said that FSR sginals are presenting a "plateau" shape while each movement was enforced, on the other hand, sEMG signals exhibit the typical oscillating down-ramp pattern due to muscular motor-unit recruit-ment (in other words, sEMG is measuring electrical impulses) [20, 21]. To show in a graphic way this signal stability behavior, in Figure 12 the dif-ference between consecutive samples for 5 repetitions of the wrist flexion movement of one of the subjects is plotted. For this plot are just considered the mean of the5sensors with the highest amplitude, in this way the stabil-ity effect could be better appreciated because there are some sensors that do not have a significant impact compared with others.
As expected, the sEMG sensors show larger oscillations, while FSRs have a more stable behavior, with an almost zero difference.
Figure12: Sensor’s samples difference plot. Five repetitions of the wrist flexion
movement.
Table 1 shows the mean values of the difference signals explained in the last paragraph, those values were calculated for each user, considering only3 repetitions and the3sensors with the highest amplitude of the wrist flexion movement.
Table1: Means and SD of the sensor’s samples difference. Three repetitions of the
wrist flexion movement.
1 2 3 4 5 FSR -3.22E-5±0.0018 0.0002±0.0026 -0.00027±0.0006 -0.001±0.003 0.0013±0.0033 sEMG -0.0018±0.0202 -0.0018±0.0111 -0.0003±0.0019 -1.4E-5±0.0038 -0.0074±0.0144 6 7 8 9 10 AVD±SD FSR 6.2E-6±0.0042 -0.0005±0.0018 -0.0004±0.0016 -0.0012±0.0028 -0.0009±0.0031 0.0024±0.001 sEMG -0.0018±0.0082 -0.0021±0.0037 0.0016±0.0065 -0.0026±0.0082 -0.0039±0.0091 0.0087±0.0054
After this first analysis, was checked the separability between movements signal values for each type of sensor. This feature helps to know how easy
(a) FSR Clusters
(b) sEMG Clusters
Figure13: PCA projection of typical data for each type of sensor.
a machine learning method could classify or predict, as the more separated the movement signals are, the better the performance of the learning method will be.
In Figure13is shown a reduced representation of the sensor values by using Principal Component Analysis (were considered the three most significant sensors from each type, and projected considering each axis as a different
4.2 e x p e r i m e n t 1 r e s u lt s 33
sensor), the values are clustered depending the movement performed and was assigned a different color for each cluster.
It is important to remark that , in fact, the clusters are10-dimensional (num-ber of sensors), so even though in the PCA projection the clusters could be seen separable, in the complete dimension representation they are not. Furthermore, this PCA projection was just performed for visualization pur-poses, for the analysis that will be presented in the next paragraphs, there was used the complete dimensional data.
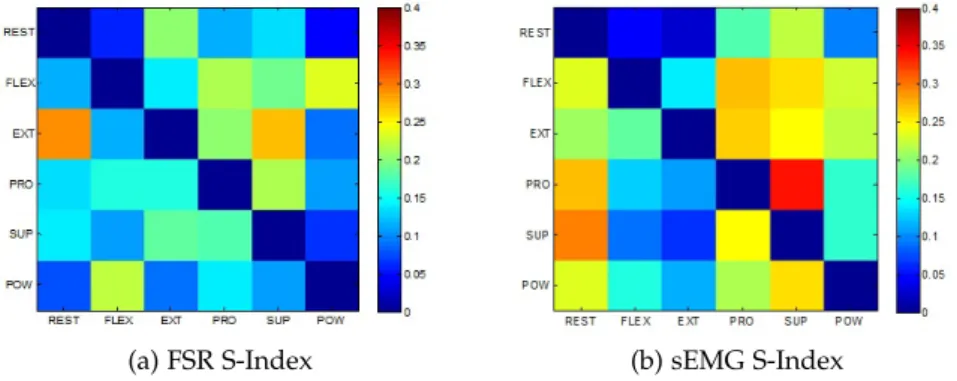
With the idea of separability already explained, there was defined a method for evaluating it and obtain a more quantitative approach. The Safety Index value [31], is based on the idea that the separation between the movement clusters could be defined as the relation between the maximum standard deviation of each cluster and the Euclidean distance between each them. The Safety Indexsij was obtained for each subject and each pair of clusters (Ci,Cj), a precise definition of it is given by the Equation6:
sij= max(σi)
||Ci−Cj||
(6) whereσiis the standard deviation of clusterCiandCis the mean of cluster C.
With Eequation 6 it is implied that the lower the Euclidean distance or the higher the standard deviation, then the closer the clusters could be; the same the other way.
After the Safety Index calculation, the values were arranged in a matrix where the rows represented theCiclusters and the columns theCj ones, of course ifCiandCj are the same movement, the Euclidean distance between them is0so the separation index is undefined. In order to avoid that fact, the Safety Index for same movement pairs was considered as zero. On Table2, the means of all Safety Index matrix values for each subject are shown (the diagonal zero values are not considered for the mean).
All the subjects Safety Index matrices were averaged, so a mean Safety Index matrix was obtained for both, sEMG and FSR sensors. Additionally was obtained the standard deviations of those movement pairs means. To visualize those matrices was used a color-map image, so the darker red the cell, the closer the movements are; on the other hand, the darker blue the cell, the more separate the clusters are (Figure14). The standard deviation values were also visualized in a colormap, so in this way could be evaluated which movements were more different performed by the subjects through the experiment (Figure15).
Finally, the last analysis performed was a prediction performance one. Considering all the sensors data as a data set, it was divided in three sets, the first one just including the FSR data, another one just including the sEMG data, and the third one was the same as the original data set, that means that it was including both kind of signals (called stack approach from now). The learning algorithm chosen for this analysis, was the Incremental Ridge Regression with Random Fourier Features (as was already mentioned in
![Figure 2: Hand and wrist joints movements [ 11 ]](https://thumb-us.123doks.com/thumbv2/123dok_us/10117363.2912283/23.892.305.671.91.546/figure-hand-wrist-joints-movements.webp)