TI 2005-007/1
Tinbergen Institute Discussion Paper
Early Mover Advantages
Govert E. Bijwaard
Maarten C.W. Janssen*
Emiel Maasland
Faculty of Economics, Erasmus Universiteit Rotterdam. * Tinbergen Institute.
Tinbergen Institute
The Tinbergen Institute is the institute for economic research of the Erasmus Universiteit Rotterdam, Universiteit van Amsterdam, and Vrije Universiteit Amsterdam.
Tinbergen Institute Amsterdam Roetersstraat 31
1018 WB Amsterdam The Netherlands
Tel.: +31(0)20 551 3500
Fax: +31(0)20 551 3555
Tinbergen Institute Rotterdam Burg. Oudlaan 50
3062 PA Amsterdam The Netherlands
Tel.: +31(0)10 408 8900
Fax: +31(0)10 408 9031
Please send questions and/or remarks of non-scientific nature to [email protected]. Most TI discussion papers can be downloaded at http://www.tinbergen.nl.
Early Mover Advantages:
An Empirical Analysis of European Telecom Markets
1This Version: December 22, 2004
Govert E. BijwaardMaarten C.W. Janssen Emiel Maasland
Erasmus University Rotterdam Tinbergen Institute
Abstract. In this paper weanalyze empirically whether and if so to what extent later entrants in the European mobile telephony industry have a disadvantage vis-à-vis incumbents and early mover entrants. To analyze this question we consider a series of static models and a dynamic model of market share development. We find a clear early mover advantage, mainly caused by the influence of the penetration rate: it pays to enter when still few people have acquired a mobile telephone. Another important determining factor is the Herfindahl-Hirschman Index at the moment of entry: it is significantly easier to enter a highly concentrated industry. Finally, there are important differences between countries possibly indicating the relative strength of the national regulators. For example, it turns out that it is relatively difficult to enter the mobile telephony sector and gain market share in the Scandinavian countries. Correspondence address: Prof. Maarten Janssen, Department of Economics, Erasmus University, P.O. Box 1738, 3000 DR Rotterdam, Tel. (31)-10-4082341, fax (31)-10-4089149, e-mail: [email protected]
1 The data used for this research are based on the Global Mobile Subscriber Database (GMSD) of the
Informa Group. The data are provided to us by Proximus (Belgacom Mobile) for whom we carried out a research assignment. The results reported here are a revised version of the research for Proximus. We are very grateful to Proximus for letting us use these data and report these results to a wider audience. Bijwaard's research is partly supported by the Netherlands Organisation for Scientific Research (NWO).
1.
Introduction
The idea that in an industry firms may have a first-mover advantage exists in the economics literature for many, many years. Von Stackelberg, for example, showed already in 1934 that in the context of quantity-setting firms a leader (first-mover) is able to get a larger market share and higher profits than a follower (second-mover). There are several reasons why first-mover advantages may arise.2 In the economics (see, e.g., Mueller (1997)) and strategic management (see, e.g., Lieberman and Montgomery (1988)) literature the following factors are mentioned where a distinction is made between factors working on the supply and the demand side. On the demand side, there is the pre-dominant importance of switching cost (Klemperer, 1987a,b). Switching costs can arise (i) from the fact that consumers have to make some initial investment in adapting to a seller’s product or services, (ii) from firm-specific learning on how to use the product (habit formation), or (iii) because of contractual costs imposed by the firm. With switching costs, firms that already exist in the market when consumers still have to make their first choice benefit as later firms have to offer much better deals to convince consumers to switch. Other sources for first-mover advantage on the demand side include network externalities and uncertainty about the quality other firms offer (Schmalensee, 1981). On the supply side, there are similar factors working to the advantage of early entrants in the market, most notably sunk costs and economies of scale (Schmalensee, 1982) and cost efficiencies through learning by doing.
There is also a considerable amount of empirical literature on first-mover advantages, mostly in management and marketing journals (see, e.g., Urban et al., 1986, Kalyanaram and Urban, 1992 and Robinson et al., 1994 for an overview). Typically, this literature studies how market shares at a particular moment in time depend on the firm’s position in entering the market: what is the typical (long-run) market share of the pioneer firm, the second entrant, etc.? These studies are based on cross-sectional data from many different markets. Kalyanaram and Urban (1992) are the first to study
2 Of course, there are also factors pointing at advantages for late entrants in markets. In particular, later
entrants may learn from mistakes of others or may free ride on investments (and advertisement expenditure making the product known by a large group of consumers) made by early entrants. Also, they typically may enter when technological or demand uncertainties are considerably smaller.
a combination of cross-section data and time series. They also consider the impact of factors such as price differences, relative advertising expenditures, relative quality perception, etc. on the development of market shares. Their model allows a comparison in the rate of convergence to an asymptotic market share level by later entrants. Pioneering advantage is also related to the time a firm (or brand) is in the market. Longer lead time, which is the time between entries, should increase this advantage. Two papers by Huff and Robinson (1994) and Brown and Lattin (1994) confirm this for frequently purchased consumer goods and show that the pioneering advantage declines over time with competition. An overview of earlier and later studies can be found in Lieberman and Montgomery (1988, 1998) and in Robinson et al. (1994).
The vast majority of empirical studies finds that market pioneers have substantially higher market shares than later entrants. This strong association between order of entry and market share is questioned by some authors (e.g. Golder and Tellis (1993)). They argue that most of the empirical studies have potential limitations. One such a limitation is the fact that entry is usually treated as an exogenous parameter, whereas timing of entry of a firm might be a choice variable that depends on the perceived market expectations after entry. Moore et al. (1991) extended the Robinson and Fornell (1985) model to allow for the possibility that market entry is endogenous. This paper studies whether early entrants in the European mobile telephony sector have benefited through a long-term larger market share from their pioneering activities. The paper makes three types of contributions. To the best of our knowledge, this is the first paper studying the consequences of the order of entry using data from one particular sector where consumers buy infrequently. A disadvantage of traditional cross-section analysis is the potentially large differences between sectors in the data set. Ideally, one would like to have a (large) number of entrants in one or similar market(s). There are not many cases where such conditions apply. European telecommunication in the 1990s is an exception. In the 1990s telephone services were liberalized in many European countries and with the advent of mobile telephony more and more operators entered the different markets over time. The problem of endogeneity pointed at above does not arise in our case as the timing of entry can (to a large extent) be considered an exogenous variable due to the fact
that firms can only enter the market at times the government was willing to sell additional licenses. The data set we use is unique in the sense that it contains monthly data about market shares in all Western European countries. In the next section, where we describe the data we used for this study in more detail, it will become clear that there are 46 market introductions in this period and that the development of the telecom sectors in the different countries is quite similar to each other. The telecom sector in the 1990s is therefore an ideal case to consider empirically the impact of the timing of entry into a market.
Second, from a policy perspective, the mobile telephony sector has attracted quite a bit of attention. Competition authorities and regulators have tried to ensure that the interests of entrants are well taken care of. A consistent empirical investigation of the success or failure of this policy has, however, been lacking up to this point. We will study in detail how the order of entry has co-determined how the market shares of firms have evolved over time in different countries. Third, because of the nature of our data set, we are able to estimate whether there are systematic differences between the way market shares of entrants develop in different European countries. Therefore, we can answer the question in which countries it is more and less difficult for entrants to enter the mobile telephony market.
The questions we are interested in are the following. What are the main success factors determining the growth in market shares of entrants? In particular, what is the impact of (the growth in) market penetration, measured as the percentage of the population that already has a mobile telephone; and what is the impact of factors such as the number of incumbents and the market concentration at the moment of entry? The main empirical studies we know of the European Telecommunications industry are the two papers by Gruber and Verboven (2001a,b). These papers study a related, but very different question, namely whether the diffusion rate of mobile telephones in a country depends on the degree of competition. They find that that such a positive relationship exists, but that it is relatively weak compared to the national differences in diffusion speed.
The rest of the paper is organized as follows. The next section provides a global description of the development of the main features of European telephony markets and it describes the data set we have. Section 3 discusses the structure of the models we use to analyze the data. In Section 4 we give an overview of the different results and provide an interpretation. Finally, Section 5 concludes.
2. The European Mobile Telephony Markets
In the beginning of the 1990s, most European countries had one incumbent firm offering telephone services to the population.3 Mobile telephony was at its infancy. This incumbent company usually was a state monopolist. At that time European telephony markets were being liberalized and the former state monopolists gradually became privately owned companies with a monopoly position. During the 1990s these companies started offering mobile telephony services and governments started issuing licenses to new companies, sometimes using auctions to allocate the licenses among the interested firms. Each of these licenses entitled the owner to use a certain spectrum band to offer mobile telephony services to its clients. The fact that a license is needed to operate in the market implies that the timing of entry is not a choice variable in the same sense as it is in other markets. Here, the only choice firms have is to enter at a time the government issues new licenses or not to enter at all.
National regulators were given the task to force incumbent companies to allow other firms access to their fixed network (under the so-called essential facilities doctrine) and also to look after the fact that in the mobile telephony sector two-way access was granted so that subscribers to one network could easily call subscribers to other networks at fair prices (see, e.g., Cave et al., 2002). One of the goals the national governments had set for the mobile telephony sector was to create a situation where firms with their own network could compete with one another so that the regulation problem of creating access to the fixed telephony network of the incumbent firm would not arise. Apart from firms with their own network, nowadays most countries
3 France and the U.K. had already two mobile operators in 1990; Greece had none. In Greece and the
UK, two firms started simultaneously, so in these two countries there were two incumbent firms. In UK: BT and Vodafone started both in January 1985. In Greece: TIM and Vodafone started both in July 1993.
also have active mobile virtual operators that roam on the network of others to offer their services to clients.
When the market for mobile telephony services gradually took off (see also Figure 1), it were primarily businesses that formed the clientele. Consumers entered the market only more towards the end of the 1990s in most countries. The start-up of consumer markets has lead to a dramatic increase in the penetration rate around the turn of the millennium. The agents on the demand side that create, however, the largest telephone traffic (the businesses) usually chose to buy their mobile telephony services from the incumbent parties or the very early entrants. Moreover, later entrants4 needed time to build a reliable network with country-wide coverage, creating temporary quality differences at the time the later entrants entered the market.
Switching costs and network effects may explain early entrants dominance in the mobile telephony markets in the following way. Switching cost arise in several ways. First, for a long time firms were able to prevent number portability so that consumers could not continue to use their “own” telephone number when switching firms. The time and effort it takes to inform friends or business relations of the change in number is a considerable switching cost, certainly for the larger users. In most countries, national regulators were able to enforce number portability in recent years, so that this type of switching costs does not exist anymore. However, other forms of switching costs continue to be prevalent, most notably the terms of the subscription contracts (one to two years) and the time it takes to adapt to a firm’s services. Because of the switching costs, one may expect that there is a premium to entering the market when the penetration rate is still low.
Network effects prevail for two reasons. First, on the supply side the sector’s technology is one with large fixed costs (the cost of creating and maintaining a network) and very small marginal costs. Hence, if all firms are equally efficient, the firm with the largest market share has the lowest average cost. This firm therefore may price below its competitors thereby further increasing its market share. A larger
4 Entrants are certainly not necessarily weak parties. The European market is populated with relatively
few firms that compete in several countries. Therefore, a later entrant in one country typically is an incumbent firm in another country.
firm also has more possibilities to invest in its network thereby offering a more reliable service. A second source of network effects arises in some countries where firms are allowed to charge different prices for calls terminating on their own network and calls terminating on the network of others. This pricing strategy may induce consumers to subscribe to the firm where most friends are also subscribed to.
2.1. Description of the data
In this subsection we describe the data we used for our analysis. We have selected the following sixteen European countries to work with: Austria, Belgium, Denmark, Finland, France, Germany, Greece, Ireland, Italy, Netherlands, Norway, Portugal, Spain, Sweden, Switzerland, and the United Kingdom. These are the larger countries in which there are at least two mobile operators active in the market. In most other countries, such as in Luxembourg and other smaller countries, no market introductions have taken place. For each country, the data set contains information on: market penetration (the percentage of the population that has a mobile telephone), the number and names of the active operators and their market shares. No information is available on other potential relevant factors such as the prices that the companies charge for their services.5
Since 1991, forty-four introductions (new operators that enter the market) have taken place in these countries (two incumbents, forty-two entrants). The tables presented in the appendix provide the names of incumbents and entrants in different countries, in total sixty-one telecom operators. For the years 1998 – September 2004 we have monthly data at our disposal. For the years 1990 - 1997 only yearly data (of December each year) are available. The data set contains market shares of those companies that have their own network, leaving the mobile virtual operators that subcontract the use of a network out of the dataset. We have revised the data with respect to measurement errors or other improbable data. As for our dynamic analysis (see Section 4 below) a time series of sufficient length is necessary, we have carried out an interpolation of the yearly data for the years 1990 up to 1997 to get an approximation of the monthly figures. This has been done for both the penetration rate and for the market shares.
5 If price data were available, these were very difficult to use, as most companies offer an extensive
Details on the data on penetration rates and markets shares and the interpolation methodology used, will be discussed below.
Penetration rate
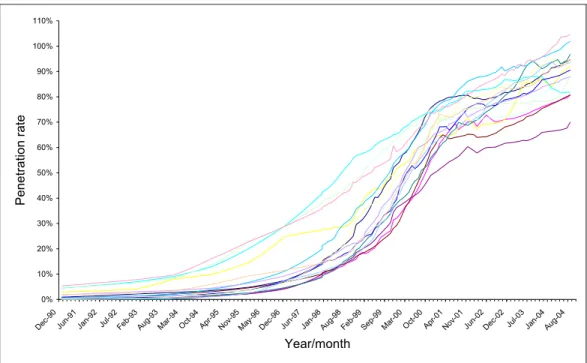
The penetration rate in the different countries is depicted in Figure 1 as a function of time. Each country is described by a different curve. The three countries where mobile telephony took off at a distinguished earlier moment are the three Scandinavian countries, Finland, Norway and Sweden.
0% 10% 20% 30% 40% 50% 60% 70% 80% 90% 100% 110% De c-90 Ju n-91 Ja n-92 Jul-9 2 Fe b-93 Au g-93 Mar-94Oct-94Apr-9 5 No v-95 Ma y-96 De c-96 Jun-97Jan-98Au g-98 Feb-9 9 Se p-99 Mar-0 0 Oct-0 0 Apr-01No v-01 Jun-02De c-02 Jul-0 3 Jan-0 4 Au g-04 Year/month Pe netration ra te
Figure 1. Development of penetration rate in different countries
The picture suggests that the development of the penetration rate over time follows the familiar S-curve (see also Gruber and Verboven (2001a,b) for the European Mobile Telephony Markets). It also shows that the development in each country follows a very similar pattern. The missing monthly data over the period 1990-1997 are therefore for each country and each successive year interpolated on the basis of this curve (or logistic approach).6
6 For this approach two parameters are needed, a constant and a parameter that measures the time
effect. From the observed penetration rate in, for example, ultimo 1991 and ultimo 1992, the constant and the time effect for the interpolation over this period can directly be derived by equalizing the function on time 12 (the time is in months and the time is set to 0 for ultimo 1990) to the observation of
Market shares
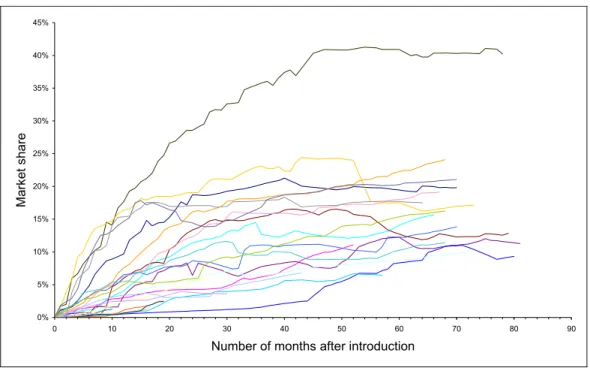
For each entrant we have analyzed how its market share develops over time, from the moment of introduction onwards.7 The developments in market shares measured in this way are depicted in Figure 2. One can easily see that an average firm’s market share increases most steeply immediately after entering the market. Moreover, a rough first impression suggests that the increase in market shares flattens off to become more or less stable after approximately 40 months after entry. The figure also shows that one entrant has been particularly successful. This is the Greek firm Cosmote. Cosmote is the only mobile telephone company in Europe that is (i) a subsidiary of the former state monopolist and national incumbent in the fixed telephony market and (ii) not the first entrant in the mobile market. Apart from the possibility that Cosmote had a particularly successful marketing strategy,8 these facts may explain its unusual development.
0% 5% 10% 15% 20% 25% 30% 35% 40% 45% 0 10 20 30 40 50 60 70 80 90
Number of months after introduction
Ma
rk
et
share
Figure 2. Development of market shares (introduction from 1998 onwards)
For the dynamic analysis, market share data are interpolated over the years 1990 – 1997 in an indirect way. Because the sum of the market shares (per country) has, by the penetration rate (in the respective country) on ultimo 1991, and the function on time 24 to the penetration rate on ultimo 1992.
7 The moment of introduction starts when the number of subscribers becomes positive.
definition, to be equal to 1 we interpolate the market shares indirectly, namely by interpolating the number of subscribers of an operator. From the number of subscribers to a firm’s network, the firm’s market share can easily be derived by dividing through the total number of active users at a particular point in time.
3.
The Models
In order to investigate the impact of the number of incumbents and the penetration rate on the development of market shares of entrants, we have investigated two types of models: (i) a series of static models and (ii) a dynamic model.
The analysis of the static models is restricted to the period over which we have monthly data available. Instead of directly investigating the developments in market shares, we analyze how the number of costumers of the entrants expressed as percentage of the total population depends on the number of entrants and the change in the penetration rate. We have chosen to do this for the following reason. Because of the presence of switching cost, we are mainly interested in which percentage of the new adopters (those who first buy a subscription to mobile telephony) will buy from the entrant. By choosing the explanatory variable in this way, the estimated coefficient for the change in penetration rate measures exactly how large this percentage is.
We have carried out these static analyses at different moments in time to get an idea of the development over time: 1, 2 and 3 months after introduction, and then 6, 12, 18, 24, 30 and 36 months after introduction.
The linear model we use is as follows:9
i t i t t it p x n =ξ1 +ξ2∆ +ξ3 where: it
n : the number of costumers of entrant i expressed as a percentage of the total population at time t;
9 In the dynamic analysis we also include the Herfindahl-Hirschman Index as an explanatory variable.
∆pit : the change in penetration rate measured from the moment of
introduction of firm i to t months after introduction; the variable takes on values between 0 and 1;
xi : the number of incumbent parties at the moment of market
introduction of firm i;10
s
'
ξ : parameters.
The parameters in this linear model are easily interpretable. As explained above, ξ2t measures the percentage of new adopters since the moment firm i entered the market that have chosen to buy mobile telephony services from firm i. The parameter ξ3t measures the impact of one additional incumbent on the percentage of the population that has chosen to buy mobile telephony services from firm i since the moment firm i
entered the market.
The dynamic analysis attempts to explain the course of development of the market share over the time a firm is present in the market place. To understand the model used, it is useful to reconsider the data presented in the previous section (Figure 2). Figure 2 shows that the market shares do not increase linearly over time. Instead, market shares first increase more rapidly (in the first months after market introduction). Subsequently, the increase in market share slows down and after some time a more or less stable market share is reached. To capture this aspect of the development in the empirical analysis we propose a non-linear model in the spirit of Kalyanaram and Urban (1992). In such a model two parameters are crucial: the ultimate level the market share finally reaches and the speed with which the market share converges to this level. The model below is one of the simplest mathematical expressions that captures these two aspects:
), 1 ( t i it e i m =
γ
− −β where: itm : the market share of firm i t months after introduction, taking on values between 0 and 1;
t : time measured in months after introduction;
10 When another firm has entered before firm i we have treated this firm as an incumbent firm no
β, γ : parameters that may differ between different firms.
The parameter γi has a clear interpretation: it is the ultimate level to which the market
share of firm i converges. The parameter β determines the speed of convergence. In the dynamic analysis we have these parameters being determined by a number of exogenous factors. For γ we have chosen the following specification:
i i i i p mm c p i =e + + 3 + 2 2 1 α α α γ , where:11
p : the penetration rate at the moment of introduction; the variable takes
on values between 0 and 1;
mm : the Herfindahl-Hirschman Index at the moment of market
introduction, measuring market power, taking on values between 0 and 1;
c : a dummy variable for each country;
α : parameters.
We have chosen an exponential functional form for γ to assure it is always positive. We also introduced both the penetration rate itself as the penetration rate squared. One would expect a negative relationship between market penetration rate at the moment of entry and ultimate market share. The relationship may, however, be non-linear, as the size of this negative relationship may become much stronger when market penetration rate is already quite large at the moment of entry. Moreover, it may be that there is an optimal moment (read: optimal penetration rate) to enter the market. This may be the case when α2 is negative and α1 is positive. The country dummy
measures the fact that the institutional environment may make market entry much easier in one country than in another.
For β we have chosen the following specification: it tt i = β1+β2mm +β3∆p β , where:
11 Because of the high degree of correlation between the number of incumbents and the
it
mm : the Herfindahl-Hirschman Index at time period t measured after entry of player i;
it p
∆ : the change in penetration rate measured from the moment of introduction;
β’s : parameters.
This specification allows the convergence speed to the ultimate market share to depend on the development of the Herfindahl-Hirschman Index over time and on the change in penetration rate. One would expect the Herfindahl-Hirschman Index to have a positive impact on the speed of convergence: it is easier to enter a more concentrated industry. The change in penetration rate also should have a positive impact on the speed of convergence: The more the penetration rate has changed, the more new consumers in the market and the easier it is to gain market share.
The specification above is very flexible. It takes the smoothing of the growth of the market shares over time into account. Furthermore, the Herfindahl-Hirschman Index determines both the speed of growth in market share of firms as well as the level of the ultimate market share. The penetration rate at the moment of introduction co-determines to what level the market share of a firm can grow, and the change of the penetration rate in a certain month co-determines how fast the market share of a firm in that month grows. Finally, we introduce country dummies to measure country specific differences, most notably the impact the national regulators have in protecting the interests of entrants. In the next section we will estimate the size of these effects on the basis of the data.
4. Analysis
In the first two subsections of this section we discuss the empirical results we obtained from estimating the two alternative models. The last subsection discusses in detail the question whether a potential simultaneity issue is hidden in the analysis. In particular, it may be that changes in market penetration not only determine the growth in market share of an entrant, but also that the very fact that a new party enters the market may have a positive impact on changes in market penetration. As we do not
have enough data on other potentially relevant variables, we cannot estimate a simultaneous model where the mutual dependence is modeled. The last subsection therefore discusses an instrumental variable method to deal with this issue.
4.1. Analysis of the static models
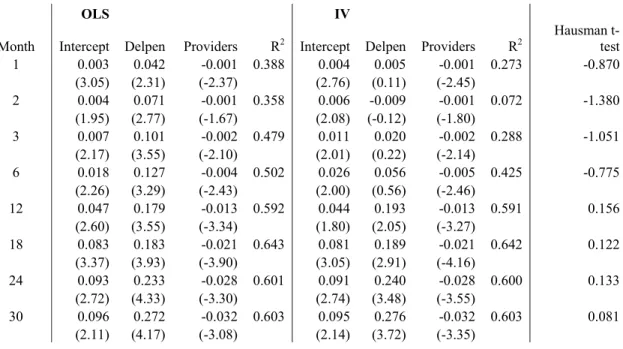
We start the analysis by estimating the parameters of the static models at different durations after entry. The results are given in the “OLS column” of the table below.
Estimation results of static analyses
OLS IV
Month Intercept Delpen Providers R2 Intercept Delpen Providers R2 Hausman t-test
1 0.003 0.042 -0.001 0.388 0.004 0.005 -0.001 0.273 -0.870 (3.05) (2.31) (-2.37) (2.76) (0.11) (-2.45) 2 0.004 0.071 -0.001 0.358 0.006 -0.009 -0.001 0.072 -1.380 (1.95) (2.77) (-1.67) (2.08) (-0.12) (-1.80) 3 0.007 0.101 -0.002 0.479 0.011 0.020 -0.002 0.288 -1.051 (2.17) (3.55) (-2.10) (2.01) (0.22) (-2.14) 6 0.018 0.127 -0.004 0.502 0.026 0.056 -0.005 0.425 -0.775 (2.26) (3.29) (-2.43) (2.00) (0.56) (-2.46) 12 0.047 0.179 -0.013 0.592 0.044 0.193 -0.013 0.591 0.156 (2.60) (3.55) (-3.34) (1.80) (2.05) (-3.27) 18 0.083 0.183 -0.021 0.643 0.081 0.189 -0.021 0.642 0.122 (3.37) (3.93) (-3.90) (3.05) (2.91) (-4.16) 24 0.093 0.233 -0.028 0.601 0.091 0.240 -0.028 0.600 0.133 (2.72) (4.33) (-3.30) (2.74) (3.48) (-3.55) 30 0.096 0.272 -0.032 0.603 0.095 0.276 -0.032 0.603 0.081 (2.11) (4.17) (-3.08) (2.14) (3.72) (-3.35) Delpen: change in penetration rate
t-value between brackets
Table 1. Estimation results of static analyses
There are some important results that attract the attention. First, all the estimated parameters have the expected signs: changes in the penetration rate have a positive impact, while the number of incumbents has a negative impact on the relative number of consumers an entrant is able to attract. More incumbents imply more competitors and therefore a smaller share of consumers choosing for the entrant. On the other hand, it is much easier to attract consumers who are choosing their first mobile phone operator than inducing consumers to switch operators. Therefore, when many new
consumers are entering the market it is easier to gain market share than when the change in penetration rate is low. Almost all parameter estimates are significantly different from zero and, although the model is relatively simple and it was not possible to include an important factor such as price (due to non-availability of data), the model is able to explain a large fraction (between 50 and 60% for the analysis from 6 months onwards) of the fluctuations in the data.
Most striking is that the parameter values increase with the time span considered after entry. Right after entry an entrant is on average able to get 4% of the new consumers, while two years after entry an average entrant is able to get more than 25% of the new consumers who have started to use mobile telephones since the date of entry. This increase in the ability to attract new users can be explained by referring to two factors. First, entrants usually need some time to build up a complete network with a nation-wide coverage. In the beginning of their existence, they therefore do not offer the same quality and during this period consumers will prefer one of the incumbent operators that already have an optimal coverage. A second reason may be that also for entrants it is important to build up reputation, which simply takes time. We do not find evidence of a “shock therapy”, according to which entrants have to attract their costumers in the first months after entry.
The impact of the number of incumbents grows from a negligible number to an effect of a 3% reduction for each additional incumbent. This means that other things being equal the difference in ability to attracting new clients between a first entrant (2nd player in the market) and a third entrant (4th player in the market) is just 6%. Of course, another important difference between the first and third entrant is the fact that the penetration rate at the moment of market entry is higher for the third entrant. Given the estimations on the impact of changes in penetration rate, we conclude that the change in the penetration rate is more important than the number of incumbents in the market.
4.2. Analysis of the dynamic models
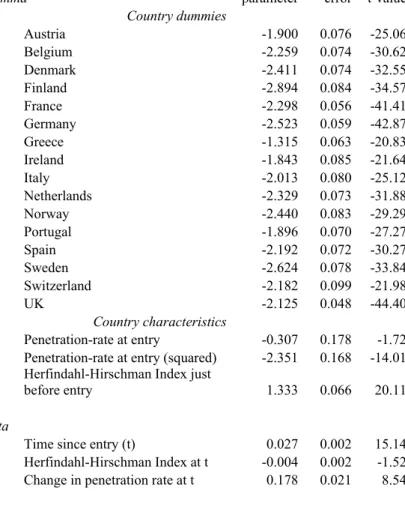
The estimates of the dynamic model give additional insight in the development of market shares. The results are reported in Table 2 below.
Gamma parameter error t-value std Country dummies Austria -1.900 0.076 -25.06 Belgium -2.259 0.074 -30.62 Denmark -2.411 0.074 -32.55 Finland -2.894 0.084 -34.57 France -2.298 0.056 -41.41 Germany -2.523 0.059 -42.87 Greece -1.315 0.063 -20.83 Ireland -1.843 0.085 -21.64 Italy -2.013 0.080 -25.12 Netherlands -2.329 0.073 -31.88 Norway -2.440 0.083 -29.29 Portugal -1.896 0.070 -27.27 Spain -2.192 0.072 -30.27 Sweden -2.624 0.078 -33.84 Switzerland -2.182 0.099 -21.98 UK -2.125 0.048 -44.40 Country characteristics Penetration-rate at entry -0.307 0.178 -1.72
Penetration-rate at entry (squared) -2.351 0.168 -14.01
Herfindahl-Hirschman Index just
before entry 1.333 0.066 20.11
Beta
Time since entry (t) 0.027 0.002 15.14
Herfindahl-Hirschman Index at t -0.004 0.002 -1.52
Change in penetration rate at t 0.178 0.021 8.54
(Pseudo-R2) 0.9740
Table 2. Estimation results for the dynamic model
We first look at the variables that explain the level to which the market shares eventually converge. A first striking factor is that the impact of the penetration rate is highly non-linear. There is very little difference between entering the market when the penetration rate is 10 or when it is 20%. However, when the penetration rate becomes quite large, the ultimate market share to be reached is very small. This follows from the large negative estimated impact (-2.35) of the squared penetration rate and the relatively low estimated impact (-0.3) of the penetration rate itself. To get some idea of the impact of the penetration rate on the ultimate market share compare (ceteris paribus) two situations, the first being a situation where a firm enters when the
penetration rate is 10%, the other when it is 70%.12 In the first situation the entrant will get an estimated ultimate market share of 19.8%, whereas it will only reach a market share of 5.3% in the second situation.
A second important fact is that the market concentration measure (HHI) is positive and highly significant vindicating the idea that it is much easier to enter and gain market share in a highly concentrated market than when there are a few firms competing with each other. To get an idea of the size of this effect compare again (ceteris paribus) two situations. In the first situation a firm enters when there is one incumbent firms and the HHI is 1, the second where there are already 3 active parties and the HHI is 0.4.13 The estimated ultimate market share in the first case is 34%,
whereas it is just 15.4% in the second case
Finally, the difference between countries is quite striking. The average parameter value of the country dummies is approximately –2.1. Some countries (most notably the Scandinavian countries) have much lower estimates, implying that entrants have a hard time gaining market share, possibly due to different types of policies the regulators have to protect the interest of entrants. In other countries (most notably Austria, Greece,14 Ireland and Portugal) it is much easier for entrants to gain market share. To see the impact of the difference in countries compare a country (such as Austria, Ireland and Portugal) with a country dummy of -1.8 and a country (such as Sweden) with a country dummy of -2.6. A firm that enters these countries at the same point in time, e.g., when the penetration rate is 30% and the HHI is 0.4, gets an ultimate market share of 20.8%, respectively 9.3%.
Concerning the speed of convergence, it is interesting to observe that the Herfindahl- Hirschman Index is not significant. Apparently, besides its important impact on the ultimate market share, this index does not play a significant role in determining the speed of convergence. All other estimated parameters have the expected sign and are significantly different from zero.
12 Assume an average country (dummy constant -2.1) and the HHI being 0.4.
13 Assume an average country (dummy constant -2.1) and the penetration rate being 30% in both cases.
Another way to interpret the results is by simulating the development of market shares over time in a controlled situation. Figure 3 below considers a country where a first entrant enters the market when the penetration rate is 5%, a second entrant enters when the penetration rate is 22% and the HHI is 0.58, a third entrant enters when the penetration rate is 40% and the HHI is 0.38 and a fourth entrant enters when the penetration rate is 53% and the HHI is 0.29. The moment of entry of the respective parties can be read from the figure. One can easily see from the figure that the first entrant is still able to gain quite a large market share and in the long run approach the market share of the incumbent. Later entrants, however, stay at much lower market shares. 0% 10% 20% 30% 40% 50% 60% 70% 80% 90% 100% 20 25 30 35 40 45 50 55 60 65 70 75 80 85 90
Months since Pioneer's entry
Market sha re Pioneer 2nd provider 3rd provider 4th provider 5th provider
Figure 3. Market shares by order of entry 4.3. Corrected estimates in case of endogeneity
We finally address the possibility of endogeneity between the changes in the penetration rate and the growth of market share of entrants.15 If endogeneity is present the error term of the equation is not independent of the value of the penetration rate anymore. Without correcting for endogeneity the estimated parameters, especially the one measuring the effect of the change in penetration rate, may be biased. A method to deal with (possible) endogeneity is to build a system of equations, one for the
market share and one for the penetration rate, and estimate its parameters simultaneously. Unfortunately, due to a lack of data about other potentially relevant variables, it is impossible to build such a system of equations and estimate its parameters. Given our data set, this inevitably would lead to identification problems of parameters.
Another method to correct for possible endogeneity is to use an Instrumental Variable (IV) method.16 If the change in the penetration rate is truly exogenous the OLS-estimator is unbiased and efficient. Although the IV-OLS-estimator is then also unbiased it is less efficient. If, however, endogeneity is a problem the OLS-estimator is no longer unbiased, while the IV-estimator remains unbiased. Based on two such estimators, where one estimator is unbiased and asymptotically efficient under the null hypothesis of no endogeneity, but biased and inconsistent under the alternative hypothesis of endogeneity, and the other estimator is consistent both under the null and the alternative hypotheses, Hausman (1978) suggests a simple test on endogeneity. The test exploits that if the regression equation is extended to include one additional variable that represents the projection of the potential endogenous change in penetration rate on its instruments an (OLS) estimator of the coefficient of this extra variable will be equal to zero if the penetration rate is exogenous. A test on endogeneity is, therefore, a student’s t-test on the significance of this extra variable. As an instrument/proxy for the (possible) endogenous change in the penetration rate in country X where a new introduction has taken place we used the average change in penetration rates in other countries from the moment the penetration rate is equal to the penetration rate in country X.
Table 1 reports the results in the “IV column”. It appears that the IV-estimates are different from the OLS-estimates for the first few months, but not for later months. The last column of the table gives the Hausman t-values of the coefficient of the extra variable. As all the Hausman t-values are below 2 the null hypothesis cannot be rejected, implying that although the IV-estimates for the effect of a change in penetration rate seem to differ in the first 3 months after entry, the Hausman test does not reject the exogeneity of the change in penetration rate for these times. We
16 Loosely speaking: A good instrument is (highly) correlated with the variable it instruments but not
conclude that endogeneity is not an issue. As the OLS-estimates are unbiased and efficient in this case, these estimated values seem to be the most reliable. As endogeneity in the sense of this Section does not seem to be a problem, we do not have to adjust our dynamic analysis either.
5. Discussion and Conclusion
In this paper we have analyzed empirically to what extent later entrants in the European mobile telephony industry have a disadvantage vis-à-vis incumbents and early mover entrants. To analyze this question we have considered a series of static models and a dynamic model of market share development. In each of the static models, we have regressed the percentage of new users an entrant is able to acquire on the number of incumbents at the moment of entry and the change in penetration rate from the moment of entry onwards. We find strong evidence for early mover advantage. The advantage is, however, mainly caused by the influence of the penetration rate: it pays to enter when still few people have acquired a mobile telephone. In the dynamic model, we explain the market share in each month by factors such as changes in the penetration rate, the Herfindahl-Hirschman Index at the moment of entry and a country dummy. All variables that explain the ultimate market are highly significant. As expected it is significantly easier to enter (i) when the penetration rate is still quite low and (ii) in a highly concentrated industry. We also find important differences between countries possibly indicating the relative strength of the national regulators. It is, for example, relatively difficult to enter the mobile telephony sector and gain market share in the Scandinavian countries. We also provide indications for the size of the different effects. Depending on the specific conditions of entry, it seems fair to conclude that the first entrant may still gain a large market share, but that subsequent entrants have much more difficulties gaining market share.
References
Brown, C. L., and J. M. Lattin (1994) Investigating the Relationship between Time in Market and Pioneering Advantage, Management Science, 40(10), pp. 1361-1369. Cave, M., S. Majumdar, and I. Vogelsang (eds.) (2002) Handbook of Telecommunications Economics, Amsterdam: Elsevier Science.
Golder, P. N., and G. J. Tellis (1993) Pioneer Advantage: Marketing Logic or Marketing Legend, Journal of Marketing Research, 30(2), pp. 158-170.
Gruber, H., and F. Verboven (2001a) The Diffusion of Mobile Telecommunications Services in the European Union, European Economic Review, 45(3), pp. 577-588. Gruber, H., and F. Verboven (2001b) The Evolution of Markets under Entry and Standards Regulation – The Case of Global Mobile Telecommunications,
International Journal of Industrial Organization, 19(7), pp. 1189-1212.
Hausman, J. A., (1978) Specification Tests in Econometrics, Econometrica, 46(6), pp. 1251-1272.
Huff, L. C., and W. T. Robinson (1994) The Impact of Leadtime and Years of Competitive Rivalry on Pioneer Market Share Advantages, Management Science, 40(10), pp. 1370-1377.
Kalyanaram, G., and G. L. Urban (1992) Dynamic Effects of the Order of Entry on Market Share, Trial Penetration, and Repeat Purchases for Frequently Purchased Consumer Goods, Marketing Science, 11(3), pp. 235-250.
Klemperer, P. D. (1987a) Markets with Consumer Switching Costs, Quarterly Journal of Economics, 102(2), pp. 375-394.
Klemperer, P. D. (1987b) Entry Deterrence in Markets with Consumer Switching Costs, Economic Journal, 97(Conference 1987), pp. 99-117.
Knyphausen-Aufseß, D., C. Krys, and L. Schweizer (2002) Attacker’s Advantages in a Homogeneous Market: The Case of GSM, The International Journal on Media Management, 4(4), pp. 212-224.
Lieberman, M. B., and D. B. Montgomery (1988) First-Mover Advantages, Strategic Management Journal, 9, pp. 41-58.
Lieberman, M. B., and D. B. Montgomery (1998) First-Movers (Dis)Advantages: Retrospective and Link with the Resource-Based View, Strategic Management Journal, 19(12), pp. 1111-1125.
Moore, M. J., W. Boulding, and R. C. Goodstein (1991) Pioneering and Market Share: Is Entry Time Endogenous and Does It Matter?, Journal of Marketing Research, 28(1), pp. 97-104.
Mueller, D. C. (1997) First-Mover Advantages and Path Dependence, International Journal of Industrial Organization, 15(6), pp. 827-850.
Robinson, W. T., and C. Fornell (1985) Sources of Market Pioneer Advantages in Consumer Goods Industries, Journal of Marketing Research, 22(3), pp. 305-317. Robinson, W. T., G. Kalyanaram, and G. L. Urban (1994) First-Mover Advantages from Pioneering New Markets: A Survey of Empirical Evidence, Review of Industrial Organization, 9(1), pp. 1-23.
Schmalensee, R. (1981) Economies of Scale and Barriers to Entry, Journal of Political Economy, 89(6), pp. 1228-1238.
Schmalensee, R. (1982) Product Differentiation Advantages of Pioneering Brands,
Urban, G. L., T. Carter, S. Gaskin, and Z. Mucha (1986) Market Share Rewards to Pioneering Brands: An Empirical Analysis and Strategic Implications, Management Science, 32(6), pp. 645-659.
Von Stackelberg, H. (1934) Marktform und Gleichgewicht, Vienna and Berlin: Springer-Verlag.
Appendix: Information about Market Players and Their
Date of Entry, Organized by Country
We first present a table with incumbents and then a table with market entrants with their date of entry.
Country Operator Date of introduction17
Austria PTV Austria / Mobilkom (November) 1984
Belgium Belgacom Mobile (Proximus) (April) 1987
Denmark TDC (Tele Danmark Mobile) (January) 1982
Finland Telia Sonera (March) 1982
France Orange France (November) 1985
Germany T-Mobile (September) 1985
Greece no incumbent firm before 1990
Vodafone
TIM (STET Hellas)
(July) 1993 (July) 1993
Ireland Vodafone (Eircell) (December) 1985
Italy TIM (September) 1985
Netherlands KPN (January) 1985
Norway Telenor Mobil (November) 1981
Portugal TMN (January) 1989
Spain Telefonica Moviles (June) 1982
Sweden Telia Mobitel (October) 1981
Switzerland Swisscom (September) 1987
United Kingdom O2 (BT Cellnet)
Vodafone
(January) 1985 (January) 1985
Source: File West Europe countries.xls
Table A.1. Incumbent parties organized by country
17 The date of introduction is defined as the moment there is at least one subscriber. This date is not
always equal to the official month of introduction. For date of introductions before 1998 we have put the month between brackets because for this period we lack monthly data.
Country Operator Date of introduction18
Austria T-Mobile (Max.Mobil)
Connect Austria/ONE tele.ring 3 Austria (H3G) (October) 1996 December 1998 June 2000 June 2003 Belgium Mobistar Base (KPN Orange) (August) 1996 April 1999 Denmark Sonofon TeliaSonera Denmark Orange Denmark (Mobilix) 3 Denmark
(July) 1992 January 1998 March 1998 December 2003
Finland Elisa Mobile (Radiolinja)
DNA Finland (Finnet) Telia Finland Mobile
(January) 1992 February 1998 September 1998 France SFR Bouygues Telecom (August) 1989 (May) 1996
Germany Vodafone D2 (Mannesmann)
E-Plus O2 (Viag Interkom) (June) 1992 (May) 1994 October 1998 Greece Cosmote Q-Telecom April 1998 July 2002
Ireland O2 (Esat Digifone)
Meteor
(March) 1997 March 2001
Italy Vodafone (Omnitel)
Wind Blutel 3 Italy (October) 1995 March 1999 June 2000 March 2003 Netherlands Vodafone Telfort (O2) Orange (Dutchtone) T-Mobile (Ben) (September) 1995 December 1998 February 1999 February 1999
Norway Netcom (September) 1993
Portugal Vodafone (Telecel)
Optimus
1993
September 1998
Spain Vodafone (Airtel) (October) 1995
18 The date of introduction is defined as the moment there is at least one subscriber. This date is not
always equal to the official month of introduction. For date of introductions before 1998 we have put the month between brackets because for this period we lack monthly data.
Amena February 1999 Sweden Comviq/Tele2 AB Vodafone (NordicTel/Europolitan) 3 Sweden (H3G) (September) 1992 1993 June 2003
Switzerland TDC Switzerland (DiAx/Sunrise)
Orange Communications (OCSA)
December 1998 June 1999
United Kingdom T-Mobile (One2One)
Orange PCS 3 UK
(September) 1993 (April) 1994 March 2003
Source: File West Europe countries.xls