Damir Dlaka, Milutin Kapov
VoIP/PSTN Networks Planning with PlanVoip Application
UDK 004.77:621.39 004.42:<004.77:621.39 IFAC 5.8.1
Professional paper
The paper describes the IP network as a basis for the voice services transfer and parameters which influence the quality services level in the voice transfer over the IP network. Among all parameters, the accent is given on delay components, special on variable components. Hereafter is described the application which we have devel-oped for the purpose of the VoIP/PSTN network planning and analyzing. At the end, testing measurements with the developed application are made whereat the influence of the used codec and the link capacity on the subjec-tive score of voice quality (MOS) and on the total delay of voice packet is analyzed. For the purpose of the de-veloped application verification, a comparison analysis of the testing measurements and measurements on the real network is carried out.
Key words:packet loss, IP telephony, codec, PlanVoip application, subjective (MOS) score, total delay
1 INTRODUCTION
The Internet network, based on the TCP/IP pro-tocol family, consists of many computer networks spread all over the world. Computers communicate among themselves supporting data services transfer (e.g. e-mail) and services in the real time (voice and video). In this article, a special attention is paid to the IP network as a basis for the voice ser-vices transfer. When the Internet, or any other net-work based on the Internet protocol, is used for the voice transfer we say that it is the IP telepho-ny service. The key moment in the development and acceptance of the IP telephony occurs when the gateway is introduced. The gateway has suc-ceeded to interconnect traditional telephone world based on the line switching with Internet networks and other IP networks based on the packet switch-ing. With the gateway, IP telephony can support the standard telephone which is very important for an ordinary user [1, 2].
In the beginning, the main advantage of the IP telephony against the PSTN telephony was a lower price of calls. During the time VoIP and PSTN services prices have been equalized due to the de-crease of PSTN call prices. However, the main ad-vantage of IP telephony against PSTN telephony consists in a number of additional services which cannot to be supported by standard PSTN telepho-ny [3, 4, 5].
One of the basic tasks in the voice transfer over the packet network is the quality of services (QoS)
assurance. The quality of service concept is defined as a network capability to ensure the required ser-vice level for the specific network traffic when vari-ous network technologies and techniques are used. A network must have capability of distinguishing various traffic classes and each class should be treated separately to achieve specific quality of the service level. As an identification of the quality of service certain parameters are defined. The most important QoS parameters for the IP telephony are: delay, delay variation, throughput, packet loss amount and echo [2, 3, 4].
With new services arriving, it is necessary to have larger and faster communication which requires higher link capacity allocation. As a result, there is a lack of capacity which can seriously disturb QoS, specially the real time services. To preserve the re-quired QoS level, many methods have been deve-loped. All methods can be divided into two groups. The first one is described by IntServ standard, and the second one by DiffServ. Methods within IntServ standard are based on the reservation resource con-cept, while the methods within DiffServ standard are based on the priority provision concept using waiting queue algorithms [4, 5]. Before building the voice or data network, it is necessary to perform a detailed analysis of the traffic parameters and the expected QoS level. For that purpose it is neces-sary to know quite well IP and PSTN characteris-tics. There are many factors which must be taken into consideration in the network planning. The re-quired QoS level as well as the financial aspect are
the most important. QoS level is essential for keep-ing the user satisfied, whereas buildkeep-ing and further maintenance cost are always a factor of measure profitability. With proper and detailed network planning it can be achieved a considerable amount of time and financial saving which is manifested in the acquisition of the necessary equipment and the related software package. Correctly designed net-work has a low blocking level and high link effi-ciency, causing QoS services level increase and costs decrease [3, 4, 5].
All these requirements enforce the need for an integrated application development, which imple-ments and connects methods for planning IP and PSTN networks. This application gives huge aid to network designers and network administrators in planning the future and maintaining the existing network. By this approach, it is possible to obtain a detailed insight into the traffic and QoS parame-ters of the planned or already built network [6]. By this application it is possible to achieve a detailed analysis of classical PSTN and IP traffic in a fast and simple manner which has not been possible so far by an integrated application. The importance of this comprehensive analysis lies in the fact that in-terconnected PSTN and VoIP network will coexist long time [6]. That analysis encompasses:
– Defining traffic parameters of the PSTN network for the purpose of upgrading and optimizing the PSTN network;
– Defining traffic and QoS parameters in building the wholly new IP telephony network;
– Defining traffic and QoS parameters of the IP telephony network transferring PSTN to the VoIP network with PSTN network turning off; – Defining traffic and QoS parameters of the IP
telephony network in interleaving the network VoIP segment inside the existing PSTN network; – Defining traffic and QoS parameters of the IP telephony network when building the VoIP net-work as a parallel and connected part with the PSTN network;
– Students training, i.e. laboratory exercises done at faculties. By these exercises students will be better introduced with the traffic and QoS para-meters of the PSTN and the VoIP networks when they are planned.
2 VoIP QoS PARAMETERS
Users must have at least the same quality of the transferred voice acquired by the PSTN network if we want the service of voice transfer over the IP network to be quality replacement for the classical telephone service over the PSTN network. As all real time services, IP telephony is very sensitive to
the delay and delay variation, less to the voice packet loss. Because of that it is very important to know the allowed values of these QoS parameters. They are defined separately by standards:
– ITU G.114 specification recommends delay in one direction less than 150 ms for high quality traffic in the real time such as voice. Acceptable delay for international connection in one direc-tion is up to 300 ms, and for the satellite up to 400 ms [9];
– Buffers for the delay variation cancelling are ef-fective only if the delay variation is less than 100 ms. Because of that the delay variation should be minimized;
– The most frequently used codec G.729 requires that packet loss should be less than 1 % if we want to avoid listening errors. It will be ideal if there are no packet losses, which is hard to achi-eve in practice [7, 8].
IP telephony can assure acceptable quality of service only if the signalization packets and the voice packets had priority over data traffic. A num-ber of QoS techniques which support the men-tioned are developed [3, 7].
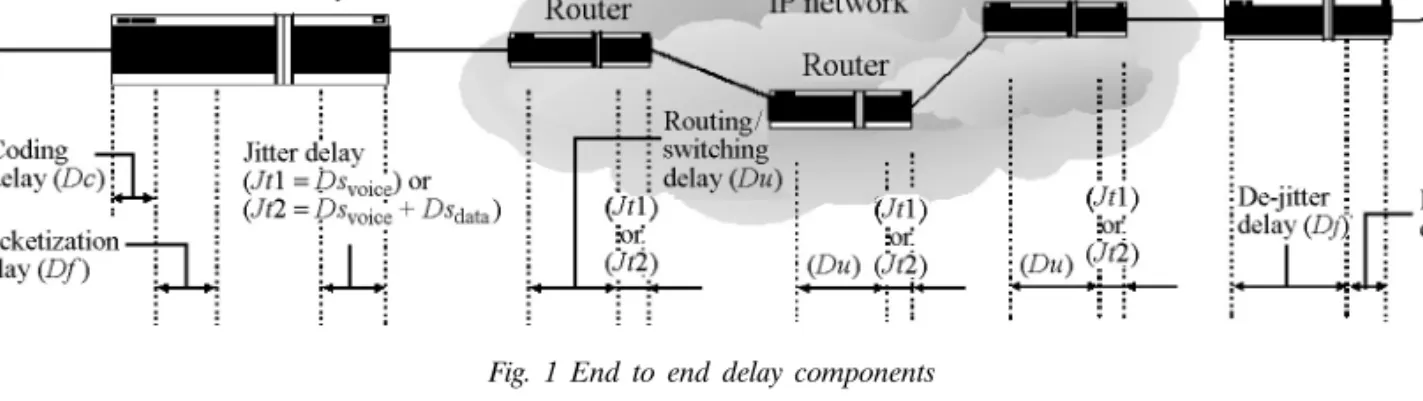
As we mentioned earlier, voice packets delay and delay variation are parameters which influence most the QoS of the transferred voice over the IP net-work. Because of that it is important to analyze all components in the transferring chain which con-tribute to the total delay. Those components are: Coding and decoding delay, packetization delay, waiting in the output buffers, propagation delay, routing delay and waiting in the de-jitter buffer [7, 8].
Delay can be fixed or variable. Fixed delay is the delay that we cannot have any influence on, i.e. we cannot change it. Fixed delay encompasses all mentioned delay components except delays which are the consequence of waiting in the output buffer. This buffer is connected, over serial inter-face, to the network where the voice packets are sent. Waiting in these buffers causes variable delay, which is called jitter. De-jitter buffer in the receiv-ing router is used for cancellreceiv-ing or decreasreceiv-ing vari-able delay. Figure 1 shows all delay components, both fix and variable, from the source to the desti-nation [7, 8].
Coding delay Dc is defined as a time needed for DSP processor to code one or more voice blocks. Under coding we consider A/D transformation and voice signal PCM block compression of the speci-fic coding algorithm. Decoding delay Db is time needed for the digitalized and compressed voice signal on the receiving side to be transformed in the original analogue form ready for the
reproduc-tion [6, 7, 8]. Packetization delay Df is time needed to load useful part of the packet with the coded voice. This delay is a function of the voice block size and the number of the blocks placed into one voice packet [6, 7, 8].
Network routing delay Du is time from voice packet ingress on the input router interface to egress of the same voice packet on the output in-terface. So, in that time period router analyzes voi-ce packet header, searches routing table, and accor-ding to values from the voice packet header and from the routing table forwards voice packet to the specific output interface [6, 7, 8].
Propagation delay Dp is time needed that a pac-ket travels certain distance on the total transferring path. According to G.114 recommendation at the network designing it is used standard estimation of the propagation delay Dp 10 µs/mile or 6 µs/km [6, 7, 8].
Delay variations must be removed before the sig-nal leaves the network. Delay variations cancelling is achieved by using the so called de-jitter buffer. This buffer is placed in the receiving router/gate-way, and cancels delay variations by transferring variable delay to the fixed one.
It is very interesting to analyze variable delay samples. From the source to the destination, voice packet travels through nodes chain (gateways, routers). After the packet enters the node, it is routed in the output buffer from where it is sent to the network. Although a voice packet has high-er priority in relation to data packet, it must some-times wait in the buffer his own queue for being forwarded. This happens in two cases:
– When the data packet is already in the sending process on the network;
– When the other voice packets are in the buffer. This waiting in the output buffer causes variable delay. The total waiting time in the output buffer is also influenced by link speed to which the buffer is
connected. Figure 2 shows the example where the voice packet of the 55 octets enters the buffer in the moment when the data packet is in the pro-cessing, i.e. 50 % of the data packet is forwarded to the line. Voice packet must wait the rest of the data packet (m= 50 %) to get out on the 128 kbps line. The assumption is that the router does not have the link fragmentation and interleaving (LFI) technique of the data packet turned on [6].
Time needed for the data packet forwarding from the buffer to the network is marked as Dsdata and is calculated by formula (1).
Time needed for the voice packet forwarding is marked as Dsvoice and is calculated by formula (2).
(1)
(2) In the expression (1), parameter m represents part of the data packet which hasn't yet left the buffer, and is placed in front of the voice packet. Parameter m is expressed in percentage. By chang-ing the rest of data packet size m from 0 to 100 % we can analyze the data traffic influence on the total delay of the voice traffic. Fp represents maxi-mum size of the data packet, and Bw is the line
voice bit octet octet ms kbps ( ) , . ( ) Sp Ds Bw ⎛ ⎞ ⋅⎜⎝ ⎟⎠ = data bit octet 8 100 octet ms kbps ( ) , ( ) m Fp Ds Bw ⎛ ⎞ ⋅ ⋅ ⎜ ⎟ ⎝ ⎠ = Fig. 1 End to end delay components
capacity [6]. In the expression (2), Sp represents total size of the one voice (VoIP) packet.
Let us consider buffer fulfillment shown in the Figure 2. In the moment when the 55 octets voice packet arrives, the 64 octets data packet has been already in the buffer and is in the sending process. In the moment when the voice packet arrives, the part size of the non forwarded data packet in the buffer is a random value. For example, we have used information that the half data packet has re-mained (m= 50 %). According to expression (1), time needed for forwarding the other half of the data packet to the line Dsdata is 2 ms. Time needed for forwarding 55 octet voice packet to the line Dsvoice is 3.4375 ms. Total time needed that voice packet leaves buffer is equal to the sum of these two times and amount is 5.4375 ms [6].
It is necessary to resolve two possible cases which cause waiting in the output buffer:
1. when there is no data packet in the buffer (m= 0)− Jt1,
Jt1= Dsvoice, ms (3) 2. when voice packet must wait in the buffer
be-hind the data packet (m≠ 0)− Jt2,
Jt2= Dsdata(ms)+ Dsvoice(ms), ms (4) According to the expression (3) and if we take into consideration (2) we can see that the voice packet delay in the buffer without data packet is influenced by two parameters: voice packet size Sp and line capacity Bw. According to the expression (4) and with (1) and (2), we can see that the voice packet delay, besides Sp and Bw parameters, is in-fluenced by data packet size Fp and m value which represents non forwarded data packet part in the buffer in front of the voice packet [6].
3 PLANVOIP APPLICATION
This chapter gives basic characteristics of the de-veloped PlanVoip application and principles of how it can be used. Application is built in programming language Java [10] and it is used as a calculator software. In its development the following approxi-mations are used:
– amount of the de-jitter delay is always higher for 50 % from the total delay variation on the line; – at using VAD (Voice Activity Detection)
functio-nality as a bandwidth saving it is used 42.5 % which is an average value of 35 and 50 %; – traffic in every node has random call arrival
pat-tern;
– holding time is exponential;
– blocked calls are cleared from the system (LCC – Lost Calls Cleared);
– there are infinite number of sources [6].
Input and output parameters whose list and pur-pose is going to be defined.
Input parameters:
Gs – blocking probability of the PSTN calls (e.g. 0.01= 1 % blocked calls);
Bc – bandwidth of the used codec;
Cd – total duration of the PSTN calls during one day;
Vb – total payload information inside one VoIP packet;
Ad – average distance between two ends represen-ted in km;
Hd – RTP/UDP/IP header size given in the octets; Hp – total number of the network nodes (buffers)
from end to end;
L2 – header size and type of the layer II. protocol (1Ether., 6-MPL/PPP, 6-HDLC, 5-ATM, 4-FR);
k – number of the buffers in which voice packet must wait forwarding to the link behind data packet – k≤ (Hp− 1);
Lp – voice packet loss probability; Bw – link (connection) capacity;
Fp – maximum data packet size given in the oc-tets;
m – data packet part (Fp) in the buffer which has not yet been forwarded to the link
(m= 0− 100 %);
VAD – turning on the VAD functionality. Output parameters:
Tm – the most frequent hour expressed in the er-lang;
Sp – total size of the voice packet;
Nk – number of necessary 64 kb/s channels (DS0) according to Erlang B tables;
Vk – bandwidth of the one voice channel; Nv – number of the voice (VoIP) channels; Dcb – sum of the coding and the decoding delay of
the used codec;
Bv – total bandwidth of all voice (VoIP) channels according to Nk;
Df – packetization delay;
Ps – number of the voice (VoIP) packet in a se-cond;
Dsvoice – waiting delay of the voice packet (2);
Us – 64 kbps link busyness when the VoIP chan-nels are used;
Dsdata – waiting delay of the data packet (1); Gn – gain achieved by using VoIP technology
in-stead of PSTN; Dp – propagation delay;
Rf – R factor according to E-model (ITU G.107); Dj – voice packet waiting time in the de-jitter
buffer;
Ms – subjective score of the voice quality (MOS); De – total end to end delay of the voice packets.
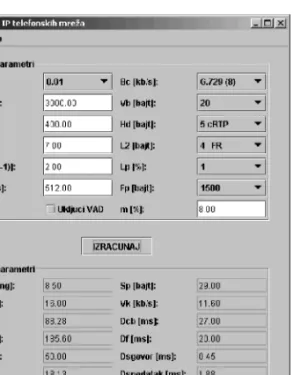
Figure 3 shows graphical user interface (GUI) of the PlanVoip application. GUI is divided into two parts. In the upper part there are fields in which we write values of the input parameters. They are related to VoIP and PSTN network. It is not sary to enter all parameters, but only ones
neces-sary for calculation. Input parameters Gs and Cd are especially related to the PSTN network. The rest of the input parameters are related to the IP network, but some of them can be also used for the PSTN network analysis.
Lower part has fields showing output parameters values after calculation. Output parameters Tm and Nk are especially related to the PSTN network, while the other output parameters are related to the IP network.
In the upper left corner two keys Pomoc and Info are placed. By pressing the Info key, the falling menu, having Verzija key, is opend. When the Ver-zija key is activated, the window with information such as author address, date and version are ope-ned. When the Pomoc key is activated, the falling menu, which has Uputstvo key, is opened. By acti-vating this key, the window with a list and purpose of input and output parameters used by the appli-cation, is opened.
Output parameters calculations are activated by pressing the Izracunaj key, after the necessary input parameters have been entered. Figure 4 shows an example of the GUI with the entered values and calculated relevant parameters for IP and PSTN networks.
It is important to mention that the PlanVoip ap-plication has integrated values from the erlang B table for three values of the PSTN call blocking probability Gs. Also, PlanVoip supports calculation with following codecs, G.711 (64 kbps), G.728 (16 kbps), G.729 (8 kbps) and G.723.1 (5.3 kbps and 6.3 kbps). Based on the integrated values from the erlang B table, PlanVoip application can determine traffic load of the most frequent hourTm and cal-culate the number of DS0 channel Nk, which can support the defined traffic load Tm and blocking probability Gs [6].
4 TESTING MEASUREMENTS
This chapter presents testing measurements re-sults calculated by the PlanVoip application. For that purpose three connections are analyzed, mutu-ally differentiated by the used codec or transferring line capacity. The analysis of the used codec influ-ence and the used line influinflu-ence on the subjective MOS (Mean Opinion Score) score of the voice quality and the voice packets total delay De has been carried out.
Within a framework of these examinations, a comparison analysis of the values captured by cal-culations with parameters measured on the real network has also been performed. This comparison analysis gives a relationship between theoretical and practical values as well as a verification of the de-Fig. 3 PlanVoip application GUI
Fig. 4 PlanVoip application GUI with input parameters and calcu-lated values
veloped application. Parameters values given by measurements on the real network are taken from the master thesis [11].
Measurements on the real network was perfor-med between two locations in the operating CARNet network – the CARNet regional center Split and University of Split. As VoIP routers, brand name routers with voice modules were used. Computers at the both ends are used as source and destination devices for TCP and UDP traffic gene-rated by IP Traffic.
The following limitations were set for the experi-ment: only one VoIP conversation during the mea-surement, no codec changing during the measure-ment, quality was observed from the recipient's point of view, so packets were analyzed at the de-stination, tested codecs are available in all voice--coding devices, for queuing other than FIFO, VoIP traffic was marked with DSCP EE (IP Precedence 5) and given priority over other TCP and UDP traffic, for all other parameters, default values were used.
Subjective quality was tested by two participants of the conversation which gave subjective judgment and mean score was taken as a mark for each case. 4.1 MOS score
G.107 standard defines E-model which enables subjective voice quality estimation by using measu-rement parameters and the estimated impairments caused by equipment. This is a computational model whose result is R-factor value. This R-factor can be mapped into MOS value with high precision. Mini-mal MOS score value is 1 and the maximum is 5
[12]. Table 1 shows input parameters values for the three analyzed connections with PlanVoip calcula-tor, and the calculated MOS score value for each of them with PlanVoip calculator.
Our intention was to compare MOS scores of different capacity connections on which the same codec (first and third connection) is used, and to compare MOS scores for connections of the same capacity on which different codec (first and second connection) is used.
Let's consider the first and the third connection where the same codec is used G.723.1 (5.3 kbps), but on the different line capacity, 128 kbps respec-tively 64 kbps. We can see that the higher line capa-city ensures higher MOS score which means better voice quality. Let's consider now the first and the second connection where the same capacity line of the 128 kbps is used, but different codecs, G.723.1 (5.3 kbps) respectively G.728 (16 kbps), are used. We can see that by using G.728 (16 kbps) codec a higher MOS score, i.e. a better voice quality is achieved.
It is interesting to compare MOS scores values given by testing with MOS scores given on the real network. In order to make this comparison analysis more relevant, input parameters of the testing net-work (table 1) are chosen so as to become closer to parameters from the real network on which the measurements are done, [11].
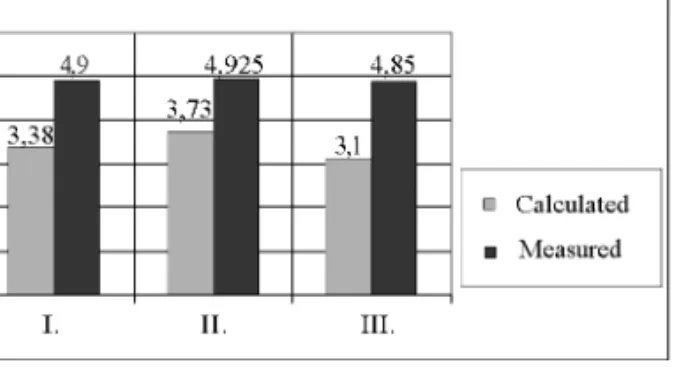
Table 2 shows measurements results captured from the real network. For the measured voice packet loss Lp on the network, MOS score is de-fined, which is obtained by using subjective scores from two listeners. If we compare MOS scores achieved on the real network with calculated ones, we can see that the first ones are significantly high-er. The reason can be in the fact that the score is achieved on the basis of only two users, which is not enough for the realistic and subjective voice quality score. Figure 5 gives graphical presentation of the MOS scores for all three connections of the simulated and the real network.
Table 1 Input parameters and MOS scores calculated with PlanVoip application
Input parameters
I. connection II. connection III. connection
Bc= 5.3 kb/s Bc= 16 kb/s Bc= 5.3 kb/s (G.723.1) (G.728) (G.723.1)
Bw= 128 kb/s Bw= 128 kb/s Bw= 64 kb/s
Lp= 0 % Lp= 2 % Lp= 0 %
Vb= 20 octets Vb= 40 octets Vb= 20 octets
Vt= 30 ms Vt= 20 ms Vt= 30 ms
Hd= 40 octets Hd= 40 octets Hd= 40 octets
L2= 14 octets L2= 14 octets L2= 14 octets VAD is not used VAD is not used VAD is not used
Fp= 1500 octets Fp= 1500 octets Fp= 1500 octets
Ad= 10 km Ad= 10 km Ad= 10 km
Hp= 7 Hp= 7 Hp= 7
k= 0 k= 0 k= 0
m= 0,1,2,50 m= 0,1,2,50 m= 0,1,2,50 MOS score
MOS= 3.38 MOS= 3.73 MOS= 3.1
Table 2 MOS score on the real network
I. connection II. connection III. connection (Lp= 0 %) (Lp= 2.16 %) (Lp= 0 %)
Bc= 5.3 kb/s Bc= 16 kb/s Bc= 5.3 kb/s (G.723.1) (G.728) (G.723.1)
Bw= 128 kb/s Bw= 128 kb/s Bw= 64 kb/s MOS score
It is important to mention that the MOS scores values for the tested and the real network are fol-lowed for all three connections, which are mutually differentiated by the used codec or line capacity.
If we compare MOS score value from the Figure 5 for the G.723.1 (5.3 kbps) codec with the usual expected MOS score for the mentioned codec, we can see that the MOS score is near to the expec-ted value (around 3.5) [12].
4.2 Total delay
This part presents testing measurements results of the voice packets total delay De. The same con-nections as in the previous chapter have been ana-lyzed. For each connection two groups of testing measurements (A and B) are done. For A measure-ment we assume that on the each connection there are two nodes (k= 2) in which the voice packet waits behind the data packet part. This data packet part is represented as m= 0 %, 1 %, 2 % and 50 % where this percentage presents part of the total data packet Fp. For B measurement we assume that in all the nodes on the connection (k= Hp− − 1= 6) the voice packet waits behind the data pac-ket part (m= 0 %, 1 %, 2 % and 50 %). Table 3 shows calculated values of the total delay De, when the PlanVoip application is used, for all considered cases.
In the same table there are also total delay De values measured on the real network. This makes comparison analysis of the testing measurements results and the measurements on the real network feasible.
For all cases and values in the analysis for the calculated delays De values it is used only one hop with the HDLC (High Data Link Control) protocol of the second layer which has 6 octets header. This is done to obtain almost the same conditions as on the real network on which the measurements are done [11].
Figures 6, 7, 8, 9, 10, 11 show graphical presen-tation of the results from the Table 3 Average de-lays De values (dashed) and the maximum and the minimum voice packet delay value in the conside-red time interval are displayed for the results mea-Fig. 5 MOS scores comparison for the testing and the real
connec-tions
It is important to perceive that, in the tested and real measurements, the second connection (G.728 codec and 128 kbps line capacity) has achieved the best MOS score although the packet loss on the real connection was Lp= 2.16 % and on the tested Lp= 2 % [6].
On the basis of this comparison analysis we can say with certainty that the testing results given by PlanVoip application are expected and completely justified.
I. connection II. connection III. connection G.723.1 5.3 kb/s G.728 16 kb/s G.723.1 5.3 kb/s Bw= 128 kb/s Bw= 128 kb/s Bw= 64 kb/s k m De, ms k m De, ms k m De, ms 2 0 138.825 2 0 128.875 2 0 206.95 2 1 143.513 2 1 133.563 2 1 216.325 A 2 2 148.2 2 2 138.25 2 2 225.7 2 50 373.2 2 50 363.25 2 50 675.7
Measured De= 120 (+/−40) Measured De= 123 (+/−27) Measured De= 150 (25−250)
Hp− 1= 6 0 138.825 Hp− 1= 6 0 128.875 Hp− 1= 6 0 206.95
Hp− 1= 6 1 152.888 Hp− 1= 6 1 142.938 Hp− 1= 6 1 235.075 B Hp− 1= 6 2 166.95 Hp− 1= 6 2 157 Hp− 1= 6 2 263.2
Hp− 1= 6 50 841.95 Hp− 1= 6 50 832 Hp− 1= 6 50 1613.2 Measured De= 120 (+/−40) Measured De= 123 (+/−27) Measured De= 150 (25−250) Table 3 Calculated and measured delays De
sured on the real network. On all the figures the acceptance delay border of 150 ms, defined by the ITU standard G.114, has been also marked. Below this border there is a quality of service level which should theoretically satisfy all users [9].
If we analyze the performed testing, it can be noted that the achieved total delay values of the voice packets De for the k= 2 and m= 0, 1, 2
(tes-ting A) as well as for the k= Hp− 1= 6 and m= 0, 1 (testing B) both on the 128 kbps line are within the acceptance border (less than 150 ms). For the same line capacity at the k= 2 and m= 50 (testing A) as well as the k= Hp− 1= 6 and m= 2, 50 (test-ing B), total delay considerably exceeds the accept-ance border, and it is not so probable that some of the users will be satisfied with this VoIP call. Fig. 6 Connection I. – testing A (G.723.1, Bw= 128 kb/s, k= 2)
Fig. 7 Connection II. – testing A (G.728, Bw= 128 kb/s, k= 2)
Fig. 8 Connection III. – testing A (G.723.1, Bw= 64 kb/s, k= 2)
Fig. 9 Connection I. – testing B (G.723.1, Bw= 128 kb/s, k= 6)
Fig. 10 Connection II. – testing B (G.728, Bw= 128 kb/s, k= 6)
When the voice packets are transferred over the 64 kbps line all results are out of the acceptance border of 150 ms.
It is interesting to compare testing results with the results obtained on the real network. We can conclude that the testing measurements results of the total delay De are very close to the measured results from the real connection for all cases when the m= 2 or less, i.e. when the rest size of the data packet part in front of the VoIP packet before leav-ing the buffer is 2 % and less [6].
5 CONCLUSION
There are many factors which influence directly the IP telephony in the world. Some of them are low traffic cost, possibility of using PSTN tele-phone, wide specter of new services, etc. However, it must be pointed out that the basic factor neces-sary for the IP telephony development in the fu-ture is the quality of the service level that the net-work can provide for the user. That quality of the service level must be at least the same, if not larg-er, as the one that user gets from the classical PSTN network.
The scale of the quality of the transferred voice is defined by QoS parameters. The paper sets forth relevant QoS parameters whereat the attention is given to delay, and specially to the variable compo-nent (jitter). Jitter influence on the total delay is very significant and for that reason it is described in detail in this article.
Although a jitter may be the most important pa-rameter, in IP telephony network planning it must be taken into consideration all QoS parameters and their interrelationship.
To facilitate network designers and administra-tors IP network planning and maintenance, Plan-Voip application has been developed. The stimula-tion for the development of this applicastimula-tion was a desire to design IP networks precisely and effecti-vely. However, it must be emphasized that the ap-plication can also be used for classical PSTN net-work planning and maintenance. PlanVoip applica-tion is an integral unit which binds not only new and existing methods for IP planning, but also clas-sical PSTN telephone networks. This is particular-ly important in cases when these two networks co-exists.
The main characteristics of PlanVoip application and the list of input and output parameters neces-sary for the IP and PSTN design and analysis are described in this article.
Testing measurements results of the three con-nections (I, II, III), mutually differentiated accor-ding to the used codec (G.723.1 and G.278) and
transferring line capacity (128 kbps and 64 kbps) are presented. Based on the achieved results, the analysis of the used codec influence and line capa-city influence on the subjective voice score (MOS) and the voice packets total delay has been done.
Because it is not possible to explicitly define m and k values, iterative analysis of these two para-meters are necessary, which can be performed by PlanVoip calculator. Parameters m and k, provides a detail insight of influence of data traffic on total end to end delay of IP telephony traffic, as well as the insight of the quality of service level of trans-ferred voice traffic over IP network.
Comparison analysis of the results achieved by testing measurements with the results achieved by measuring on the real network are presented at the end of the article. By this analysis, a relationship between theoretic and practical parameters values as well as a verification of the developed applica-tion have been obtained.
On the basis of a detailed testing measurements analysis and a comparative analysis, it can be said with certainty that results obtained by PlanVoip ap-plication are completely expected and justified, which leads to the conclusion that the originally developed PlanVoip application is valid.
REFERENCES
[1] ..., Group of authors, Nove komunikacijske tehnologije.
SoftCOM libraray, Split, 1999.
[2] U. Black, Internet Telephony – Call Processing Protocols.
Prentice Hall, 2001.
[3] H. Schulzrinne, J. Rosenberg, The IETF Internet Telephony Architecture and Protocols, IEEE Network Magazine, vol. 13, no. 3, p.p. 18–23, May/June, 1999.
[4] B. Li, M. Hamdi, D. Jiang, X. Cao, QoS – Enabled Voice Support in the Next-Generation Internet: Issues, Existing Approaches and Challenges.IEEE Communications Maga-zine, vol. 38, p.p. 54–61, April, 2000.
[5] M. Hassan, A. Nayandoro, M. Atiquzzaman, Internet Tele-phony: Services, Technical Challenges, and Products.IEEE Communications Magazine, vol. 38, no. 4, p.p. 96–103, April, 2000.
[6] D. Dlaka, Planiranje telefonskih mre`a temeljenih na In-ternet protokolu (IP). Master thesis, 2004.
[7] K. Lida, K. Kawahara, T. Takine, Y. Oie, Performance Eva-luation of the Architecture for End-to-End Quality-of-Ser-vice Provisioning. IEEE Communications Magazine, vol. 38, no. 4, p.p. 76–81, April, 2000.
[8] M. J. Karam, F. A. Tobagi, Analysis of Delay and Delay Jit-ter of Voice Traffic in the InJit-ternet, Computer Networks, vol. 40, no. 6, December 2002, p.p. 711–726.
[9] ..., One-way Transmission Time.ITU-T G.114, 1996. [10] S. J. Chapman, JAVA for Engineers and Scientists.Prentice
Hall, 2001.
[11] I. Pezelj, Osiguranje kvalitete govora u paketnim mre`ama.
Master thesis, 2004.
[12] ..., The E-model, a Computational Model for Use in Trans-mission Planning. ITU-T G.107, 1998.
Planiranje VoIP/PSTN mre`a primjenom programskog paketa PlanVoip.U ovom radu opisana je IP mre`a kao podloga za prijenos govorne usluge, te parametri koji utje~u na razinu kvalitete usluge pri prijenosu govora IP mre`om. Od svih parametara, naglasak je dan na komponente ka{njenja, a poglavito na varijabilne komponente ka{njenja. U nastavku rada je opisan programski paket kojeg smo razvili u svrhu planiranja i analize VoIP/PSTN mre`a. Na kraju su provedena simulacijska mjerenja s razvijenim programskim paketom pri ~emu je analiziran ut-jecaj izabranog kodeka i kapaciteta linije na subjektivnu ocjenu kvalitete govora (MOS) i na ukupno ka{njenje govornih paketa. U svrhu verifikacije razvijenog programa provedena je i poredbena analiza rezultata simulacijskih mjerenja i mjerenja na stvarnoj mre`i.
Klju~ne rije~i: gubitak paketa, IP telefonija, kodek, programski paket PlanVoip, subjektivna (MOS) ocjena, ukup-no ka{njenje
AUTHORS’ ADDRESSES Mr. sc. Damir Dlaka, dipl. ing. Ericsson Nikola Tesla d.d. Polji~ka cesta 39
21000 Split Croatia
E-mail: [email protected] Dr. sc. Milutin Kapov, doc.
Faculty of Electrical Engineering, Mechanical Engineering and Naval Architecture (FESB) in Split
University of Split Ru|era Bo{kovi}a bb 21000 Split Croatia E-mail: [email protected] Received: 2006-11-08