c
NON-SPEECH ACOUSTIC EVENT DETECTION USING MULTIMODAL INFORMATION
BY
PO-SEN HUANG
THESIS
Submitted in partial fulfillment of the requirements
for the degree of Master of Science in Electrical and Computer Engineering in the Graduate College of the
University of Illinois at Urbana-Champaign, 2011
Urbana, Illinois Adviser:
ABSTRACT
Non-speech acoustic event detection (AED) aims to recognize events that are relevant to human activities associated with audio information. Much previous research has been focused on restricted highlight events, and highly relied on ad-hoc detectors for these events. This thesis focuses on using multimodal data in order to make non-speech acoustic event detection and classification tasks more robust, requiring no expensive annotation. To be specific, the thesis emphasizes designing suitable feature representations for different modalities and fusing the information properly.
Two cases are studied in this thesis: (1) Acoustic event detection in a meeting room scenario using single-microphone audio cues and single-camera visual cues. Non-speech event cues often exist in both audio and vision, but not necessarily in a synchronized fashion. We jointly model audio and vi-sual cues in order to improve event detection using multistream HMMs and coupled HMMs (CHMM). Spatial pyramid histograms based on the opti-cal flow are proposed as a generalizable visual representation that does not require training on labeled video data. In a multimedia meeting room non-speech event detection task, the proposed methods outperform previously reported systems leveraging ad-hoc visual object detectors and sound local-ization information obtained from multiple microphones. (2) Multimodal feature representation for person detection at border crossings. Based on phenomenology of the differences between humans and four-legged animals, we propose using enhanced autocorrelation pattern for feature extraction for seismic sensors, and an exemplar selection framework for acoustic sensors. We also propose using temporal pattens from ultrasonic sensors. We per-form decision and feature fusion to combine the inper-formation from all three modalities. From experimental results, we show that our proposed methods improve the robustness of the system.
ACKNOWLEDGMENTS
This thesis would not be possible without the support of many people. I am thankful to my adviser, Professor Mark Hasegawa-Johnson, who enlightened me about the idea and helped me with great patience. Also, thanks to many people in the Statistical Speech Technology Group and the Image Formation and Processing Group for precious suggestions and help. Moreover, thanks to Dr. Thyagaraju Damarla for helpful advice. Finally, thanks to my parents and sister for their love and support.
TABLE OF CONTENTS
LIST OF TABLES . . . vii
LIST OF FIGURES . . . viii
LIST OF ABBREVIATIONS . . . x
CHAPTER 1 INTRODUCTION . . . 1
1.1 Motivation . . . 1
1.2 Background . . . 2
1.2.1 Acoustic Event Detection . . . 2
1.2.2 Multimodal Fusion . . . 2
1.2.3 Person Detection using Multimodal Sensors . . . 4
1.3 Outline . . . 5
CHAPTER 2 IMPROVING ACOUSTIC EVENT DETECTION USING VISUAL FEATURES AND MULTIMODALITY MOD-ELING . . . 6
2.1 Generalizable Visual Features for AED . . . 7
2.2 Multimodality Fusion for AED . . . 9
2.2.1 Multistream Hidden Markov Models . . . 10
2.2.2 Coupled Hidden Markov Models . . . 10
2.3 Experiments . . . 13
2.3.1 Dataset and Setup . . . 13
2.3.2 CHMM Training Schemes . . . 14
2.3.3 Results . . . 14
CHAPTER 3 MULTIMODAL FEATURE REPRESENTATION FOR PERSON DETECTION AT BORDER CROSSINGS . . . 17
3.1 Data . . . 17 3.1.1 Active Sensing . . . 18 3.2 Feature Extraction . . . 19 3.2.1 Seismic . . . 20 3.2.2 Acoustic . . . 22 3.2.3 Ultrasound . . . 25 3.3 Methods . . . 26
3.3.1 Gaussian Mixture Model Classifiers . . . 26
3.3.2 Decision Fusion . . . 27
3.3.3 Support Vector Machines . . . 27
3.4 Experiments . . . 28
3.4.1 Seismic Features . . . 29
3.4.2 Acoustic Features . . . 30
3.4.3 Decision Fusion and Feature Fusion with Seismic, Acoustic, and Ultrasonic Features . . . 31
CHAPTER 4 CONCLUSION . . . 33
4.1 Improving Acoustic Event Detection using Visual Features and Multimodality Modeling . . . 33
4.2 Multimodal Feature Representation for Person Detection at Border Crossings . . . 34
4.3 Future Work . . . 34
LIST OF TABLES
2.1 Classification accuracy with different audio SNR. (Mul-tistream: the bimodal system using multistream HMMs. CHMMm: the CHMM-based system initialized using mul-tistream HMMs. CHMMs: the CHMM-based system
ini-tialized using audio-only and video-only HMMs.) . . . 15 2.2 Detection accuracy with different audio SNRs. (AV: [21]
system using video features from multiple ad-hoc detectors. AVL: AV system plus localization information obtained via
multiple microphones [21].) . . . 15 3.1 Classification accuracy using seismic features. . . 29 3.2 Classification accuracy using acoustic features, where (1)
represents spectral subtraction, (2) represents the use of seismic peaks with differentδ second (s), (3) represents the use of our proposed multistage exemplar selection frame-work using a GMM classifier as the first step of the algo-rithm, and (4) represents the use of our proposed multi-stage exemplar selection framework using a SVM classifier
as the first step of the algorithm. . . 29 3.3 Classification accuracy using decision fusion (GMM
classi-fier) and feature fusion (SVM classiclassi-fier), where (1) repre-sents the enhanced summary autocorrelation pattern, (2) represents PLP features with spectral subtraction and seis-mic peaks with δ=0.3 s, (3) represents (2) with the multi-stage exemplar selection framework using a GMM classifier as the first step of the algorithm, (4) represents the use of temporal gait pattern [30], PLP features without spectral subtraction, using the whole active segments, and with-out the multistage exemplar selection, and (5) represents
LIST OF FIGURES
2.1 (Left) The image sequence for the event “footstep” in the overhead camera. (Right) The corresponding optical flow fields for each image, where the flow field is visualized using
hue to indicate the direction and intensity for the magnitude. . 8 2.2 Optical flow based overlapping spatial pyramid histograms
for a footstep event. (First row) Spatial pyramid arrange-ment and optical flow magnitude visualization. (Second row) Optical flow magnitude histogram in each
correspond-ing block. . . 9 2.3 A two-stream hidden Markov model encoded as a dynamic
Bayesian network. . . 10 2.4 Audio-visual fusion using CHMM. . . 11 2.5 Converting a CHMM to an equivalent HMM by state-space
mapping and parameter tying. . . 12 2.6 Confusion matrix for event classification (averaged over
SNRs 10 dB, 20 dB, 30 dB) based on audio-only HMM,
audio-visual multistream HMM, CHMMm and CHMMs. . . . 16 3.1 Sensor layout, where a multisensor multimodal system has
acoustic, seismic, passive infra-red (PIR), radar, magnetic,
and electric field sensors. . . 18 3.2 The overall flow: Feature extraction based on
phenomenol-ogy, GMM and SVM classifiers, and decision and feature
fusion. . . 19 3.3 Seismic feature extraction algorithm. . . 20 3.4 Examples of enhanced summary autocorrelation of seismic
signals. The left column shows examples of the feature vec-tor for one person, and the right column shows three people
with three four-legged animals at three different time frames. . 21 3.5 Using peaks of seismic signals for matching acoustic
3.6 (Left) An example of feature space of humans only and
humans with animalsclass. (Right) An example of feature space of humans only and estimated animals only class,
after exemplar selection. . . 24 3.7 Multistage framework for acoustic exemplar selection. . . 24
LIST OF ABBREVIATIONS
AED Acoustic Event Detection
CHMM Coupled Hidden Markov Models EM Expectation Maximization GMM Gaussian Mixture Models HMM Hidden Markov Models
MFCC Mel-Frequency Cepstral Coefficients PLP Perceptual Linear Prediction
PCA Principal Component Analysis SVM Support Vector Machines
CHAPTER 1
INTRODUCTION
1.1
Motivation
In addition to speech, there are numerous other sounds in our daily life. For example, there are sounds made by human activity (chair moving sounds, keyboard typing sounds), animals (dog barking), environmental sounds (wind sounds), etc. Being able to identify non-speech acoustic sounds helps us to understand the environment. Non-speech acoustic event detection focuses on identifying both timestamps and types of multiple events. There are various applications in detecting non-speech acoustic sounds, including secu-rity surveillance [1, 2], human computer interaction [3], elderly people assis-tance [4], and multimedia retrieval [5].
However, reliably detecting real-word non-speech acoustic events is chal-lenging for machine intelligence. In many situations, it is not always possible to identify clear indicators for different event categories. For example, a “table knocking” event might have a low-energy audio footprint in a noisy meeting room and barely visible visual cues from a top-view camera. Given the fact that it is common to have detection systems equipped with mul-timodal sensors nowadays, in order to enhance the robustness of detection systems, one way is to use information from different modalities.
For multimodal detection tasks, two key aspects are addressed in this the-sis: (1) What are the suitable feature representations for different modalities? (2) How to fuse the information from different modalities? The thesis studies non-speech acoustic event detection in two related problems: (1) Multime-dia meeting room acoustic event detection with single microphone and single camera observations. (2) Person detection with seismic, acoustic, and ultra-sonic observations at border crossings.
1.2
Background
1.2.1 Acoustic Event Detection
Acoustic events help people understand human and social activities that take place in many environments. Even though speech is the most informative auditory source, other types of sounds may also convey useful information. In a meeting room environment, a variety of acoustic events, either produced by objects handled by humans or by the human body, reflect different human activities. For example, the sound of yawning or of a chair moving reveals audience feedback in a seminar [6], and the sound of a door slamming or foot-steps can be used to detect human activities for surveillance [7]. Detection of non-speech sounds also helps improve speech recognition performance [8]. Much work on audio content analysis has been focused on the problem of audio source segregation [9], or audio stream segmentation for finding a small number of acoustically similar categories [10,11]. Acoustic event detec-tion (AED), a subtask of audio content analysis, aims at detecting specified acoustic events such as explosions [12], gunshots [13], speech/music transi-tions [14], coughing [15], and audience cheering at a sports event [16]. Such information is useful and important in many applications, for instance, intel-ligent conference rooms, multimedia information retrieval and surveillance. The 2006 and 2007 AED Evaluations sponsored by the project “Classification of Events, Activities and Relationship (CLEAR)” and follow-up work [1, 17] highlighted research efforts and challenges in the detection of general acous-tic events, in contrast to highlight/key events, such as audience cheering. Especially, the acoustic footprints of the events are subtle and subject to noise.
1.2.2 Multimodal Fusion
In many situations, it is difficult to detect acoustic events using a single sensor alone, even with predefined categories. In order to have robust detection results, one way is to detect events jointly with multimodal sensors. Different modalities might capture different aspects of target events. For instance, in a person detection task, acoustic sensors are used to detect footstep sounds. If a person walks in a stealthy way, the acoustic sensors might not be able
to capture the presence of intruders. Nevertheless, by incorporating other modal sensors such as ultrasonic sensors, the detection system might be able to detect the intruders given the fact that stealthy motion will be detectable by other modal sensors longer.
To integrate information from different modalities, Nakamura classifies them into three categories [18]. The first is early integration, which ex-tracts feature vectors from different modal observations and concatenates them into one feature vector sequence for use in one model with the same structure as would be used for one modality. The second is late integration, which extracts feature vector sets separately and uses sets of models generat-ing reliability weights to be combined across modalities. This is also referred to as decision fusion or separate identification. The third is intermediate integration, e.g., product hidden Markov model or coupled hidden Markov model [19]. Intermediate integration has been shown to outperform the early and late integration strategies in audio-visual speech recognition tasks [18].
For audio-visual fusion especially, several researches have found that joint modeling of the two modalities can improve the performance and robust-ness compared with either modality in many applications [18–20]. Chu and Huang [19] and Hasegawa-Johnson et al. [20] both studied the coupled hid-den Markov model for audio-visual speech recognition. Based on articulatory phonology, Hasegawa-Johnson et al. [20] further examined a more general dy-namic Bayesian network to better model the asynchrony between audio and visual modalities.
With the huge challenge from audio-only event detection, the research community has explored using additional visual information to improve AED performance [21–23]. Sadlier and O’Connor [24] studied detection of field sports events, using a support vector machine with various informative audio-visual features across various sports types. Canton-Ferrer et al. [21] and Butko et al. [25] both performed audio-visual event detection using audio information and output from trained visual object detectors, and fused the two modalities at decision level and at feature level respectively.
1.2.3 Person Detection using Multimodal Sensors
Person detection is an important task for intelligence, surveillance, and re-connaissance (ISR) requirements [26, 27]. One might like to detect intruders in a certain area during the day and night so that the proper authorities can be alerted. For example, Homeland Security often requires detection of ille-gal aliens crossing the border. There are numerous other applications where person detection is important.
However, person detection is a challenging problem. Video sensors con-sume high amounts of power and require a large volume for storage. Hence, the emphasis is on non-imaging sensors, since they tend to use low amounts of power and are long-lasting, making them suitable for border crossing sce-nario. Moreover, the false-alarm caused by nonhuman objects or the exis-tence of multiple objects makes person detection more challenging.
Traditionally, person detection research concentrated on using seismic sen-sors. When a person walks, his/her impact on the ground causes seismic vibrations, which are captured by the seismic sensors. Previous studies have relied on fundamental gait frequency estimation [28,29]. Park et al. proposed the method of extracting temporal gait patterns to provide information on temporal distribution of gait beats [30].
At border crossings, animals such as mules, horses, or donkeys are often known to carry loads. Animal hoof sounds make them distinct from human footstep sounds. In particular, when humans and four-legged animals walk together, the sounds they make are still distinguishable. Similarly, in acoustic event detection, Zhuang et al. utilized the distinct characteristic of each event, using perceptual linear prediction (PLP) as features, for detection [17, 31, 32].
Passive and active ultrasonic methods were proposed for the detection of walking person for ultrasound signals [33]. The passive method utilizes the footsteps’ ultrasonic signals generated by friction forces, while the active method uses the human Doppler ultrasonic signature. In an outdoor scene, the passive ultrasound signals are limited in distance and are noisy. For the active ultrasound method, when a person walks, each limb is a compound pendulum and has distinct oscillatory characteristics, which in turn results in the micro Doppler effect. Similarly, the torso also oscillates at a partic-ular frequency. The ultrasonic sensors can detect the ultrasonic signature
generated by footsteps and movements of the torso. Zhang et al. reported the different micro-Doppler gait signatures between human and four-legged animals [34]. These arise from the different physical mechanisms found in the two different species. Kalgaonkar et al. analyzed spectral patterns to classify human walking (walker identification, approach vs. away, male vs. female) [35].
1.3
Outline
The organization of this thesis is as follows: Chapter 2 presents audio-visual acoustic event detection using generalizable visual features and multistream HMM and coupled HMM for audio-visual joint modeling, which has been published in [32,36]. Chapter 3 presents multimodal feature extraction (seis-mic, acoustic, and ultrasonic features) in a person detection scenario, which has been published in [2, 37]. The thesis concludes with discussion and con-clusion in Chapter 4.
CHAPTER 2
IMPROVING ACOUSTIC EVENT
DETECTION USING VISUAL FEATURES
AND MULTIMODALITY MODELING
Recently, leveraging both audio and visual information for AED has been shown as an effective approach to improve on the performance and robust-ness of audio-only systems [21–23]. However, these works either depend on specific visual object detectors, usually requiring hand-labeled training data, or expect strong prior information of the visual cues in the recorded video, which is sometimes impracticable for real applications.
Incorporating additional visual cues for audio signal analysis has been explored in other applications, such as person identification [38] and speech recognition [19]. In particular, the multistream HMM and the coupled HMM (CHMM) are two effective models for audio-visual fusion. While audio-visual event detection shares a lot of challenges with audio-visual speech recogni-tion, they differ in multiple ways: First, the visual cues for general acoustic event detection can be much less constrained. There is no consistent visual region, such as the mouth in audio-visual speech processing, in which all the event information is embedded. Second, the synchrony and asynchrony be-tween the two modalities is not governed by a well constrained mechanism, such as human speech articulation. For example, key jingling presents mostly simultaneous audio and visual footprints. However, we can observe a person move before or after s/he makes the footstep sound, or a door start mov-ing before makmov-ing a slammmov-ing sound, the asynchrony bemov-ing more arbitrary than what is observed in audio-visual speech. It is not yet studied whether the audio-visual models in speech processing can be effectively applied in audio-visual event modeling to improve acoustic event detection.
In this chapter, we study utilizing a generalizable visual representation to improve acoustic event detection by audio-visual synchrony and asynchrony modeling. In particular, a combination of optical flow and overlapping spatial pyramid histograms characterizes the visual cues, which can be non-dominant in the recorded video. Compared with more task-specific alternatives [21],
the proposed visual features have the benefit of requiring minimum labeling efforts: no extra labels required other than the event onset/offset timestamps used for audio-only modeling. We propose applying multistream HMMs for synchronized audio-visual event modeling and coupled HMM [19] for more flexible modeling allowing asynchrony.
Acoustic event detection and classification experiments are performed on meeting room data with eleven general non-speech acoustic events. With the proposed visual representation and multimodal modeling, the visual cues, often local and subtle in the images, are shown to consistently improve both classification and detection accuracy of the concerned events. All the ex-periments use the video associated with the audio as the only extra data resource, requiring no additional labeling.
The organization of this chapter is as follows. Section 2.1 presents the gen-eralizable visual features adopted in this work, in particular the overlapping spatial pyramid histograms based on optical flow. Section 2.2 discusses the audio-visual modeling methods, in particular the multistream HMM and the coupled HMM. Section 2.3 presents the experimental results on audio-visual event classification and detection.
2.1
Generalizable Visual Features for AED
Previous studies [21] reported using ad-hoc visual detectors to generate vi-sual features for the purpose of improving event detection. However, training these detectors requires expensive labeling efforts, usually at least bounding boxes of the concerned objects. Moreover, these detectors are task-specific. Alternatively, we explore using visual features that do not require such train-ing and data labeltrain-ing, and are not task-specific, i.e. generalizable.
In this work, we propose using a combination of optical flow and over-lapping spatial pyramid histograms to characterize the visual cues in the acoustic events.
The visual cues of the non-speech audio-visual events are mostly related to motion. We propose using visual features based on optical flow between consecutive frames to capture the movement information. We utilize a highly efficient algorithm on variational methods utilizing a GPU [39] to calculate the optical flow, i.e. the horizontal and vertical movement for each pixel.
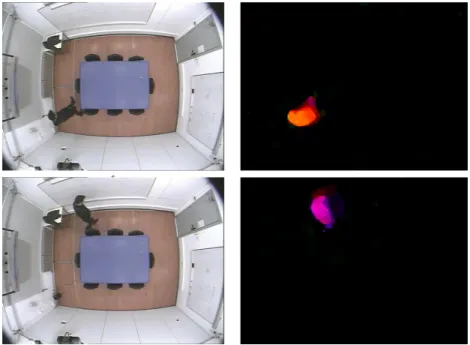
Figure 2.1: (Left) The image sequence for the event “footstep” in the overhead camera. (Right) The corresponding optical flow fields for each image, where the flow field is visualized using hue to indicate the direction and intensity for the magnitude.
Figure 2.1 illustrates the extracted optical flow for a “footstep” event. The visual cues of the acoustic events have their spatial correlates: the spatial distribution sometimes, but not always, differs between the different events and the background. Therefore, we define eight overlapping blocks from the whole image, including both the complete image and seven spatially local regions. The histograms of motion vector magnitude within all the blocks are employed as the video features [40]. We refer to this representation as the overlapping spatial pyramid histograms. A similar representation was successfully used for kernel estimation in general image scene categorization [41], which shares the property that the visual cues are highly variant and sometimes localized.
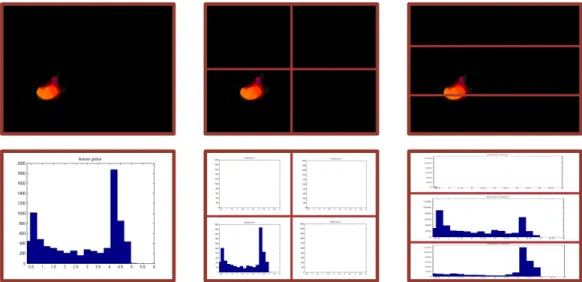
An example of the proposed visual representation for a footstep event is illustrated in Fig. 2.2.
Figure 2.2: Optical flow based overlapping spatial pyramid histograms for a footstep event. (First row) Spatial pyramid arrangement and optical flow magnitude visualization. (Second row) Optical flow magnitude histogram in each corresponding block.
2.2
Multimodality Fusion for AED
We propose using multistream HMMs for synchronized audio-visual event modeling, and coupled hidden Markov models [19] for more flexible modeling allowing asynchrony.
Different fusion methods have been explored for the audio and visual modalities. First, feature fusion techniques include plain feature concate-nation [42], feature weighting [43] and a data-to-data mapping of either one modality into the space of another or both modalities into a new common space [44]. Second, decision fusion provides a mechanism for capturing reli-abilities of each modality by classifier combination. Third, intermediate fu-sion performs multimodal integration at a level between decifu-sion fufu-sion and feature fusion. Intermediate integration strategies have been shown to out-perform the early and late integration strategies in various applications [18]. Multistream HMMs and coupled HMMs are used as two intermediate fu-sion methods. The synchrony and asynchrony between the modalities are modeled by the hidden state transitions. Though such models have been successfully applied in audio-visual speech recognition [19], they have not been applied in improving general non-speech acoustic event detection.
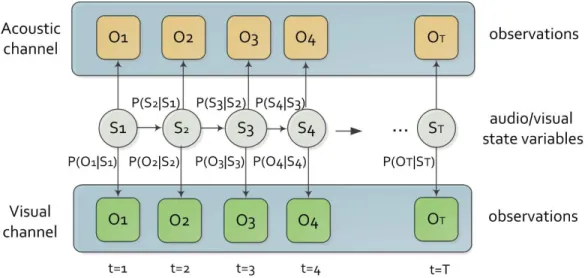
Figure 2.3: A two-stream hidden Markov model encoded as a dynamic Bayesian network.
2.2.1 Multistream Hidden Markov Models
In a two-stream HMM, the state-dependent emission of the audiovisual ob-servation oav,t is governed by P(oav,t|St) =P(oa,t|St)λa,St,tP(ov,t|St)λv,St,t for all HMM states St, whereλs,St,t denotes the nonnegative stream weights and
models the stream reliabilities as a function of modality s, HMM state St and time t.
Multistream HMMs assume state synchrony between audio cues and visual cues. Because of the simple topology, it is relatively easy to obtain robust estimation of the parameters.
Figure 2.3 illustrates a two-stream HMM, where the transitions probabili-ties are referred to asP(St|St−1). State observation distributions are referred
to as P(oav,t|St). St is a multinomial random variable representing the state of the CHMM system variable at timet. Note that both the streams progress in a synchronous fashion.
2.2.2 Coupled Hidden Markov Models
The assumption of audio-visual state synchrony is not always satisfied. For example, in an object dropping event, the acoustic sound is not always in existence when the object is in motion, but perhaps only when the object stops dropping. Similarly, a door slamming sound occurs at the end of the
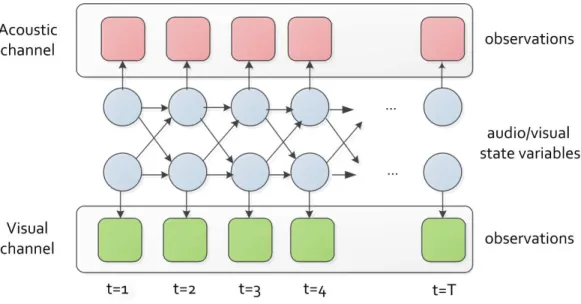
Figure 2.4: Audio-visual fusion using CHMM.
door movement. Though the asynchrony between modalities can be allevi-ated by a larger local time window for each frame, a more flexible statistical model allowing asynchrony between the hidden state sequences for the two modalities is desired.
In this work, we propose using coupled HMM to model modality asyn-chrony in audio-visual events. We select the transition-only coupled hidden Markov model (CHMM), in which different modalities are coupled through state transitions. The CHMM is capable of capturing both the synchronous and asynchronous inter-modal dependencies between two information chan-nels. CHMM proves to be an effective method in audio-visual speech recog-nition [19].
CHMM can be viewed as parallel rolled-out HMM chains coupled through cross-time and cross-chain conditional state transition probabilities. An n-chain CHMM hasnhidden nodes in a time slice, each connected to itself and its nearest neighbors in the next time slice. In our task, we use a 2-chain CHMM for audio-visual modeling, as shown in Fig. 2.4, where circular nodes in each slice are the multinomial state variables, square nodes in each slice represent the observation variable, and the directed links represent condi-tional dependence between nodes.
The state of the CHMM system in each time slice is jointly determined by the two multinomial state variables, each depending on its two parent
Figure 2.5: Converting a CHMM to an equivalent HMM by state-space mapping and parameter tying.
states in the previous time slice. The configuration permits unsynchronized progression of the two chains while keeping the Markov property that a future state variable is conditionally independent of the past given the present state variables. Note that CHMM can be seen as a generalized multistream HMM. Following a transformation strategy based on state-space mapping and parameter tying [19], we can convert a CHMM to an equivalent HMM, whose hidden states each correspond to the state of the system described by the CHMM. The number of hidden states in the equivalent HMM equals the number of possible combinations of states from both modalities. Figure 2.5 illustrates a 2-chain CHMM with Qa = 3 and Qv = 2, where Qa and
Qv are the numbers of audio and visual states respectively. For example, state 3 in the equivalent HMM corresponds to the CHMM state defined by audio state qa = 2 and visual state qv = 1. The modality-dependent observation probabilities corresponding to the same observation distribution in the original CHMM are tied and coded using the same tag. For example, the output densities modeling the visual stream in state 1, 3, 5 are tied and tagged as “V1” because they correspond toP(O1|qv = 1) in the CHMM.
In this work, we use a left-to-right non-skip HMM for each of the two modalities in the CHMM. The allowed state transitions in the equivalent HMM are derived from state space mapping. For example, in the state diagram in Fig. 2.5, given state 1 (qa = 1, qv = 1) at present, in the next time slice, qa can either transit to qa= 2 or stay inqa = 1, and qv can either
transit to qv = 2 or stay in qv = 1. Hence, state 1 can either stay in itself or transit to CHMM state 2 (qa = 1, qv = 2) or state 3 (qa = 2, qv = 1), or state 4 (qa = 2, qv = 2).
For robust estimation of the CHMMs, we perform the CHMM training in two stages. In the first stage, the observation distributions for both modal-ities are initialized using simpler models. The initial simpler models can be a two-stream audio-visual HMM, which requires strict state synchrony between audio and visual modalities, or one audio-only HMM and one video-only HMM, which impose no explicit state correspondence between the two modalities. In the second stage, the audio and visual observation distribu-tions from the multistream HMM or two single-modality HMMs are used to construct the CHMM-equivalent HMM. Additional parameter estimation iterations using the Balm-Welch algorithm are performed with this HMM.
2.3
Experiments
2.3.1 Dataset and Setup
We use the audio-visual dataset collected by the Universitat Politecnica de Catalunya [21]. The database contains multimodal recordings of acoustic events (AEs) in a meeting room environment. The target events in this dataset include: Knock door/table (kn), Door slam (ds), Steps (st), Chair moving (cm), Spoon/cup jingle (cl), Paperwork - listing, warping (pw), Key jingle (kj), Keyboard typing (kt), Phone ringing/Music (pr), Applause (ap) and Cough (co). There are approximately 90 instances per event class for the whole dataset of six sessions (S01-S06). Among S01-S04, we use three sessions for training, and one for testing. All reported measures are averaged from four-fold cross validation. Additional two sessions (S05, S06) are used as the development set. We use the observations from a far field microphone and an overhead camera.
To make the task more realistic we add different levels of Gaussian white noise to the clean recorded audio, to illustrate the performance of the differ-ent approaches at differdiffer-ent noise levels. Perceptual linear prediction (PLP) coding coefficients are used as the audio features. In particular, PLP coeffi-cients, including 12 coefficients and the 0th cepstral coefficient, are extracted
from 30 ms Hamming windows with a temporal step of 20 ms. The delta and acceleration coefficients are computed and appended to the static PLP coef-ficients. Cepstral mean normalization is performed on each recorded session. The visual features are obtained according to Section 2.1 using 20 bins for each histogram of optical flow magnitude. The concatenation of histograms from all blocks is projected into 40 dimensions using principle component analysis, retaining 98% of the total energy. These visual features are inter-polated to match the 20 ms frame period of the audio features.
In this work, each multistream HMM or CHMM has four audio and four video states with stream weights tuned on the development data using coarse-to-fine grid search. For simplicity, the stream weights are time-invariant. A set of audio-only HMMs are used for comparison, given their effectiveness [45].
2.3.2 CHMM Training Schemes
Initialization of the observation distributions in the CHMM is important, because of the high degree of freedom in the CHMM topology. As discussed in Section 2.2, we explore two different initialization schemes for CHMM, referred to as CHMMm and CHMMs, in which the observation distributions of the CHMMs are initialized using multistream HMMs, or pairs of audio-only and video-audio-only HMMs respectively.
The CHMMs parameters (the Gaussian means, covariance, mixtures weights, and the state transition probabilities) are further estimated with a few iter-ations using the Balm-Welch algorithm. We found in our pilot experiments that allowing estimation of all the CHMM parameters above is better than estimating any subset of parameters above and using the initialized param-eters for the rest.
2.3.3 Results
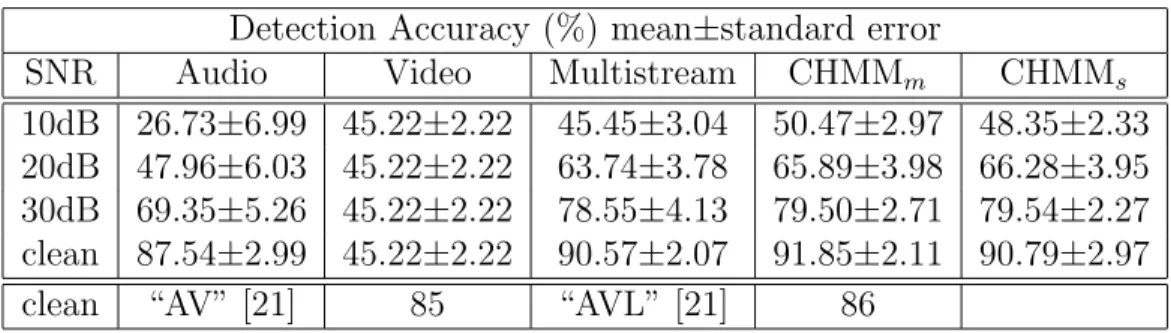
Table 2.1 and Table 2.2 present the classification and detection results using the proposed visual representation coupled with different audio-visual mod-eling methods as well as the audio-only and video-only models. The metric for evaluating the detection accuracy is “acoustic event detection accuracy,”
Table 2.1: Classification accuracy with different audio SNR. (Multistream: the bimodal system using multistream HMMs. CHMMm: the
CHMM-based system initialized using multistream HMMs. CHMMs: the CHMM-based system initialized using audio-only and video-only HMMs.)
Classification Accuracy (%) mean±standard error
SNR Audio-only Video-only Multistream CHMMm CHMMs 10dB 28.05±4.40 61.57±3.18 64.35±4.35 67.22±3.76 65.76±4.36 20dB 51.54±5.21 61.57±3.18 72.33±6.15 76.40±5.87 76.92±5.09 30dB 77.45±6.96 61.57±3.18 89.07±4.13 89.12±3.51 87.10±4.36
Table 2.2: Detection accuracy with different audio SNRs. (AV: [21] system using video features from multiple ad-hoc detectors. AVL: AV system plus localization information obtained via multiple microphones [21].)
Detection Accuracy (%) mean±standard error
SNR Audio Video Multistream CHMMm CHMMs
10dB 26.73±6.99 45.22±2.22 45.45±3.04 50.47±2.97 48.35±2.33 20dB 47.96±6.03 45.22±2.22 63.74±3.78 65.89±3.98 66.28±3.95 30dB 69.35±5.26 45.22±2.22 78.55±4.13 79.50±2.71 79.54±2.27 clean 87.54±2.99 45.22±2.22 90.57±2.07 91.85±2.11 90.79±2.97
clean “AV” [21] 85 “AVL” [21] 86
defined in [1,21]. In both detection and classification, the multistream HMM system consistently achieves higher accuracy than the audio-only system or the video-only system for all SNR conditions studied in this work. Further, CHMM-based systems (CHMMs and CHMMm) outperform the multistream HMM system in event detection for all SNR conditions.
We also performed event detection using original clean audio, the same condition studied in [21]. The proposed visual features and audio-visual modeling perform favorably, compared to the best systems reported in [21]. These reference systems [21] (in Table 2.2) leverage a person tracker, a laptop detector, a face detector, a door activity estimator to capture the visual cues and optional localization information obtained from multiple microphones (denoted as “AV” and “AVL” respectively).
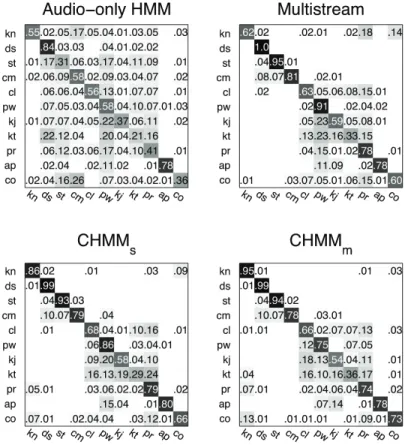
Figure 2.6 shows the confusion matrix of event classification using the audio-only HMM, audio-visual multistream HMM, CHMMm and CHMMs systems. Using the proposed generalizable visual features with the
multi-Figure 2.6: Confusion matrix for event classification (averaged over SNRs 10 dB, 20 dB, 30 dB) based on audio-only HMM, audio-visual multistream HMM, CHMMm and CHMMs.
stream HMM or the CHMM boosts classification accuracy for most event classes compared to the audio-only system. The more flexible CHMM-based systems (CHMMs and CHMMm) further improve classification of some events, such as kn: knock (door, table) and co: cough from the multistream HMM system.
To verify that the audio-visual state asynchrony allowed by the CHMM systems is utilized, we examine the state sequences found by the Viterbi de-coding. The percentages of observation frames claimed by the CHMM states defined by an asynchronous pair of audio and video states are 65.944% for CHMMs, and 65.842% for CHMMm respectively. Note that the multistream HMM system assigns all frames to states that are defined by synchronous audio and visual states.
CHAPTER 3
MULTIMODAL FEATURE
REPRESENTATION FOR PERSON
DETECTION AT BORDER CROSSINGS
Much research has studied using a single sensor to record in a clean environ-ment, a single person or a four-legged animal walking [28,30,34,35]. However, in reality, when there are many objects such as people or four-legged animals walking or running in noisy environments, it is difficult to distinguish humans alone from animals alone from animals and humans together using a single sensor and published approaches. Furthermore, since video sensors consume high amounts of power and require large storage volume, it is preferable to use non-imaging sensors. Non-imaging sensors, however, suffer from ambi-guity among the footsteps of animals alone, humans alone, and of animals traveling together with humans.
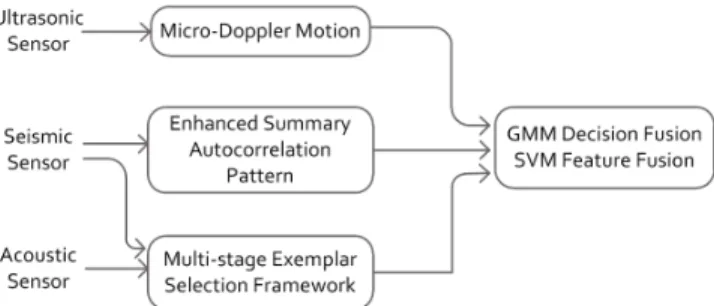
In this chapter, we propose using enhanced summary autocorrelation pat-terns for feature extraction from seismic sensors, a multistage exemplar se-lection framework to learn acoustic classifier, and temporal patterns from ultrasonic sensors. Acoustic, seismic, and ultrasound signals are fused us-ing decision fusion based on Gaussian mixture models (GMMs) and feature fusion based on support vector machines (SVMs) in order to examine the robustness of our methods.
The organization of this chapter is as follows: Section 3.1 introduces the multisensor multimodal data and events. Section 3.2 discusses the feature ex-traction from seismic, acoustic, and ultrasonic sensors. Section 3.3 discusses Gaussian mixture model classifiers, decision fusion, and support vector ma-chines. Section 3.4 describes the experiments on the multisensor multimodal dataset.
3.1
Data
In this chapter, we use a multisensor multimodal realistic dataset collected in Arizona by the U.S. Army Research Lab and the University of Mississippi.
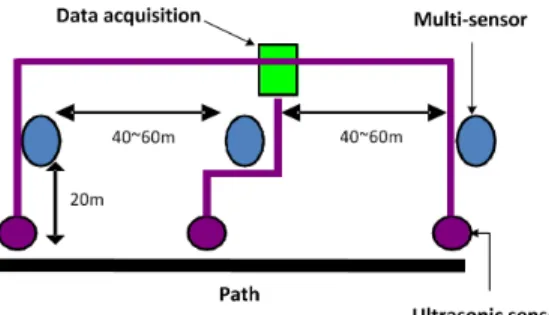
Figure 3.1: Sensor layout, where a multisensor multimodal system has acoustic, seismic, passive infra-red (PIR), radar, magnetic, and electric field sensors.
The data are collected in a realistic environment in an open field. There are three selected vantage points in the area. These three points are known to be used by the illegal aliens crossing the border. These places where the data are collected include: (a) wash (a flash flood river bed with fine-grain sand), (b) trail (a path through the shrubs and bushes), and (c) choke point (a valley between two hills). The data are recorded using several sensor modalities, namely, acoustic, seismic, passive infrared (PIR), magnetic, E-field, passive ultrasonic, sonar, and both infrared and visible video sensors. Each sensor suite is placed along the path with a spacing of 40 to 60 meters. The detailed layout of the sensors is shown in Figure 3.1. Test subjects walked or ran along the path and returned back along the same path.
A total of 26 scenarios with various combinations of people, animals and payload are enacted. We can categorize them as: single person (11.6%), two people (13%), three people (21.7%), one person with one animal (14.5%), two people with two animals (15.9%), three people with three animals (17.4%), and seven people with a dog (5.9%), where the animals can be a mule, a donkey, a horse, or a dog, and the number in the parentheses represents the percentage of the data. The data are collected over a period of four days, each day at a different site and in a different environment. There is variable wind in the recording environment.
3.1.1 Active Sensing
The time duration for subjects passing by is short (about ten to twenty sec-onds at a time) compared to the whole recording time (five to six minutes
Figure 3.2: The overall flow: Feature extraction based on phenomenology, GMM and SVM classifiers, and decision and feature fusion.
recording). Without any ground truth segmentation, we would like to extract the time duration when test subjects are passing through. This problem can be formulated as an example of active sensing and learning [46, 47], which refers to sequential data selection and inference procedures that actively seek out highly informative data, rather than relying on non-adaptive data acqui-sition solely.
For acoustic sensors, in an outdoor scene, the signals are contaminated by wind sounds, human voices, or unexpected airplane engine sounds. Seismic and PIR sensors, on the other hand, are relatively clean. Hence, we can process seismic or PIR sensors by an energy detection to determine the time duration when test subjects pass by. If the energy in any ten-second interval exceeds a threshold, the interval is marked “active.” Seismic and acoustic signals are pre-synchronized; therefore the acoustic active integral can be marked on the basis of seismic energy. Ultrasound is not tightly synchronized; therefore it must be independently segmented. For each recording, there are two active segments (walked or ran along the path and returned back along the same path). In this chapter, we emphasize the classification of segmented multimodal recordings into two classes: humans only, andhumans with (four-legged) animals.
3.2
Feature Extraction
Features are extracted from seismic, acoustic, and ultrasonic sensors. The overall flow is shown in Figure 3.2.
Figure 3.3: Seismic feature extraction algorithm.
3.2.1 Seismic
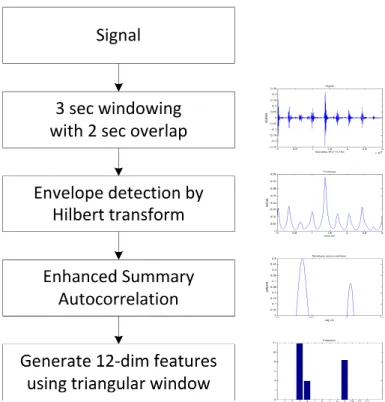
Seismic sensors capture the vibrations in the ground caused by the motion of the targets or ground coupling of acoustic waves. The gait patterns of humans and four-legged animals differ. Previous approaches do not consider the case of multiple human and/or four-legged animals [28, 30]. When there are multiple human and/or four-legged animals, it is not reliable to estimate the gait period based on the single pitch (fundamental frequency) detection method [48, 49]. Inspired by Park’s temporal gait pattern approach [30] and the progress in multipitch analysis [50], we propose a gait pattern feature extraction method based onenhanced summary autocorrelation[50], as shown in Figure 3.3. A typical example of an enhanced summary autocorrelation function is shown in Figure 3.4, where the same subjects generate similar enhanced summary autocorrelation patterns. We form analytic signals by Hilbert transform and then use full wave rectification followed by low-pass filtering and down-sampling for envelope detection. Finally, we use enhanced summary autocorrelation to estimate the gait pattern and generate a 12-dimensional feature vector using 12 triangular windows.
Figure 3.4: Examples of enhanced summary autocorrelation of seismic signals. The left column shows examples of the feature vector for one person, and the right column shows three people with three four-legged animals at three different time frames.
The idea of enhanced summary autocorrelation is to prune the periodicity of the autocorrelation function. The procedure is the following: First, from the envelope signals, the autocorrelation function is computed within each channel (two channels in the model of Tolonen and Karjalainen [50]). Second, the autocorrelation functions are summed up across the channels to form a summary autocorrelation function. Third, the summary autocorrelation function is clipped to positive values, then time-scaled by a factor of two, and subtracted from the original clipped function. Then, the same procedure is repeated with other integer factors so that repetitive peaks at integer multiples can be removed. The resulting function is called the enhanced summary autocorrelation.
3.2.2 Acoustic
From the active segments we extracted in Section 3.1.1, we further extract acoustic features from short-time footstep sounds by incorporating seismic signals. Since there are no labels for the exact time of footstep sounds, we have to use the seismic sensor information, assuming that the peaks in the seismic signals correspond to footsteps. Suppose there are n groups of peaks (if some peaks are close to each other, we count them as one group) in the seismic signal, whose times are ti, for i= 1, . . . , n. We choose a small time δ around the peaks and extract PLP features within the time duration (ti−δ, ti+δ), for i= 1, . . . , n, as shown in Figure 3.5. In each time period, we extract 13-dimensional PLP features using 186 ms Hamming windows with 75% overlap, where 186 ms is approximately equal to the time duration of a single footstep (from heel strike to toe slap). Delta and delta-delta coefficients are appended to create a 39-dimensional feature vector.
The hoof sounds of animals such as horses, donkeys, or mules are perceptu-ally distinct from human footstep sounds. In order to imitate the perceptual discrimination abilities of human listeners, we begin by using perceptual lin-ear prediction (PLP) features [51], which are common features in speech recognition. As mentioned in Section 3.1, the data are recorded in an open field. There are noisy wind sounds in the recordings. We use spectral sub-traction to reduce the effect of noise [52, 53].
Figure 3.5: Using peaks of seismic signals for matching acoustic footstep sounds.
humans with animals class, there are instances of human footstep sounds. Therefore, there is some overlap between the two classes in the feature space, as shown on the left-hand side of Figure 3.6. Regularized discriminative methods such as support vector machines (SVM) explicitly trade off the degree of class overlap vs. the complexity of the decision boundary in order to minimize an estimate of expected risk. Generative models, on the other hand, model overlap only to the extent permitted by the specified generative model.
In order to improve the classifiers’ ability to compensate for class overlap, therefore, we propose a multistage algorithm for exemplar selection, as shown in Figure 3.7; this framework is similar to the “self-training” methods used in semi-supervised learning. The idea of the framework is to select the exemplar frames in the humans with animals class which are dissimilar to the features in thehumans onlyclass. With the exemplar selection method, classifiers are able to learn more easily the distinctive features between classes as shown on the right-hand side of Figure 3.6. The algorithm is as follows:
Figure 3.6: (Left) An example of feature space of humans onlyand humans with animals class. (Right) An example of feature space of humans only
and estimated animals only class, after exemplar selection.
Figure 3.7: Multistage framework for acoustic exemplar selection.
andhumans with animals using training data as shown in the left block of Figure 3.7.
2. Label the training data of the humans with animals class using the trained models as shown in the middle block of Figure 3.7. Each frame in the training data is labeled as either the humans only class or the
humans with animals class.
3. Keep the frames which were labeled as humans with animals; in other words, discard the frames which were labeled as humans only.
4. Train a new classifier (SVM or GMM) between the estimated animals only class and the humans only class as shown in the right block of Figure 3.7.
Note that the acoustic features capture short-time footstep sounds as fea-tures, while seismic and ultrasonic features utilize temporal pattern infor-mation. Therefore, the multistage exemplar selection framework applies for acoustic features only.
3.2.3 Ultrasound
Ultrasonic sensors, also known as acoustic Doppler sensors [33], emit acoustic waves toward objects and receive reflected responses from objects. Benefits of using ultrasonic sensors include low cost ($5 USD in 2011) and low power. The limitation is that, because of the rapid attenuation of high-frequency acoustic waves, ultrasonic sensors have a limited range on the order of ten meters.
By measuring the frequency shift of a wave scattered or radiated by a moving object, the velocity of the object relative to an observer can be cal-culated; this is known as the Doppler effect. If the object contains moving parts, each moving part will result in a modulation of the base Doppler fre-quency shift, which is known as the micro-Doppler effect. Given an acoustic wave transmitted by an observer, the frequency of the received wave by a single point scatterer is
f =f0 1 + 2v c (3.1) where f0 is the frequency of the transmitted acoustic wave, v is the velocity
of the scattered wave relative to the observer and c is the speed of sound. The Doppler frequency shift, ∆f = 2v
c , is proportional to the scattered wave velocity relative to the observer.
A human body is an articulated object, comprising a number of rigid bones connected by joints. When a continuous tone is incident on an animal or a walking person, the reflected signal contains a spectrum of frequencies by the Doppler shifts of the carrier tone because of the velocities of various moving body parts.
As reported in Zhang et al. [34], based on different physical walking mech-anisms, the micro-Doppler gait signatures of a person and a four-legged ani-mal are different. We use this fact to extract features in order to distinguish between humans and four-legged animals.
For ultrasound signal processing, given the data with two channels, 25 kHz and 40 kHz, we first use a band-pass filter with stopbands at 20 kHz and 30 kHz and passbands at 22.5 kHz and 27.5 kHz for the 25 kHz channel, and a band-pass filter with stopbands at 30 kHz and 45 kHz and passbands at 37.5 kHz and 42.5 kHz for the 40 kHz channel. Then, we use a Hilbert transform to demodulate the captured Doppler signals to emphasize the contributions
of various velocities. Finally, we use cepstral coefficients for representing the patterns in the spectrogram [35]. We use 62 ms Hamming window with 75% overlap. The 80-dimensional feature vector includes cepstral coefficients and their deltas.
3.3
Methods
3.3.1 Gaussian Mixture Model Classifiers
The motivation for using Gaussian mixture densities is that a sufficiently large linear combination of Gaussian basis functions is capable of representing any differentiable sample distribution [54, 55].
A Gaussian mixture density is a weighted sum of M component densities, as shown in the following equation:
p(~x|λ) = M
X
i=1
pibi(~x) (3.2)
where~xis a D-dimension random vector,bi(~x),i= 1, . . . , M, are the compo-nent densities andpi,i= 1, . . . , M, are the mixture weights. Each component density is a D-variate Gaussian function of the form
bi(~x) = 1 (2π)D/2|P i| 1/2exp{− 1 2(~x−~µi) ′ Σ−1 i (~x−~µi)} (3.3) with mean vector~µiand covariance matrix Σi. The mixture weights are con-strained by PM
i=1pi = 1. The complete Gaussian mixture density is
parame-terized by the mean vectors, covariance matrices (we use diagonal covariance matrices here) and mixture weights from all component densities. These parameters are collectively represented by the notation λ = {pi, ~µi,Σi}, i= 1, . . . , M. For classification, each class is represented by a GMM parameter-ized by λ.
Given training data from each class, the goal of model training is to esti-mate the parameters of the GMM. Maximum likelihood model parameters are estimated using the expectation-maximization (EM) algorithm. Gener-ally, ten iterations are sufficient for parameter convergence.
The objective is to find the class model that has the maximuma posteriori
probability for a given observation sequence X. Assuming equal likelihood for all classes (i.e., p(λk) = 1/N) , the classification rule simplifies to
ˆ N = argmax 1≤k≤N p(X|λk) = argmax 1≤k≤N T X t=1 logp(~xt|λk) (3.4) where the second equation uses logarithms and assumes conditional indepen-dence between observations. T is the number of observations.
3.3.2 Decision Fusion
GMMs are trained for each modality and their log probabilities are combined as
sλ(~x) = X m∈M
wmlogP(~xm|λ) (3.5) where M = {a, s, u}, a, s, u represents acoustic, seismic, and ultrasound modalities, respectively. If all likelihood functions were correctly trained, and if the vectors ~xa, ~xs, and ~xu were conditionally independent given class label, then the Bayes-optimal mode weights would be wm = 1. In practice the likelihood functions tend to be overconfident; therefore, we scale them using 0≤wm ≤1, Pm∈M wm = 1.
For simplicity, we choose weights by a grid-search of global weights on val-idation sets [56]. Note that Equation (3.5) corresponds to a linear combina-tion in the log-likelihood domain; however, it does not represent a probability distribution in general, and will be referred to as a score.
3.3.3 Support Vector Machines
A support vector machine (SVM) estimates decision surfaces,g(x) = wTφ(x)+
b, directly [57], rather than modeling a probability distribution from the training data. Given training feature vectors xi ∈ Rn, i = 1, . . . , k in two classes with label yi ∈ {1,−1}, i = 1, . . . , k, a SVM solves the following
optimization problem: min w,b,ξ 1 2w Tw+CPk i=1ξi subject to yi(wTφ(xi) +b)≥1−ξi ξi ≥0, i= 1, . . . , k
where φ(xi) maps xi onto a higher dimensional space, C ≥0 is the regular-ization parameter, and ξi is a slack variable, which measures the degree of misclassification of the datum xi.
The solution can be written as w satisfies w = Pk
i=1yiαiφ(xi), where
0≤αi ≤C, i= 1, . . . , k, and the decision function is
h(x) = sgn k X i=1 yiαiK(xi,x) +b ! (3.6)
where K(xi,x) = φ(xi)Tφ(x) is the kernel function. In this chapter, we use LIBSVM with radial basis function (RBF) kernels, that is, K(xi,xj) = exp(−γ||xi−xj||2) [58].
3.4
Experiments
In this section, we describe three experiments in order to compare our pro-posed methods with previous approaches in classifying humans only vs. hu-mans with four-legged animals. There are 69 recordings in the dataset. We divide the recordings into four groups and choose two for training and two for testing at a time, resulting in a six-fold cross-validation. In each fold, we randomly select a part of recordings from training and testing sets as a validation set. We choose the best mixture count for the GMM classifier and parameters γ and C for the SVM, according to the validation set. The experimental results are represented by mean ± standard error.
Table 3.1: Classification accuracy using seismic features.
Feature Accuracy (%)
GMM SVM
Temporal gait pattern [30] 71.9±4.6 79.0±4.6 Enhanced summary autocorrelation pattern 81.7±2.6 84.4±2.9 Table 3.2: Classification accuracy using acoustic features, where (1)
represents spectral subtraction, (2) represents the use of seismic peaks with different δ second (s), (3) represents the use of our proposed multistage exemplar selection framework using a GMM classifier as the first step of the algorithm, and (4) represents the use of our proposed multistage exemplar selection framework using a SVM classifier as the first step of the algorithm.
Feature Accuracy (%) GMM SVM PLP features without (1)(2)(3)(4) 73.8±2.2 65.3±1.9 PLP features with (1) 76.1±4.1 71.7±4.6 PLP features with (1)(2), δ=0.1 s 75.0±5.1 78.1±1.7 PLP features with (1)(2)(3), δ=0.1 s 75.7±2.9 76.6±2.2 PLP features with (1)(2)(4), δ=0.1 s 72.7±4.6 75.1±2.6 PLP features with (1)(2), δ=0.3 s 77.6±4.3 80.6±3.1 PLP features with (1)(2)(3), δ=0.3 s 79.0±3.8 72.6±2.7 PLP features with (1)(2)(4), δ=0.3 s 75.3±3.7 77.2±1.7 PLP features with (1)(2), δ=0.5 s 75.4±3.4 76.2±4.4 PLP features with (1)(2)(3), δ=0.5 s 77.7±3.1 74.5±3.6 PLP features with (1)(2)(4), δ=0.5 s 74.8±4.5 71.3±3.5
3.4.1 Seismic Features
As described in Section 3.2.1, we compare our gait pattern features based on enhanced summary autocorrelation with the temporal gait pattern [30] under the same experimental setup. The experimental results are shown in Table 3.1.
From the experimental results of Table 3.1, our proposed method using enhanced summary autocorrelation pattern outperforms the previous method [30] in both GMM and SVM classifiers, because the previous method did not consider the case of multiple objects. Compared with GMM classifiers [30], the experimental results show that SVM has a better discrimination between the two classes for seismic features.
3.4.2 Acoustic Features
As described in Section 3.2.2, we want to examine the effect of using (1) spectral subtraction, (2) seismic peaks with differentδ’s, and (3) our proposed multistage exemplar selection framework using GMM and SVM classifiers as the first step of the algorithm. The experimental results are shown in Table 3.2.
The first row PLP features without (1)(2)(3)(4) in Table 3.2 represents using the active audio segments, without using the duration estimated by the peaks of seismic signals, and without using spectral subtraction. Spectral subtraction (row 2) improves the performance for both classifiers.
It is helpful to further extract audio features from the time durations marked by peaks of seismic signals. This method utilizes both the charac-teristics of acoustic and seismic sensors in the sensor suites. Without using this method, there are many silence or noise segments in the audio signals, and the silence or noise signals make both classifiers ill-trained.
Moreover, different values ofδ capture different amounts of acoustic infor-mation. The results show that δ=0.3 s has the best performance compared with δ=0.1 s and δ=0.5 s. The seismic sensor and acoustic sensor are not at exactly the same place and the rates of propagation are different. Therefore, there are asynchronies between acoustic and seismic signals. Specifically, with
δ=0.1 s, the acoustic segment does not contain the entire footstep sound. On the other hand, with δ=0.5 s, the acoustic signals include too much unre-lated noise. These reasons may explain the performance variation of both classifiers.
For our proposed multistage exemplar selection framework, using GMM for exemplar selection improves the accuracy around 1∼2% for GMM classifiers; on the contrary, using GMM for exemplar selection degrades the accuracy for SVM classifiers. A possible reason is that SVM implicitly chooses support vectors for the hyperplane in the feature space. Using GMM selected features, the SVM has less information, and hence has worse performance. On the other hand, using SVM for exemplar selection degrades performance in all cases. A possible explanation is that the SVM cannot select proper exemplars in the case of overlapping features in the first stage.
Table 3.3: Classification accuracy using decision fusion (GMM classifier) and feature fusion (SVM classifier), where (1) represents the enhanced summary autocorrelation pattern, (2) represents PLP features with spectral subtraction and seismic peaks with δ=0.3 s, (3) represents (2) with the multistage exemplar selection framework using a GMM classifier as the first step of the algorithm, (4) represents the use of temporal gait pattern [30], PLP features without spectral subtraction, using the whole active
segments, and without the multistage exemplar selection, and (5) represents ultrasonic features.
Feature Accuracy (%) GMM SVM (1)(3)(5) 86.1±2.3 84.4±2.9 (1)(2)(5) 84.9±2.8 85.3±3.4 (4)(5) 81.9±3.1 81.0±1.8 (5) 75.5±3.6 82.2±3.5
3.4.3 Decision Fusion and Feature Fusion with Seismic,
Acoustic, and Ultrasonic Features
We perform multimodal fusion in a classifier-dependent fusion: decision fu-sion with GMMs, feature fufu-sion (vector concatenation) with SVM. Note that, for ultrasonic data, within 186 ms, there are eight moving windows resulting in a 640-dimensional feature vector. We use principal component analysis (PCA) keeping 99% of the energy, and reduce features to 7 dimensions.
We compare our proposed methods using GMM and SVM classifiers, as shown in Table 3.3. Row 1 of Table 3.3 represents the use of ultrasonic fea-tures, enhanced summary autocorrelation pattern, PLP features with spec-tral subtraction, seismic peaks with δ=0.3 s, and the multistage exemplar selection framework using GMM classifiers. Row 2 of Table 3.3 represents the use of the same seismic, ultrasonic features as Row 1, and acoustic features without the multistage exemplar selection. Row 3 of Table 3.3 represents the use of temporal gait pattern [30], PLP features without spectral subtrac-tion, using the whole active segments, and without the multistage exemplar selection. Row 4 of Table 3.3 represents the use of ultrasonic features.
In Table 3.3, our proposed method, using seismic and acoustic features along with ultrasonic features, greatly improves the robustness compared with previous approaches. With the exemplar selection framework, GMM classifiers achieve the best fusion accuracy. The SVM, however, performs
worse with exemplar selection, as mentioned above. The classification task, using only ultrasonic features (last row), is roughly 7% better with SVM classifiers compared with GMM classifiers.
We analyze the errors in the (1)(3)(5) in the GMM decision fusion case. Among the six-fold cross-validations, the recordings of the event,seven people with a dog, are all incorrectly classified as human only. This accounts for 52.6% of all errors. A possible explanation is that dogs have padded feet (instead of hoofs) and are relatively small. It is difficult to tell dogs from humans because the classifier has learned to recognize hoof sounds. The limited amount of data for this event means that the classifier is unable to learn its distinctive pattern.
CHAPTER 4
CONCLUSION
This thesis focuses on multimodal feature representation and multimodal fusion, methods that can be adapted to many related tasks. It has been demonstrated that these methods can effectively model non-speech acoustic event data and achieve state-of-the-art results. In this chapter, I will summa-rize and discuss the findings in both Chapter 2 and Chapter 3, and present possible future work following this thesis.
4.1
Improving Acoustic Event Detection using Visual
Features and Multimodality Modeling
Generalizable visual features, the optical flow based spatial pyramid his-tograms, are proposed to improve acoustic event detection by audio-visual intermediate integration. This representation is shown to capture the highly variant visual cues for the acoustic events, and significantly improve event classification and detection accuracy using systems based on multistream HMMs or coupled HMMs. Compared to the multistream HMMs, the coupled HMMs further boost the performance by allowing state asynchrony between the audio and visual modalities. The systems with the proposed generaliz-able visual features and audio-visual modeling perform favorably compared to previously reported systems leveraging ad-hoc visual detectors and local-ization information obtained from multiple microphones [21].
4.2
Multimodal Feature Representation for Person
Detection at Border Crossings
Based on phenomenology of the differences (gait pattern, footstep sound, and micro-Doppler motion) between humans and four-legged animals, the system developed in this thesis uses a seismic feature extraction method based on enhanced summary autocorrelation, a multistage acoustic exemplar selection framework, and temporal patterns from ultrasonic sensors. Decision fusion based on GMMs and feature fusion based on SVM are used to incorporate features from different modalities. The experiments are conducted using a challenging, realistic, multisensor multimodal dataset. Experimental results show that the combination of multimodal sensors improves the robustness of the system over previous approaches.
4.3
Future Work
In this thesis, we study non-speech acoustic event detection using multi-modal sensors in two cases: audio-visual event detection in a meeting room scenario, and personl detection using multimodal sensors at border cross-ings. There are several possible extensions on the current work: (1) Re-search on robust feature representation. As shown in experimental results in the above two cases, traditional features such as PLP do not perform well in noisy conditions. Recent literature on deep belief networks and sparse coding has provided robust feature representation in many signal processing domains [59–61]. (2) Research on discriminative models such as conditional random fields [62], which has been demonstrated to provide more discrimina-tive power than HMM. (3) Bridging the semantic gap. The events we studied in this thesis are defined in a low semantic level. Recently, TRECVID Mul-timedia Event Detection tasks have been focused on events with high-level semantic meanings such as “making a cake” [63]. It provides a great chal-lenge in modeling the high-level semantic events. (4) Expand current system to sensor network. It is possible to further extend the current fusion system to create a tracking system based on sensor network fusion. There are inter-esting questions in the large-scale sensor network, such as how to efficiently allocate sensors given time/energy/cost constraints, and how to combine
re-sults from different sensors in different modalities. To sum up, there are many possible directions to follow, both theoretical and applied, in regard to multimodal feature representation and multimodal fusion for related tasks.
REFERENCES
[1] A. Temko, “CLEAR 2007 AED evaluation plan,” 2007. [Online]. Available: http://clear-evaluation.org/
[2] P.-S. Huang, T. Damarla, and M. Hasegawa-Johnson, “Multi-sensory features for personnel detection at border crossings,” inInformation Fu-sion (FUSION), 2011 Proceedings of the 14th International Conference on, July 2011, pp. 1–8.
[3] M. Pantic and L. Rothkrantz, “Toward an affect-sensitive multimodal human-computer interaction,” Proceedings of the IEEE, vol. 91, no. 9, pp. 1370–1390, Sept. 2003.
[4] Netcarity, “Ambient technology to support older people at home.” [Online]. Available: http://www.netcarity.org
[5] A. F. Smeaton, P. Over, and W. Kraaij, “High-level feature detection from video in TRECVid: a 5-year retrospective of achievements,” in
Multimedia Content Analysis, ser. Signals and Communication Technol-ogy. Springer US, 2009, pp. 1–24.
[6] A. Temko, R. Malkin, C. Zieger, C. Nadeu, and M. Omologo, “Acoustic event detection and classification in smart-room environments: Evalu-ation of CHIL project systems,” IV Jornadas en Tecnolog´ıa del Habla, Zaragoza, vol. 4, Nov. 2006.
[7] C. Clavel, T. Ehrette, and G. Richard, “Events detection for an audio-based surveillance system,” in IEEE International Conference on Mul-timedia and Expo, 2005, pp. 1306–1309.
[8] F. Beaufays, D. Boies, M. Weintraub, and Q. Zhu, “Using speech/non-speech detection to bias recognition search on noisy data,” in IEEE International Conference on Acoustics, Speech, and Signal Processing, vol. 1, 2003, pp. I: 424–427.
[9] G. J. Brown and M. Cooke, “Computational auditory scene analysis,”
[10] T. Zhang and C. C. Jay Kuo, “Audio content analysis for online au-diovisual data segmentation and classification,” IEEE Transactions on Speech and Audio Processing, vol. 9, no. 4, pp. 441–457, 2001.
[11] L. Lu, H.-J. Zhang, S. Member, and H. Jiang, “Content analysis for audio classification and segmentation,” IEEE Transactions on Speech and Audio Processing, vol. 10, no. 7, pp. 504–516, 2002.
[12] M. Naphade, A. Garg, and T. Huang, “Duration dependent input output Markov models for audio-visual event detection,” in Multimedia and Expo, IEEE International Conference on, Aug. 2001, pp. 253–256. [13] C. Clavel, T. Ehrette, and G. Richard, “Events detection for an
audio-based surveillance system,” inMultimedia and Expo, IEEE International Conference on, July 2005, pp. 1306–1309.
[14] J. Pinquier, J.-L. Rouas, and R. Andr-Obrecht, “Robust speech / mu-sic classification in audio documents.” in International Conference on Spoken Language Processing (ICSLP), vol. 3, 2002, pp. 2005–2008. [15] J. Smith, J. Earis, and A. Woodcock, “Establishing a gold standard for
manual cough counting: video versus digital audio recordings,” Cough, vol. 2, no. 1, p. 6, 2006.
[16] M. Baillie and J. M. Jose, “Audio-based event detection for sports video,” in Proceedings of the 2nd international conference on Image and video retrieval, ser. CIVR’03. Berlin, Heidelberg: Springer-Verlag, 2003, pp. 300–309.
[17] X. Zhuang, X. Zhou, M. A. Hasegawa-Johnson, and T. S. Huang, “Real-world acoustic event detection,” Pattern Recognition Letters, vol. 31, no. 12, pp. 1543–1551, 2010.
[18] S. Nakamura, “Statistical multimodal integration for audio-visual speech processing,” IEEE Transactions on Neural Networks, vol. 13, no. 4, pp. 854–866, 2002.
[19] S. M. Chu and T. S. Huang, “Bimodal speech recognition using coupled hidden Markov models,” in ICSLP, 2000, pp. 747–750.
[20] M. Hasegawa-Johnson, K. Livescu, P. Lal, and K. Saenko, “Audiovisual speech recognition with articulator positions as hidden variables,” in
International Congress on Phonetic Sciences (ICPhS), August 2007, pp. 297–302.
[21] C. Canton-Ferrer, T. Butko, C. Segura, X. Giro, C. Nadeu, J. Hernando, and J. Casas, “Audiovisual event detection towards scene understand-ing,” in IEEE Computer Society Conference on Computer Vision and Pattern Recognition Workshops, 2009, pp. 81–88.