Contents lists available at ScienceDirect
Medical
Image
Analysis
journal homepage: www.elsevier.com/locate/media
Directional
wavelet
based
features
for
colonic
polyp
classification
R
Georg Wimmer
a,∗, Toru Tamaki
c, J.J.W. Tischendorf
e, Michael Häfner
b, Shigeto Yoshida
d,
Shinji Tanaka
d, Andreas Uhl
aaUniversityofSalzburg,DepartmentofComputerSciences,JakobHaringerstrasse2,5020Salzburg,Austria bSt.ElisabethHospital,LandstraßerHauptstraße4a,A-1030Vienna,Austria
cHiroshimaUniversity,DepartmentofInformationEngineering,GraduateSchoolofEngineering,1-4-1Kagamiyama,Higashi-hiroshima,Hiroshima 739-8527,Japan
dHiroshimaUniversityHospital,DepartmentofEndoscopy,1-2-3Kasumi,Minami-ku,Hiroshima734-8551,Japan
eMedicalDepartmentIII(Gastroenterology,HepatologyandMetabolicDiseases),RWTHAachenUniversityHospital,Paulwelsstr.30,52072Aachen,Germany
a
r
t
i
c
l
e
i
n
f
o
Articlehistory:
Received22July2015 Revised8February2016 Accepted9February2016 Availableonline16February2016
Keywords: Polypclassification Wavelet Curvelet Contourlet Shearlet
a
b
s
t
r
a
c
t
Inthiswork,variouswaveletbasedmethodslikethediscretewavelettransform,thedual-treecomplex
wavelettransform,theGaborwavelettransform,curvelets,contourletsandshearletsareappliedforthe
automatedclassificationofcolonicpolyps.Themethodsaretestedon8HD-endoscopicimagedatabases,
whereeachdatabaseisacquiredusingdifferentimagingmodalities(Pentax’si-Scantechnologycombined
withorwithoutstainingthemucosa),2NBIhigh-magnificationdatabasesandonedatabasewith
chro-moscopyhigh-magnificationimages.
Toevaluatethesuitabilityofthewaveletbasedmethodswithrespecttotheclassificationofcolonic polyps,theclassificationperformancesof3wavelettransformsandthemorerecentcurvelets,contourlets
and shearlets arecompared usingacommon framework.Wavelet transforms werealreadyoften and
successfullyappliedtotheclassificationofcolonicpolyps,whereascurvelets,contourletsand shearlets havenotbeenusedforthispurposesofar.
We applydifferentfeatureextraction techniquestoextractthe informationofthesubbandsofthe
waveletbasedmethods.Mostoftheintotal25approacheswerealreadypublishedindifferenttexture
classificationcontexts.Thus,theaimisalsotoassessandcomparetheirclassificationperformanceusing
acommonframework. Threeofthe 25 approaches arenovel.Thesethree approaches extract Weibull
featuresfrom thesubbandsofcurvelets, contourletsand shearlets.Additionally,5 state-of-the-artnon
waveletbasedmethodsareappliedtoourdatabasessothatwecancomparetheirresultswiththoseof
thewaveletbasedmethods.
It turnedoutthatextracting Weibulldistributionparametersfrom thesubband coefficients
gener-allyleadstohighclassificationresults,especiallyforthedual-treecomplexwavelettransform,the
Ga-borwavelettransformandtheShearlettransform.Thesethreewaveletbasedtransformsincombination
withWeibullfeaturesevenoutperformthestate-of-the-artmethodsonmostofthedatabases.Wewill
alsoshow that theWeibulldistributionis bettersuitedto modelthe subband coefficientdistribution
thanothercommonlyusedprobability distributionslikethe Gaussiandistributionand thegeneralized
Gaussiandistribution.
Sothisworkgivesareasonablesummaryofwavelet basedmethodsforcolonicpolypclassification
andthehugeamountofendoscopicpolypdatabasesusedforourexperimentsassuresahighsignificance
oftheachievedresults.
© 2016TheAuthors.PublishedbyElsevierB.V. ThisisanopenaccessarticleundertheCCBYlicense(http://creativecommons.org/licenses/by/4.0/).
R “ThispaperwasrecommendedforpublicationbyNicholasAyache”.
∗ Correspondingauthor.
E-mailaddresses:[email protected](G.Wimmer),[email protected]
(A.Uhl).
1. Introduction
In this paper, waveletbased methods are applied for the
au-tomated classification of colonic polyps in endoscopic images.
Wavelet transforms like the discrete wavelet transform (DWT),
the dual-tree complex wavelet transform (DT-CWT) and the
Ga-borwavelettransformationhavebeenwidelyusedforthepurpose
http://dx.doi.org/10.1016/j.media.2016.02.001
of medicalimage analysis.In caseof colonic polyp classification, especiallytheDT-CWTprovedtobe quitesuitableforthe distinc-tionofdifferenttypesofpolypsascanbeseeninnumerous previ-ouspaperslikee.g.Häfneretal.(2015a);2009);2010)AlsoGabor waveletshaveprovedtobequitesuitableforcolonic polyp classi-fication (YuanandMeng,2014;Häfneretal., 2009)anddetection (HwangandCelebi,2010).TheDT-CWTandtheGaborwaveletsare bothdirectionalselectivewavelettransforms,contrarytothe clas-sical DWT. It hasbeen shownin Häfneret al.(2009), that these twodirectional selectivewavelettransformsprovidebetterresults than theDWT.So enhanced directionalselectivity maybean ad-vantageclassifyingpolyps.
Basedonthewavelettheory,newmultiresolutionanalysistools likethecurvelet,contourletandshearlettransformhavebeen de-veloped.Thesetransforms(furtherdenotedasLets)areevenmore directional selective than the DT-CWT andGabor transformation. Tothebestofourknowledge,untilnowsolelythecurvelet trans-formwasapplied forthe automateddetection orclassificationof polyps, howeversolely forsmallbowel tumorsusing capsule en-doscopy(Barbosaetal.,2009;Martinsetal.,2010).
Inthispaperweuseacommonframeworktocomparethe
re-sults of the wavelet transforms and Lets for the classification of colonicpolypinendoscopicimages.Tothebestofourknowledge, there hasnot beena comparisonof wavelettransforms andLets with respect to theclassification ofimages so far (the same ap-plies forrelated issues likeimage retrieval or patternandobject recognition).SoinspiteofthesimilarityofwaveletsandLets,this isthefirstpublicationwhichsystematicallycomparesthese trans-forms with respect to their suitability to classify texture images. In orderto ensurea faircomparison ofthe waveletbased meth-ods, we extract the same features (Gaussian, generalized Gaus-sianandWeibulldistributionparameters)andusethesame num-ber ofscalelevels foreach method.Toensurea highsignificance of the results, the wavelet based methods are applied to a total of11differentendoscopicpolypdatabases.Featureextraction ap-proachesusingwavelettransformsalreadyprovedtobean appro-priatechoiceinvariouspublications.Bymeansofourtestwewill seeifthesameappliestocurvelets,contourletsandshearlets. Ad-ditionally we reimplemented some Let-basedtexture recognition
approaches and applied them to the classification of our polyp
databases to have a higher variability of extracted features and tofindout whichfeatures extractedfromLetsaremost appropri-atefor ourtask.Theresults ofthewavelet basedapproachesare compared withthoseof 5non-waveletbased state-of-the-art ap-proachesincolonicpolypclassification.
But first let us introduce and motivate the employed wavelet basedtransforms:
Wavelet transforms use filterbanks to form a time-frequency
representation for continuous-time signals. The main difference
between the wavelet transform and the Fourier transform (FT)
is that wavelets are localized in time and frequency whereas
the standardFouriertransformis onlylocalizedinfrequency. Be-cause of the uncertainty principle, originally found and formu-latedbyHeisenberg,thefrequencyandtimeinformationofa sig-nal atsome certain point inthe time-frequency plane cannot be
known. In other words: we cannot know what spectral
compo-nent exists at any given time instant. The best we can do is to investigate what spectral components exist at any given
inter-val. The wavelet transform deals with that problem by
decom-posing a signal in frequency bands (called subbands), where the higherfrequencybandsarebetterresolved intime(withless rel-ativeerror) andthe lowerfrequencybands arebetter resolvedin frequency.
Waveletsarewidelyusedfordatacompression,signalanalysis, signal reconstruction, denoising, etc. One ofthe mostuseful fea-turesofwaveletsistheir abilitytoefficientlyapproximatesignals,
Fig.1. Waveletvsnewscheme:anillustrationofthesuccessiverefinementbythe twosystemsnearasmoothcontour,whichisshownastheblackcurveseparating twosmoothregions.
thatmeanstorepresentasignalasaccuratelyaspossiblebymeans ofaminimum ofsubbandcoefficients. Especiallyforsignalswith pointwisesingularities,theDWT ismuchmore efficientthan the Fouriertransform.Thismotivateswhywavelettransformsarenow beingadopted for a vast number ofapplications, often replacing theconventionalFouriertransform.
However,theDWTdoesnotperformaswellwith
multidimen-sionaldata.Indeed,theDWTisveryefficientindealingwith point-wisesingularitiesonly.Inhigherdimensions,othertypesof singu-larities(e.g.edgesinimages)areusuallypresentorevendominant, andtheDWTandothertraditionalwaveletmethodsareunableto handlethemefficiently.Inordertoovercomethislimitationof tra-ditionalwavelets,one hastoincrease their directional sensitivity. Twowell knowndirectional selectivewavelet transforms are the Dual-treecomplexwavelettransform(DT-CWT)(Kingsbury,1998) andtheGaborwavelettransform(Lee,1996).
Basedonthewavelettheory,newmultiresolutionanalysistools havebeendevelopedthatareespeciallydesignedtoefficiently rep-resentate edges and curves in 2-dimensional data. The idea be-hindthisnewschemescanbedescribedbythefollowingscenario (Easleyetal.,2008).Imaginethattherearetwopainters,onewith a“wavelet”-styleandtheotherusingthenewscheme,whereboth wish to paint a natural scene. Both painters apply a refinement techniqueto increase resolutionfrom coarse tofine. Efficiency is measuredbythenumberofbrushstrokes neededtofaithfully re-coverthescene.We considerthesituationthatasmooth contour hastobepaintedlikeshowninFig.1.
2-D wavelets are constructed from tensor products of 1-D
wavelets,so the “wavelet”-style painteris limited to use square-shaped brush strokes along the contour, using sizes correspond-ing to the multiresolution structure of wavelets. As the resolu-tion becomesfiner, we clearly see the limitationsof the painter,
who needs to usemany “dots” to capture the contour. The new
stylepainter,ontheotherhand,ismuchmoreeffectivebymaking brushstrokeswithdifferentlyelongated shapes, wherethe direc-tionsoftheshapesfollowsthecontour.Thatmeansmanywavelet coefficientsareneededtoaccountforedgesorcurvesanditwould befar moreeffectivetohavestronglyanisotropic filtersto repre-sentedges ofcurves.Thisideawasimplementedby anumberof
newwavelet-based approaches.The most established approaches
using this new scheme are the curvelet transform (Candes and
Donoho, 2002), the contourlet transform (Do and Vetterli, 2005) andtheshearlettransform(Easleyetal.,2008).Wefurtherdenote thesetransformsas“Lets”.
TheseLetsusenon-separablefilterswhichhaveelongated sup-portsatvariousscales, directionsandaspect ratios (thefiner the scale,the higheristhe aspectration orinother wordsthe more elongatedarethesupports).Thisallowsanefficientapproximation ofsmoothcontoursatmultipleresolutionsinmuchthesameway asthenewschemeshowninFig.1.Moreover,theseLetsareable tousedifferentnumbersofdirectionsateachscale(generally,the finerthescale,themoredirections).
Thecontributionsofthismanuscriptareasfollows:
• We apply a total of 25 wavelet based methods for the
auto-matedclassificationofcolonicpolyps.5methodsare basedon thecurvelettransform,5onthecontourlettransform,6onthe
shearlettransform, 3ontheDWT,3ontheDT-CWT and3on
the Gabor transformation.By means oftheseexperiments we
areabletocompareLetsandwaveletmethodswithrespectto their classificationperformance.Mostofthemethodswere al-readyproposedindifferenttextureclassificationcontexts,but
three of these methods are novel to the best of our
knowl-edge. In thesethree methods, the subbandcoefficients ofthe curvelet,contourletandshearlettransformaremodeledbythe 2parameterWeibulldistribution.Wewillshow thatmodeling the subbandcoefficientsby means ofthe Weibulldistribution generallyleadstothebestresultsforclassifyingcolonicpolyps usingwaveletbasedmethods.
• WeapplytheKolmogorov–SmirnovtestasGoodness-of-Fittest andshowthattheWeibulldistributioniswellsuitedtomodel thesubbandcoefficientdistributionofthewaveletbased trans-forms, which explains the superior results using Weibull
fea-tures. It will turn out that the subbands are not actually
Weibulldistributed,butatleastalmostWeibulldistributed. • Forourexperiments weuse atotal of11differentendoscopic
databases.8databasesaregatheredusingaHD-endoscopewith 8differentimagingmodalities(Pentax’s i-Scanincombination withstainingthe mucosa),1databasesis gatheredusinghigh
magnification endoscopy (or also called zoom-endoscopy) in
combination withstainingthe mucosa andtwo databasesare
gatheredusingazoom-endoscopyincombinationwithnarrow
bandimaging(NBI).Soweuseaquitecomprehensivecollection ofdatabasesfortheclassificationofcolonicpolyps.Theresults ofthemethodsarecomparedandthedifferencesbetweenthe methodsaswellastheirimpactstotheresultsareanalyzed. • 5 (non wavelet based) state-of-the-artapproaches for colonic
polyp classification are applied to the classification of our
databases to compare their results with the results of the
wavelet based methods. In this way we are able to find out
if there are wavelet-based methods that can compete with
state-of-the-art approaches. We will see that some of the
wavelet-based methods even outperform the state-of-the-art
approaches,whileothersperformequallyorinferiorcompared tothestate-of-the-artapproaches.
Thispaperisorganizedasfollows.InSection2webriefly intro-ducetheconceptofthecomputer-assisteddiagnosisofpolyps us-ingmucosatexturepatchesandreviewthecorresponding state-of-the-art.InSection3,we describeandcomparethewaveletbased approaches.The experimental setup, the used databases andthe resultsare presentedin Section 4.Section 5presents the discus-sionandSection6concludesourwork.
2. Colonicpolypclassification
Colonic polyps are a rather frequent finding and are known
to either develop into cancer or to be precursors of colon can-cer.Hence,anearlyassessmentofthemalignantpotentialofsuch polypsisimportantasthiscanlowerthemortalityratedrastically.
As a consequence,a regular colon examination is recommended,
especiallyforpeople atanageof50yearsandolder.Thecurrent goldstandardfortheexaminationofthecoloniscolonoscopy us-ingacolonoscope.Modernendoscopydevicesareabletotake pic-turesorvideosfrominsidethecolon,allowingtoobtainimages(or videos)foracomputer-assistedanalysiswiththegoalofdetecting anddiagnosingabnormalities.
Colonicpolyps areusually dividedintohyperplastic, adenoma-tousandmalignantpolyps.Inordertodetermineadiagnosisbased
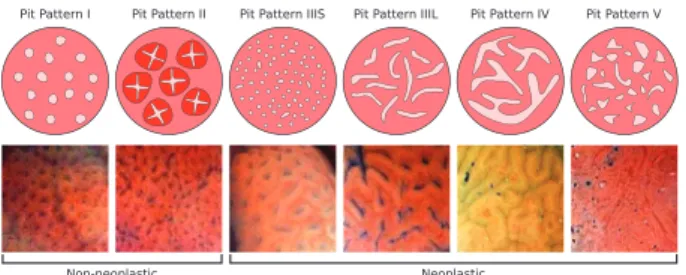
Fig. 2. The6pitpattern typesalong with exemplarimages andtheir assigned classesincaseofatwoclass(non-neoplasticvsneoplastic)differentiation.
onthevisual appearanceofcolonic polyps,thepit pattern classi-ficationschemewasproposed byKudoetal.(1994).Apit pattern referstotheshapeofapit,theopeningofacolorectalcrypt.The variouspitpatterntypesandexemplar(zoom-endoscopic)images oftheclassesarepresentedinFig.2.Thepitpatternclassification schemedifferentiates between sixtypes.TypeI(normal mucosa) andII(hyperplasticpolyps)arecharacteristicsofnon-neoplastic le-sions, type III-S, III-L and IV are typical for adenomatous polyps andtypeVisstronglysuggestivetomalignantcancer.
So this classification scheme allows to differentiate between
normal mucosa and hyperplastic lesions, adenomas (a
pre-malignant condition), and malignant cancer based on the visual patternofthemucosalsurface.Theremovalofhyperplasticpolyps
is unnecessary andthe removalof malignant polyps maybe
haz-ardous.Inthisworkweusethe2-classclassificationscheme differ-entiatingbetweennon-neoplasticandneoplasticlesions.This clas-sificationschemeisquite relevantinclinicalpracticeasindicated inastudybyKatoetal.(2006).
Foraneasierdetectionanddiagnosisoftheextentofmucosal
lesions,twocommonmucosalenhancementtechnologieswere
de-veloped:
1. Conventionalchromoendoscopy(CC) came intoclinical use40 years ago. By staining the mucosa using (indigocarmine) dye spray,itiseasiertodetectanddifferentiatecolonicpolyps. CC isoftenusedinconjunctionwithhigh-resolutionor magnifica-tionendoscopy.
2. Digitalchromoendoscopyisatechniquetofacilitate “chromoen-doscopywithoutdyes” (Kiesslich,2009).Thestrategiesfollowed bymajormanufacturersdifferinthisarea:
• In Narrow band imaging (NBI,Olympus), narrowbandpass
filters are placed in front of a conventional white-light source to enhance the detailof certain aspects of the sur-faceofthemucosa.
• The i-Scan (Pentax) image processing technology
(KodashimaandFujishiro,2010)isadigitalcontrastmethod
which consists of combinations of surface enhancement,
contrastenhancementandtoneenhancement.
The FICE system (Fujinon) decomposes images by
wave-lengthandthendirectlyreconstructsimageswithenhanced mucosalsurfacecontrast.
Bothsystems(i-ScanandFICE)applypost-processingtothe reflected light andthus are called“computed virtual
chro-moendoscopy(CVC)”.
Previous works for the computer assisted classification of
colonic polyps using highlydetailedimages gatheredfrom endo-scopes in combinationwith different imagingmodalities, can be dividedinthreecategories:
• High definition (HD) endoscope combined with or without
stainingthemucosaandthei-Scantechnology:
InHäfneretal. (2014a),shape andcontrast features were ex-tractedfromblobsandinHäfneretal.(2015b);2014c)fractal analysisbasedfeatureswereextracted.
• High-magnificationchromoendoscopy:
InHäfneretal.(2012c),thepitdensitywasestimatedusing De-launaytriangulation,localbinarypatternsbasedfeatures were usedinHäfneretal.(2009)andHäfneretal.(2012a) and fea-tures fromwavelettransforms were extractedinHäfneret al. (2008);2009);2010);2015a).
• High-magnificationendoscopycombinedwithNBI:
Tamaki et al. (2013) extracted dense SIFT features and Gross etal.(2012)extractedfeaturesdescribingthevesselstructure. In this work we use endoscopic image databases of all three categories.
One of the aims of thiswork is to compare the classification resultsofthedatabasesofallthreecategories.
In addition to classical endoscopy, endomicroscopy,computed
tomography (CT) and wireless capsule endoscopy can be used
fortheexaminationofthegastro-intestinal tract.Endomicroscopy (Jabbour etal., 2012) is a technique to obtain histology-like im-agesandisalsoknownas‘opticalbiopsy’.ForexampleAndr˙eetal. (2011); 2012) showed approachesbased on semantics and visual concepts forthe automateddiagnosis ofcolonic polypsusing en-domicroscopy.CTcolonography,alsoknownasvirtualcolonoscopy, is a minimally invasive technique for the investigation of the colon. An example showinga detection andclassification system
based on Curvature Analysis using CT colonography can be seen
inChowdhuryetal.(2008).Wirelesscapsuleendoscopy(Iakovidis andKoulaouzidis (2015); Yuce andDissanayake(2012)) ismainly used toexamineparts ofthegastrointestinaltractthat cannot or
only hardly be seen with other types of endoscopes (the small
bowel).Thecapsulehasthesizeandshapeofapillandcontainsa tiny camera.After apatientswallowsthecapsule,it takesimages oftheinsideofthegastro-intestinaltract.Anexampleforthe auto-mateddetectionandclassificationofcolonicpolyps usingcapsule endoscopycanbeseeninRomainetal.(2013).
2.1. HDendoscopycombinedwiththei-Scantechnologyand chromoendoscopy
In thisworkwe usea total of8image databases gatheredby HD endoscopy.HD-endoscopyhastheadvantageofanhigher res-olutioncomparedtostandarddefinitionendoscopes.Eachdatabase isgatheredbyadifferentcombinationofthei-Scantechnologyand CC,respectivelynoCC.
Thethreei-Scanmodesareasfollows:
1. i-Scan 1includes surfaceenhancement andcontrast
enhance-ment. Surface enhancement mode augments pit pattern and
surfacedetails,providingassistancetothedetectionof dysplas-ticareas.Thismodeenhanceslight-to-darkcontrastby obtain-ingluminance intensitydata foreach pixelandadjustingitto accentuatemucosalsurfaces.
2. i-Scan2 includes surfaceenhancement,contrast enhancement
andtoneenhancement. Expands on i-Scan 1by adjusting the
surface and contrast enhancement settings and adding tone
enhancement attributes to the image. It assists by intensify-ing boundaries, margins, surface architecture and difficult-to-discernpolyps.
3. i-Scan 3 also includes surface enhancement, contrast
en-hancement and tone enhancement. Similar to i-Scan 2, with
increased illumination and emphasis on the visualization of vascular features. Thismode accentuates patternand vascular architecture.
InFig.3weseeanimageshowinganadenomatouspolyp with-outimageenhancementtechnology(a),exampleimagesusingCVC (b,c,d), animage usingCC (e)andimagescombiningCC andCVC by using the i-Scan technology to visually enhance the already stainedmucosa(f,g,h).
Fig. 3. Imagesof apolyp usingdigital (i-Scan) and/or conventional chromoen-doscopy(CC).
Fig.4. ExampleimagesofthetwoclassesobtainedbyaHDendoscopeusinga combinationofCCandi-Scanmode2.
InFig.4 we seeexemplarimagesof thetwo classes(denoted asclass“Non-neoplastic” andclass“Neoplastic”)obtainedbyaHD endoscopeusingacombinationofCCandi-Scanmode2.
InthisworkwewillexaminetheeffectsofcombinationsofCVC andCContheclassificationresults.
2.2.Highmagnificationendoscopyincombinationwith chromoendoscopy
High magnification endoscopes are defined by the ability to
performoptical zoomby usinga moveable lens inthe tipof the endoscope.Inthatwaymagnifiedimagesareobtainedwithout los-ing displayquality.High magnification endoscopyenablesthe vi-sualization ofmucosal details that cannot be seen withstandard endoscopy.The CC-high-magnification databaseis gathered using
zoom-endoscopyincombinationwithchromoendoscopy.Example
imagesoftheclassescanbeseeninFig.2.
2.3.High-magnificationendoscopyincombinationwithNBI
NBI(Gonoetal., 2003)isavideoendoscopicsystemusingRGB rotaryfiltersplacedinfrontofawhitelightsourcetonarrowthe bandwidthofthespectraltransmittance.NBIenhancesthe visibil-ityofmicrovessels andtheir fine structure onthe colorectal sur-face.Alsothepitsareindirectlyobservable,sincethemicrovessels betweenthe pitsare enhancedinblack,whilethepits areleft in white.
InthisworkweusetwoNBI-high-magnificationdatabases.
For one database, further denoted as the
NBI-high-magnification database Aachen, image labels were provided
according to their histological diagnosis (like for the previously presenteddatabases). Exemplar imagesof thetwo classes ofthis databasecanbeseeninFig.5.
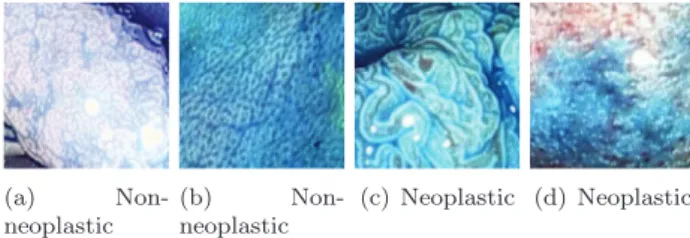
For the second database, further denoted as the
NBI-high-magnificationdatabaseHiroshima,imagelabelswereprovided ac-cordingtotheopticalappearance ofthepolyps.Theimageswere
Fig. 5. Examples images of the two classes from the NBI-high-magnification databaseAachen.
Fig. 6. Examples images of the two classes from the NBI-high-magnification databaseHiroshima.
labeledbyatleasttwomedicaldoctorsandendoscopistswhoare experienced in colorectal cancer andNBI classification. Exemplar imagesofthetwoclassesofthisdatabasecanbeseeninFig.6.
3. Waveletandwaveletbasedfeatureextractionapproaches
In this section we will describe thewavelet basedtransforms andtheemployedfeatureextractionapproaches.
3.1.The2-Ddiscretewavelettransform
The discretewavelettransform(DWT)(Mallat,1989)generates frequencybandsbyapplyinglow-pass(h)andhigh-pass (g)filters totheinputsignalfollowedbyasubsamplingofthefilteroutputs withfactor2.Toincrease thefrequencyresolution,the decompo-sitionisrepeatedbydecomposingtheoutputsofthelowpass fil-tering.(seeFig.7).
This results in a binary tree with nodes representing a sub spacewithdifferent time-frequency localization(see Fig. 7). This treeisknownasfilterbank.Startingwithamotherwavelet
ψ
,the filtersψ
j,kareshiftedandscaledversionsofthemotherwavelet:ψ
j,k= 1 √ 2jψ
t−k2j 2j , (1)wherejisthescale(ordecompositionlevel)andkistheshift pa-rameterandbothareintegers.
L
L
Fig.7. TheDWTfilterbankanditsfrequencydomainrepresentation.
Fig.8. 1-level2-DDWTandtheresultingsubbands.
Fig.9. 3levelDT-CWTfilterbank.
Thenthewaveletcoefficient
γ
j,kofasignalx(t)iscomputedas follows:γ
j,k=∞
−∞x
(
t)
ψ
j,kdt.(2) Givenan image,the1-Dfilterbankisfirstappliedtotherows ofthe image andthen appliedto thecolumns ascan be seenin
Fig.8.
Like in Kwitt and Uhl (2010), we use the CDF 9/7 filters (Daubechies, 1992) forthe DWT, which are biorthogonalwavelet filters. If not stated otherwise, the DWT andalso the other em-ployedwaveletbasedtransformsare appliedtoRGBcolorimages using4decompositionlevels.
3.2. TheDT-CWT
Kingsbury’s dual-tree complex wavelet transform (Kingsbury,
1998) is designed toovercome two commonly known
shortcom-ings of the 2-D DWT, the lack of shift-invariance and the poor directional selectivity. The key concept of the DT-CWT in 1-D is to usetwo separate DWT decompositions(see Fig. 9), wherethe low-passfilterofonetreeisahalf-sample delayedversionofthe low-passfilteroftheothertreeandthefiltersofonetreearethe reverseofthefiltersoftheothertree.
The outputs of one tree can be interpreted as the real parts andtheoutputs oftheothertreecanbeinterpretedasthe imag-inarypartsofcomplexwaveletcoefficients. Theredundancyof2d (where dis thedimension ofthesignal beingtransformed) com-paredtotheDWTprovidesextrainformationforanalysis.The
DT-CWTleadstoa fixednumberof 6detailsubbands per
decompo-sitionlevelin2-D, capturingimage detailsorientedat≈ ±15°,≈ ±45°and≈ ±75°. InFig.10we seethefrequencytilingofa DT-CWTwithtwoscales.
3.3. TheGaborwavelettransform
Gaborwaveletsusecomplexfunctionsconstructedtoserveasa basisfortheFouriertransformsininformationtheoryapplications. TheGaborwavelettransformhasmulti-resolutionaswellas multi-orientationproperties.Gaborwaveletsminimizetheproductofits standarddeviationsinthetimeandfrequencydomain.Inthatway,
Fig.10. Contoursof70%peakmagnitudeofDT-CWTfiltersinthefrequencyplane.
Fig.11. Contoursofhalf-peakmagnitudeofGaborWaveletfiltersinthefrequency plane.
the uncertaintyin information(frequency resolution vstime res-olution) carried by this wavelet is minimized. It has been found thatthesimplecellsofthevisualcortexofmammalianbrainsare best modeled asa family ofself-similar 2D Gabor wavelets(Lee, 1996).
Ageneric2-DGaborfunction(ManjunathandMa,1996)canbe writtenas g
(
x,y)
= 1 2πσ
xσ
y e −1 2 x2 σ2 x+ y2 σ2 y +2 πiWx , (3)where
σ
x andσ
y are thebandwidths of thefilters andWisthe centralfrequency.Thisfunctioncanbedilatedandrotatedtogeta dictionaryoffilters.The Gabor wavelet transform (GWT) is parametrized by the
number of orientationsand scales and the lower (Ul) and upper (Uu)centerfrequencyofinterest,whichinfluencesthecalculation ofthescaling factorforthemotherwavelet.Redundancyis mini-mizedbychoosingthescalingfactorandthebandwidthofthe fil-terssothatthehalf-peakmagnitudesofthefilterresponsestouch eachother.ThefrequencytilingforaGWTusing6orientationsand 3scalescanbeseeninFig.11.
ManjunathandMa(1996)foundthatachoiceof4scalesand6 orientationswith center-frequency
(
Ul,Uu)
=(
0.05,0.4)
(resulting in ascaling factorof a=2) is optimalfortheir problem(texture analysis)andwechosethesameparametervalues.3.4. Thecurvelettransform
Thecontinuouscurvelettransform(CCT)isbasedontillingthe 2D Fourierspaceinpolar“wedges”,withhigherdirectional selec-tivityforhigherfrequencybands(seeFig.12(a)).
TheCCT(Candesetal., 2006)canbedefinedbyapairof win-dows W(r) (the radial window) and V(t) (the angular window). Bothare smooth,nonnegativeandreal-valued andare definedas
Fig.12. Thebasictilingofthefrequencyplaneofthecontinuous(a)anddiscrete (b)curvelettransform.
scaledMeyerwindowfunctions(Daubechies,1992):
W
(
r)
=⎧
⎪
⎪
⎨
⎪
⎪
⎩
cos[π
/2γ
(
3r−4)
] 4/3≤r≤5/3 1 5/6≤r≤4/3 cos[π
/2γ
(
5−6r)
] 2/3≤r≤5/6 0 else (4) V(
t)
=⎧
⎨
⎩
cos[π
/2γ
(
3|
t|
−1)
] 1/3≤|
t|
≤2/3 1|
t|
≤1/3 0 else (5)where
γ
isasmoothfunctionsatisfying:γ
(
x)
= 0 0≤x1 x≥1,
γ
(
x)
+γ
(
1−x)
=1 x∈R (6)Thefrequencywindow Ujis definedintheFourierdomainby
Uj
(
r,φ
)
=2−3 j/4 W(
2−jr)
V 2 j/2φ
2π
, (7)wherethe support of Uj isa polar“wedge” defined by the sup-portofWandVappliedwithscaledependentwindowwidth.The frequency window Uj corresponds to the Fourier transform of a curvelet
ϕ
j,whichcanbethoughtofasa“mother” curveletinthe sensethatthe2j/2 curveletsatscale2−jareobtainedbyrotations andtranslationsofϕ
j.ContrarytotheDT-CWTandtheGWT,whichonlycoverpartof thefrequencyspectruminthefrequencydomain,curveletshavea completecoverofthespectruminthefrequencydomain.
InCandesetal.(2006),twosecondgenerationdiscretecurvelet transforms (DCT’s) are proposed, the DCT via unequispaced FFTs (fastfouriertransforms)andtheDCTviawrapping.Wechose the wrapping based algorithm because it is the more often used al-gorithm forfeature extraction purposes. Thisalgorithm is imple-mented in the tool CurveLab (available at http://www.curvelet. org/). The DCT via wrapping uses a spatial grid to translate curveletsateachscaleandangleusing2-DFFT,withthe assump-tionthat“Cartesian” curveletsaredefinedinaregularrectangular grid (see Fig. 12(b)). Then foreach scale s=2−j andorientation
n,theproductofUj (thecurveletinFTdomain)andtheimagein FTdomainisobtained.Finallytheproductiswrappedaroundthe originandthe2-DinverseFFTisappliedtothewrappedproduct, resultingin the curveletcoefficientsat scale sand orientation n. ThefrequencytilingoftheDCTcanbeseeninFig.12(b).
Itshould benotedthat incaseoftheDCT thereis adifferent denotationofthescalelevelscomparedtothewavelettransforms. Scalelevel1oftheDCTdenotesthecoarsestscale leveland con-sistsofonlyoneundirectionalsubbandthatcanbe consideredas theapproximationsubbandorasthelowpasssubband.Scalelevels 2tillLincludethedirectionalsubbandsandcanbeconsideredas detailsubbands. The higherthe scalelevel, thefiner thescale of
Fig.13. Laplacianpyramiddecomposition.Theoutputsareacoarseapproximation
aandadifferencebbetweentheoriginalimageandtheprediction.
Fig.14. Thecontourletfilterbank:firstthemultiscaledecompositionintooctave bandsbymeansoftheLaplacianpyramiddecompositionsfollowedbythe applica-tionofadirectionalfilterbanktothebandpasschannels.
thesubbands(thehigherthefrequencycontentinthesubbands), whichistheexactoppositeofthewavelettransforms.Thatmeans comparinga5levelDCTanda4-levelwavelettransform(WT),the level1subbandoftheDCTcanbeconsideredastheapproximation
subband of the wavelet transformand the DCT subbands ofthe
levels{2,3,4,5}canbeconsideredasthelevel{4,3,2,1}subbandsof theWT(withrespecttothefrequencypartition).
Ifnotstatedotherwise,weemploycurveletsusingthefourDCT subbandlevels {2,3,4,5}with16level2subbands,32level3 sub-bands,32level4subbandsand64level5subbands.
3.5.Thecontourlettransform
In an attempt to provide a better discrete implementation of thecurvelets,thecontourletrepresentationhasbeenproposedby
Do and Vetterli (2005). The contourlet transform is designed to achieveessentiallythesamefrequencytilingasthecurvelet trans-form, however contourlets allow a different (selectable) number of directions at each scale and are not a discretization of the curvelets.
The multiscaledecompositionofthe contourlettransform(CT) isobtainedusingtheLaplacianpyramid(LP)decomposition(Burt andAdelson,1983).TheLPdecompositionateachlevelgeneratesa downsampledlow-passversionoftheimageandthedifference be-tweentheimageandtheprediction,resultinginabandpassimage. InFig.13wedepicttheLPdecomposition,whereHisthelowpass filter,GthesynthesisfilterandMthesamplingmatrix.
At each level,a directional filter bank(DFB) is applied to the bandpass image (b) that leads to a decomposition of 2l (l ∈ N )
subbandswithwedge-shaped frequencypartitioningasshown in
Fig.14.
The DFB (Do, 2001) is constructed from two building blocks. Thefirstoneisatwo-channelquincunxfilterbank(Vetterli,1984) thatdividesa2-D spectruminto2directions:horizontaland ver-tical.Thesecondbuildingblock oftheDFBisashearingoperator, whichamountstojustreorderingofimagesamples.
We use the CT implementation described in Do and Vetterli
(2005), which is public available (http://www.mathworks.com/ matlabcentral/fileexchange/8837-contourlet-toolbox).In allofour
Fig.15. STdecompositionusingtheLaplacianpyramidanddirectionalfiltering.
employedcontourletbasedapproaches,theCDF9/7filtersareused fortheCTdecomposition.Ifnotstatedotherwise,we employthe CTusingfourdecompositionlevelswith8orientationsperlevel.
3.6. Theshearlettransform
Thecontinuousshearlettransform(Easleyetal.,2008)isbased on parabolicscaling matricesAa to changetheresolution andon shearmatricesBstochangetheorientation:
Aj=
a 0 0 a1 /2 , Bs= 1 s 0 1 , (8) witha>0ands∈R. Theshearletsaregivenbyψ
a,s,k(
x)
=a3 /4ψ
(
BsAax−k)
, (9) wherek∈R2 isthetranslation.Thecontinuousshearlettransform isdefinedasthemappingfor f∈R:SHf
(
a,s,k)
=f,ψ
a,s,k. (10) The discrete shearlet transform (Easley et al., 2008) can be viewed asa simplifying theoretical justificationof the contourlet transform. The shearlet transformoffers moreflexibility than the contourletandcurvelettransform(thedirectionsperscaleandthe localsupport ofthe shearing filtersare selectable). Thefirst step of the discrete shearlet transform(ST) is to accomplish a multi-scalepartition usingtheLaplacianpyramiddecompositionsimilar to the contourlet transform. Then the 2-D FFT is applied to the resulting highpassimages. The samples inthe frequency domain aretakennotonaCartesiangrid,butalonglinesacrosstheorigin atvarious slopes,known aspseudo-polargrid. Inorderto obtain the directional localization, a band-pass filteringis applied using a frequency window function W, which islocalized on a pair of trapezoidsandconstructed fromthe shearing filters usingMeyer waveletsand whichisalso transformed tothe frequencydomain andtakenonthe pseudo-polargrid (fora moredetailed descrip-tionseeEasleyetal.(2008)).The finalstep istore-assemblethe Cartesian sampledvalues andapply the inverse2-D FFT. The ST-schemeisshowedinFig.15.The ST offers large flexibility in the choice of the frequency window andallows to choosean arbitrarynumberof directional subbands per decompositionlevelto adaptthe transformto spe-cificapplications.IncaseoftheDCT,onlythenumberofthe direc-tionalsubbands ofthesecond coarsestlevel(the coarsestlevelis thelow-passsubband)canbechosen,andeventhisnumberhasto beamultipleof4.AllotherdecompositionlevelsoftheDCThave
ofthedirectionalsubbandsinthesecondcoarsestlevel.Incaseof theCT,thenumberofsubbandscanbechosenfree,butthe num-bershavetobedyadic.
We use the 2D Shearlet Toolbox software (http://www.math.
uh.edu/˜ dlabate/software.html),whichisdescribedinEasleyetal. (2008).It shouldbe notedthatcontrarytothe STschemeshown in Fig. 15, we use the nonsubsampled shearlet transform using thenonsubsampledLaplacianpyramidtransform.Sincealreadythe normalSTishighlyredundantbecauseofthemissinganisotropic subsampling,thenonsubsampledshearlettransformisevenmore redundant.TheST subbandsare allofthesame sizeastheinput image(likefortheGWT).
Ifnotstatedotherwise,weemploytheSTusingfour decompo-sitionlevelswith8orientationsperlevelandshearingfilterswith asupportsizeof32×32.
3.7. Preprocessing
Inthisworkweapplythreepreprocessingstepsbeforeeachof thewaveletbasedmethods.
Thefirstpreprocessingstepremovesspecularreflections,which oftenoccurinendoscopicimagesandhaveamajorimpacttothe resultingsubbandcoefficientsinaffectedareas.Reflectionsare de-tected by thresholding the Saturation andgrayscale values of an image.SimilartoStehleetal.(2009),apixelisidentifiedaspartof aspecularreflectionifitsgrayvalueisgreateras235andits Sat-uration issmallerthan0.09.As thiskindofsegmentation usually tends to a under-segmentation, a morphological dilation using a discofradiusr=5asthestructuringelementisappliedtoenlarge thesegmentedarea.ThesegmentedareaissettotheaverageRGB colorvaluesoftheadjacentpixelsofthesegmentedarea.Toavoid sharptransitions betweenthesegmentedarea andthe surround-ingarea,thepixelssurroundingthesegmentedareawithlessthan 4pixelsdistancetothesegmentedareaareGaussianblurredusing
σ
=2anda10×10mask.The most important preprocessing step is contrast-limited
adaptivehistogramequalization(CLAHE)Zuiderveld(1994).CLAHE isusedtoenhancethecontrastandremovenoiseandintensity in-homogeneities.CLAHEisappliedusing8×8tilesandanuniform distributionforconstructingthecontrasttransferfunction.CLAHE operates on small regions in the image, called tiles, rather than theentireimage.Eachtile’scontrastisenhanced,sothatthe his-togramoftheoutputimageisapproximatelyflat.CLAHEdistinctly enhancestheresultsofthewaveletbasedmethods.
Inthe finalpreprocessing step,theimagesare(slightly) Gaus-sianblurredusing
σ
=0.5anda3×3mask.Thisstepisdoneto slightlysmooththeimagesandtoremovenoise.If not statedotherwise, the employed waveletbased methods are preprocessedusingthepreviously describedthreesteps,even ifthe methods are originallyproposed using differentorno pre-processing methods. Foreach method, theachieved classification rates increaseusing ourpreprocessingapproach compared tothe originally proposedpreprocessingapproachesornopreprocessing atall.
3.8. Featureextractionofthewaveletbasedmethods
Foreach of thewavelet basedtransforms (DWT, DT-CWT,
Ga-borwavelets,curvelet,contourletandshearlettransform),the
dis-tribution of the subband coefficients is once modeled by means
of the Gaussian distribution, the GGD and the Weibull distribu-tion (Evansand Peacock,2000; KwittandUhl, 2007). The Gaus-sian distribution andthe Weibull distribution are used to model
the subbandcoefficient magnitudes,whereas the GGD isused to
model the original subband coefficientsin case of the employed
wavelettransforms producingreal valuedcoefficients(DWT, con-tourletsandshearlets)andthesubbandcoefficient magnitudesin caseoftheemployed wavelettransforms producingcomplex val-uedsubbandcoefficients(DT-CWT,Gaborwaveletsandcurvelets).
We chose the Gaussian distribution because extracting mean
andstandard deviation(the two parameters of the Gaussian dis-tribution)ofsubbandcoefficientsisprobablythemostknownand most used approach to extract features of wavelet based trans-forms.TheGGDisalsoawidelyusedfeaturetoextractinformation fromsubbandsofwaveletbasedtransformsanditisabletomodel thesubbandcoefficientdistributionsmoreaccuratethanthe Gaus-siandistribution.Infact,thesubbandsofvarioustypesofwavelet transforms(with realvalued subbandcoefficients) are well mod-eledusingtheGGD(DoandVetterli,2002).TheWeibull distribu-tionhasbeenchosenbecauseitalreadyhasbeensuccessfullyused forthe classification of polyps in combination withthe DT-CWT andbecauseitisabletoaccuratelymodelthesubbandcoefficient distributionofallemployedwaveletbasedtransforms,contraryto theGaussiandistributionandtheGGD(seeSection5.1).
TheprobabilitydistributionoftheGGD(DoandVetterli,2002) isdefinedas
p
(
x;μ
,α
,β
)
=2α
(
β
1/
β
)
e−(|x−μ|/α)β
, (11)
where
(.)denotesthegammafunction,
μ
isthemean,α
thescale parameterandβ
theshapeparameter.Onlytheparametersα
andβ
areextractedasfeaturesfromthesubbandsforfurther classifi-cation.DistancesbetweenGGDfeaturevectorsaremeasuredusing theKullback–Leiblerdistance(DoandVetterli, 2002),which isin caseoftheGGDdefinedasD
(
p(
.;α
1 ,β
1)
,||
p(
.;α
2 ,β
2))
=logβ
1α
2(
1/β
2)
β
2α
1(
1/β
1)
− 1β
1 +α
1α
2β
2((
β
2 +1)
/β
1)
γ
(
1/β
1)
. (12) Theprobability densityfunction ofa Weibulldistributionwith shapeparametercandscaleparameterbisgivenbyp
(
x;c,b)
=⎧
⎨
⎩
c b x b c−1 e−(
xb)
c forx≥0, 0forx<0, (13)whereb>0andc>0.ThetwoparametersoftheWeibull distri-butionare estimated usingthe methodofmoments (Niolaetal., 2006).
IncaseoftheGaussian andWeibulldistribution,the resulting featurevectorsare L2 -normalized anddistancesbetweenthe fea-ture vectors are measured using the Euclidean distance. The L2 -normalizationis importantto balance thedifferent ranges of co-efficientvaluesperdecompositionlevel.Allouremployedwavelet basedtransformshaveincommonthatthecoefficientsinthe sub-bandsrepresentingthecoarserimagedetailsaremuchhigherthan thecoefficientsin thesubbands representingthe finerimage de-tails. Givenour d-dimensionalsamples
v
1 ,...,v
n,the normaliza-tionformulaforthemthfeatureofthejthfeaturevectorisdefined by ˜v
j(
m)
=v
j(
m)
−v
¯(
m)
¯ s(
m)
, (14)where
v
¯(
m)
and s¯(
m)
denote the sample mean and the sample varianceof themthfeatures ofthe nfeaturevectors. Inthisway weobtainre-scaledfeatureswithzero-meanandunitstandard de-viation.Noweachfeaturecontributesequallytothecalculationof thedistancemetric.Thewaveletbasedtransformsareappliedusingfour decompo-sitionlevels(scales)fortheextractionofWeibull,GGDand Gaus-sian features fromthe subbands. Ifnot stated otherwise,all em-ployedwaveletandwaveletbasedapproachesareapplied toRGB
colorimagesandthefinal feature vector consistsofthe concate-nationof thefeatures ofthe three color channels.So the length ofafeaturevectorl(fv)resultingfromextractingGaussian,GGDor Weibullparameters fromthe subbands ofa waveletbased trans-formisgivenby
l
(
fv
)
=3∗2∗NrSB, (15)where3isthenumberofcolorchannels,2isthenumberof pa-rametersextractedbytheprobabilitydistributionsandNrSBisthe numberofsubbandsoftheusedwaveletbasedtransform.
Since weprimarily focuson Letsinthiswork,we additionally reimplemented 2 texture analysisapproaches based on curvelets (GomezandRomero,2011;Barbosaetal., 2009),2basedon con-tourlets(LongandYounan,2006;DongandMa,2013)and3based on shearlets (Schwartz et al., 2011; He et al., 2013; Dong et al., 2015),whichextractfeaturesthataredifferenttothethree previ-ouslydescribedstatisticalfeatures(Gaussiandistribution,GGDand Weibull distribution). These approaches were published in well knownjournalsorconferences.
3.8.1. RotationinvariantDCTusingthedominantorientation
Inthisapproach(GomezandRomero,2011),thesamefeatures areextractedasintheapproachextractingGGDfeaturesusingthe DCT(DCT-GGD).Alsothesamedistancemetricisused.Toachieve rotation invariance, the features of each scale level are circular shifted,usingthedominantorientationasreference.Thedominant orientation is defined asthe orientation whose associated direc-tional(secondlevel)subbandhasthehighestsumofabsolute val-uedcoefficients(the highestenergy).Contrary tothe original ap-proach,weapplythesameDCTdecompositionasfortheDCT-GGD approach.Thishasthe advantageofabetter comparabilitytothe
DCT-GGDapproach, which is basicallythe same approach asthe
consideredonebutwithoutcyclicshiftedfeaturestoachieve rota-tioninvariance.WefurtherdenotethisapproachasDCT-DO.
3.8.2. DCTcolorcovariancefeatures
This approach(Barbosaetal., 2009) firstlyextracts themeans andstandarddeviations(std)oftheDCTsubbands.Thenthecolor covarianceofthesefeaturescanbecalculatedasfollows:
CC
(
a,b,s,m)
= α(
Fm
(
a,s,α
)
−E{
Fm(
a,s,α
)
}
)
×
(
Fm(
b,s,α
)
−E{
Fm(
b,s,α
)
}
, (16) wherea andb representtwo differentcolorchannels,Fm the sta-tisticaltexturedescriptor(m= 1:mean,m= 2:std),α
isthe con-sideredangleoftheDCTsubband,stheconsideredDCTlevelandE{Fm(a, s,
α
)} the average of the statistical texturedescriptor Fm overthedifferentdirectionsinthecolorchannela.ItshouldbenotedthatinthisapproachtheHSVcolorspaceis usedinsteadof theRGBcolorspace likeforall other approaches
andthat we did not apply CLAHE as preprocessing step (CLAHE
cannot beapplied to all HSVcolorchannels). The DCT decompo-sitionresults ina lowpass subbandand two levels ofdirectional subbandswith8and16orientations(weonlyusethedirectional subbands)resultinginafeaturevectorofanimageoflength24(6 combinationsofcolorchannels× 2scale levels ×2 parameters). Wefurther denotethis approachas DCT colorcovariancefeature (DCT-CCF).
3.8.3. CTcoefficientsmodeledbyhistograms
Inthisapproach(Long andYounan,2006), theCTsubband
co-efficients are modeled using histograms with 10 bins. Distances
betweentwo feature vectorsaremeasured usingthe
χ
2 distance metric:χ
2(
x,y)
= i(
xi−yi)
2 xi+yi . (17)TheCTisapplied using3decompositionlevelswith8directional subbands per level resulting in 24 directional subbands and the low-passsubband.Thefinalfeaturevectorofanimagehaslength 750(3colorchannels×25subbands×10binsperhistogram).We furtherdenotethisapproachasCT-Histogram.
3.8.4. CTsubbandclustering
In thisapproach (Dong andMa, 2013) the k-meansclustering algorithmisusedtofind3clustercentersoftheCTsubband coef-ficients,whichareusedasfeaturesforfurtherclassification.First, the CTdecomposes an image into L = 4 levels with8 directional subbandsperlevelandthelow-passsubband.Withincreasing de-composition level i (from fine (i=1) to coarse (i=4)), the av-erageamplitude ofthe CTcoefficientsincreases almost exponen-tially.Thebyfarhighestcoefficientvaluesareinthelow-pass sub-band.Tobalancethedifferentrangesofcoefficientvaluesper de-compositionlevel,thelow-passsubbandcoefficientsaremultiplied by the factor of 1/4L and the detail subband coefficients of de-composition level i (i∈
{
1,2,...,L}
) are multiplied by the factor of 1/4i−1 (in the publication describing the approach (Dong and Ma,2013)theauthorswrote1/4i,butwethinkthisisatyposince thisfactorwouldnot considerthefarhighercoefficient valuesin thelow-passsubband). Additionally,thevariance andnorm-2 en-ergy of each subband is extracted, resulting ina feature vector’slength of990 (3 color levels × 33 subbands × 5 parameters (3
clusters,varianceandenergy)).Wefurtherdenotethisapproachas CT-Cluster.
3.8.5. EnergyoftheSTcoefficients
Inthisapproach(Schwartzetal.,2011),theenergyofthe sub-bandcoefficientsisusedasfeature:
E
(
s)
=|
s(
x)
|
, (18)wheresdenotesasubband.Theenergyfeatureiscomputedfrom thesubbandsofa4levelSTdecompositionwith8directional sub-bands per level. The resulting feature vectors are L2-normalized andhavelength81(3 colorchannels× 4levels× 8orientations perlevel×1parameter).Thisapproachwillbefurtherdenotedas theST-Energyapproach.
3.8.6. STcombinedwithaLBPbasedfeatureextraction
Inthisapproach (He etal., 2013), afeature basedonlocal bi-narypatterns(LBP)(Ojalaetal.,2002) isextractedfromthe sub-bandcoefficientsoftheSTdecomposition.First,twolocalfeatures arecomputedasfollows:
eli,,dj= 1 9 1 p=−1 1 q=−1
|
sli+,dp,j+q|
(19) gl,d i,j= −1 log(
9)
1 p=−1 1 q=−1|
sl,d i+p,j+q|
normli,,dj log|
sl,d i+p,j+q|
normli,,dj (20)wheresi,jistheshearletcoefficientat(i,j)inthed’th directional subbandwithinthel’thdecompositionleveland
norml,d i,j= 1 p=−1 1 q=−1
|
sl,d i+p,j+q|
. (21)Thenthesefeaturesarenormalizedandbymeansofthresholdstl n (n∈{0,1,2})withtl
1 <t2 l <t2 l,anintegervaluembetween0and 3isassignedtoeachlocalfeatureeil,,dj (gli,,djanalogouswithdifferent
thresholdvalues)ineachdecompositionlevell: mli,,dj==
⎧
⎪
⎪
⎪
⎨
⎪
⎪
⎪
⎩
0foreli,,dj <tl 0 1fortl 0<e l,d i,j <t1l 2fortl 1 <eli,,dj <t2 l 3foreli,,dj >tl 2 (22)Thelocalshearlet-basedenergypattern(LSEP)isdefinedas
LSEPl i,j D d=1 mli,,dj3d−1 . (23)
Toachieve orientationinvariancemli,,dj issortedbeforetheLSEP computation, sothat the valuesofagivenlevel landposition (i, j)areascendingintheorientationdimension(D = 4directionsare usedandsoe.g.ml
i,j=2,1,2,0becomesmli,j=0,1,2,2).
Thesupportsizeoftheshearletfiltersis16×16.Thefinalstep istobuild histogramsoftheLSEP’sandtoconcatenatethese his-togramsintoafeaturevector. Thefinalfeaturevectorofanimage consistsof270elements(3colorchannels×3scales×2local fea-tures ×15binsperhistogram).Distancesbetweenfeaturevectors aremeasuredusingthe
χ
2 distancemetric.Wefurtherdenotethis approachasST-LSEP.3.8.7. LinearregressionofSTsubbands
Inthisapproach(Dongetal.,2015),regressionisusedasatool to investigatethe dependencesbetweenshearletsubbands at dif-ferentscalelevels.
By applying the L= 3 level shearlet transform using shearlet
filters with support size 30 × 30, we obtain one low-pass
sub-band and D=10 directional subbands at each scale. From each
subbandthenorm-1(mean)andnorm-2energyiscomputed.Such
asubbandfeatureatscaleianddirectiondfroman imagen(n∈
{
1,...,N}
) ofclass c isfurtherdenoted asqic,,dn.Then the samples{
(
qic−,n1 ,d,qic,,dn)
}
Nn=1 (furtherdenotedas{
(
xn,yn)
}
Nn=1 )canbe seenas theNobservationsof(X,Y).Thefollowinglinearregressionmodels thedependencesbetweentheshearletsubbandfeatures at neigh-boringscalelevels:E
(
Y|
X=x)
=β
0 +β
1 x (24)Using the training images, the estimates
β
ˆ0 c,i,d andβ
ˆ1 c,i,d are computedforeachclassc,whereddenotesthedirectionandithe scalelevel.Givenatestimageandapairofextractedfeatures(qi−1 ,d,qi,d), theresidualdci,discomputedasfollows:
di,d c =
|
qi,d−qˆi,d|
(25) where ˆ qi,d=E(
Y|
X=qi−1 ,d)
=β
ˆc,i,d 0 +β
ˆ1 c,i,dqi−1 ,d (26) ThedistancefromthetestimageItothecthclassTcisdefined astheweightedsummationofresiduals(WSR):DWSR
(
I,Tc)
= D d=1 L i=1 2idi,d c,norm1 + D d=1 L i=1 2idi,d c,norm2 , (27) wheredc,norm1 (dc,norm2 )istheresidualusingnorm-1(norm-2) en-ergy assubband feature.Thetest image Iis assignedtotheclass correspondingtotheminimumof{
DWSR(
I,Tc)
}
Cc=1 .Socontrarytotheother methods,thereisnofeaturevectoras output of a image. The output ofan evaluationset image is the predictedclass. This approachwill be further denotedas the ST-Regapproach.
3.9.Othermethods
In thissections we will describe a variety of state of the art methods for colonic polyp classification which are not based on waveletsorLets.Bymeansofthesemethodsweare ableto com-paretheresultsofthewaveletbasedapproacheswiththeresults ofstate-of-the-artmethods.
3.9.1. Blob-adaptedlocalfractaldimension
Thisfeatureextractionmethod(Häfneretal.,2014c) isderived fromthelocalfractaldimension(LFD)(VarmaandGarg,2007;Xu etal.,2009).Foragivenpixellocationx=
(
x1 ,x2)
,thelocalfractal dimensionLFD(x)analyzesthechangesoftheintensitydistribution ofdifferentlysizedcircleshapedregions oftheimagecenteredat thepointx.Thisisusuallydone byfilteringtheimage Iwith cir-cleshapedbinaryfilterswithr=1,2,3,...,8andtheLFDis com-putedforeach pixellocation byestimatingtheslope ofthefilter responseswithincreasingradii.ContrarytotheoriginalLFDapproach,theconsideredapproach (Häfneretal.,2014c) enhancestheviewpointinvarianceusing el-liptic shaped binary andGaussian filters, whose shape, size and orientationisadaptedtothelocaltexturestructure.Thefinal fea-turevectorconsistsofthehistogramsoftheLFD’s.
3.9.2. Blobshapeandcontrastfeatures
Thisapproach(Häfneretal., 2014a) consistsof twosteps. The first step is a segmentation algorithm, that applies local region growingtothemaximaandminimaoftheimageinasimilarway asthewatershedsegmentation byimmersion(Roerdinkand Mei-jster,2000). Theresultingblobsrepresentthelocaltexture struc-turesofanimage.
Inthesecondstep,3shapefeaturesandacontrastfeatureare extractedfrom theblobs. The final feature vector consistsof the histogramsofthese4features.
3.9.3. DenseSIFTfeatures
Thisapproach(Tamakietal.,2013)combinesdenselycomputed SIFT features with the bag-of-visual-words (BoW) approach. The SIFT descriptors are sampled at points on a regular grid. From theseSIFT descriptors, cluster centers (visual words) are learned bymeansofk-meansclustering.Givenanimage,itscorresponding modelis generated by labeling its SIFT descriptors withthe tex-ton that lies closest to it. We use the same parameters that led tothebest resultsinTamakietal.(2013) (gridspacing= 5,SIFT
scale 5 and 7), but with a lower number of visual words (only
600 instead of up to over 10000 visual words in (Tamaki et al., 2013)).Inourexperiments,thelower numberofvisual wordsled to better results and less (but still huge) computational cost. In
Tamakiet al.(2013), thisapproach is used forthe colonic polyp classification inNBI endoscopy, however,there is no reasonwhy thisapproach shouldnotalsobe suitedforotherimaging modal-itieslike thei-Scantechnology orchromoendoscopy.The compu-tationoftheSIFTdescriptorsandthefollowingk-meansclustering
is done using the Matlabsoftware provided by the VLFeat open
sourcelibrary(VedaldiandFulkerson,2008).
3.9.4. Vascularizationfeatures
This approach (Gross et al., 2012) segments the blood vessel
structure on polyps by means of the phase symmetry (Kovesi,
1999).Vesselsegmentation startswiththephase symmetryfilter, whoseoutputrepresentsthevesselstructureofpolyps.By thresh-oldingtheoutput,abinaryimage isgenerated,andfromthis im-age8 features are computedthat representthe shape,size, con-trastandthe underlyingcolor oftheconnected components(the segmentedvessels).Thismethodisespeciallydesignedtoanalyze thevesselstructures ofpolyps inNBIimagesandis probablynot
Table1
Summaryandcharacterizationoftheusedfeatureextractionmethodsexceptfor theGaussian,GGDandWeibullfeatures.
Method Description
DCT-DO RotationinvariantversionofDCT-GGD
DCT-CCF Colorcovariancefeatureappliedonmeansandstd’sof thesubbands
CT-Histogram Histogramsarebuiltofsubbandcoefficients CTCluster Clustercentersofsubbandcoefficientsareusedas
features
ST-Energy Extractstheenergyofsubbands
ST-LSEP LBPbasedfeatureisextractedfromthesubbands ST-Reg Regressionisusedtoinvestigatedependenciesacross
differentsubbandlevels
BA-LFD Aviewpointinvariantfeatureanalyzingchangesinthe intensitydistribution
Blob-SC Shapeandcontrastdescriptionofsegmentedblobs SIFT TheBoWapproachisappliedtodenselycomputed
SIFTfeatures
Vasc.F. Bloodvesselstructureissegmentedanddescribed using8features
MB-LBP MultiscaleLBPvariant
suitedforimaging modalities that are not designedto highlight-ingthebloodvesselstructure.Hence, thismethodismost proba-blynotsuitedforanyotherimageprocessingtaskthanendoscopic polypclassificationusingNBI.
We use the implementation of the phase symmetry filter
(Kovesi,2000)forthevascularizationfeatureapproach.
3.9.5. MB-LBP
Based on a grayscale image, the LBP operator generates a bi-narysequenceforeachpixelbythresholdingtheneighborsofthe pixel by the center pixel value. The binary sequences are then treatedasnumbers(i.e. theLBPnumbers). OnceallLBPnumbers
foran image arecomputed, ahistogrambasedon thesenumbers
isgenerated and used as feature vector. There are several varia-tionsoftheLBPoperatorandtheyareusedforavarietyofimage processingtasksincluding endoscopicpolypdetection and classi-fication(e.g.Häfneretal.(2012b)).Becauseofitssuperior results compared to the standard LBP operator LBP(8, 1) (with block size = 3), we use amultiscale block binarypatterns (MB-LBP) opera-tor(Liaoetal.,2007)withthreedifferentblock sizes(3,9,15).The uniformLBPhistogramsofthe 3scales (blocksizes) are concate-natedresultingina featurevector with3×59= 177 featuresper image.
3.10.Summaryoftheemployedmethods
For each type of the employed wavelet-based transforms we
employthreeapproachesextractingthreedifferenttypesof statis-ticalfeatures(GaussianGGDandWeibullfeatures),whichdescribe thesubband coefficient distributions.The remaining methods are listedandcharacterizedinTable1.
4. Experimentalresults
Inthispaperweuseatotalof11differentendoscopicdatabases toclassifycolonicpolyps.
Forabetter comparability oftheresultsandtoput more em-phasis to the feature extraction,all methods are evaluated using a k-NN classifier. To balance the problem of varying results de-pendingonk,weaveragethe10resultsofthek-NNclassifierwith
k=1,...,10.
Since we employ a high number of feature extraction
ap-proaches onmanydifferentdatabases, wedecided to usethe ac-curacyastheonlyperformancemeasureandresignedtouseother classificationmeasureslikee.g.sensitivityandspecificityor preci-sionandrecall.Theadvantagesoftheaccuracyistheeasy compa-rabilityoftheresults(theaccuracyisonlyoneperformance
mea-sure compared to the two performance measures for sensitivity
andspecificityorprecisionandrecall).
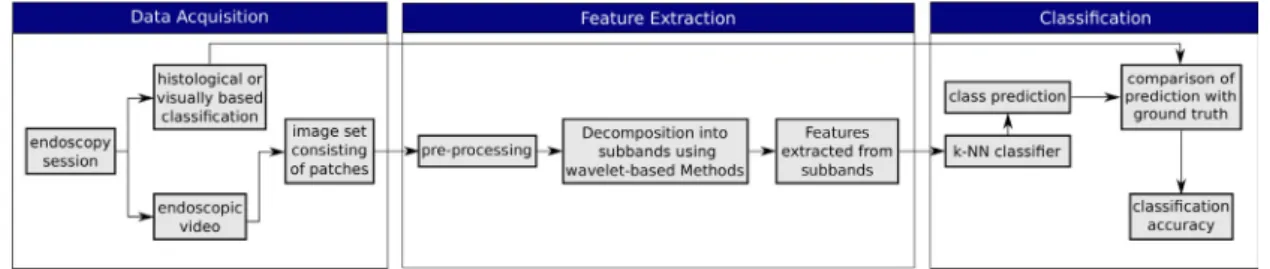
InFig.16we show aflowchart summarizingour experimental
setup.
4.1. TheCC-i-Scandatabase
The CC-i-Scan databaseis an endoscopic image database con-sistingof8sub-databaseswith8differentimagingmodalities.The 8image sub-databasesare acquired byextracting patchesof size 256 ×256fromframesofHD-endoscopic(PentaxHiLINEHD+90i Colonoscope) videos either using the i-Scan technology or with-out any computed virtual chromoendoscopy (¬CVC in Table 2). The mucosa iseither stained ornot stained. The patches are ex-tracted only from regions having histological findings. The CC-i-Scan databaseisprovided by theSt. Elisabeth HospitalinVienna andwasalreadyusedforcolonicpolypclassificatione.g.inHäfner etal.(2014b);2014c).
Table2 liststhe numberofimagesandpatientsper classand database.
ClassificationaccuracyiscomputedusingLeave-one-patient-out (LOPO)crossvalidation.TheadvantageofLOPOcomparedto leave-one-outcrossvalidationistheimpossibilitythatthenearest neigh-borofanimageandtheimageitselfcomefromthesamepatient. Inthiswayweavoidover-fitting.
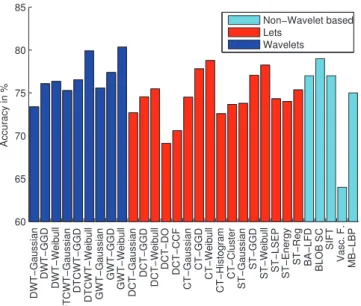
InTable3 wesee theoverallclassification rates(OCR)forour experimentusingtheCC-i-Scandatabase.Thecolumn ∅ showsfor
each method the averaged accuracies across all image
enhance-mentmodalities.Therow∅showstheaveragedaccuraciesacross allwavelet-basedmethods.Thehighestresultsforeachimage
en-hancement modality across all methods are given in bold face
numbers. InFig. 17we once againshow theaveraged accuracies acrossallimageenhancementmodalities(column∅)foraneasier comparisonofthemethodsresults.
As we can see in Table 3 andFig. 17, extracting the Weibull parameters asfeatures leadstothebest resultsforeach
wavelet-based method. The two directional wavelet transforms DT-CWT
and GWT extracting Weibull features are the best performing
Table2
Numberofimagesand patientsperclassofthe CC-i-ScandatabasesgatheredwithandwithoutCC(staining)and computedvirtualchromoendoscopy(CVC).
Nostaining Staining
i-Scanmode ¬CVC i-Scan1 i-Scan2 i-Scan3 ¬CVC i-Scan1 i-Scan2 i-Scan3
Non−neoplastic Numberofimages 39 25 20 31 42 53 32 31 Numberofpatients 21 18 15 15 26 31 23 19 Neoplastic Numberofimages 73 75 69 71 68 73 62 54 Numberofpatients 55 56 55 55 52 55 52 47 Totalnr.ofimages 112 100 89 102 110 126 94 85 Table3
AccuraciesofthemethodsfortheCC-i-Scandatabasesin%.Thehighestresultsforeachimageenhancementmodality aregiveninboldfacenumbers.
Methods Nostaining Staining ∅
¬CVC i-Scan1 i-Scan2 i-Scan3 ¬CVC i-Scan1 i-Scan2 i-Scan3
DWT-Gaussian 74.0 82.4 84.2 81.2 63.2 65.7 69.3 67.2 73.4 DWT-GGD 75.0 82.8 84.0 81.3 67.2 70.0 80.1 68.1 76.1 DWT-Weibull 74.2 80.0 81.1 86.5 68.4 73.3 82.6 64.6 76.3 DTCWT-Gaussian 73.2 83.5 85.4 82.8 66.4 69.5 72.7 68.7 75.3 DTCWT-GGD 75.0 86.0 85.6 83.7 74.2 67.6 68.6 71.5 76.5 DTCWT-Weibull 79.6 86.4 84.8 89.5 72.3 77.0 82.6 67.1 79.9 GWT-Gaussian 75.8 82.1 85.4 80.6 67.5 73.2 74.2 66.0 75.6 GWT-GGD 79.3 82.9 83.4 82.2 75.0 69.5 74.4 72.5 77.4 GWT-Weibull 83.5 88.0 85.1 85.2 71.3 78.8 82.8 68.0 80.3 DCT-Gaussian 75.6 79.3 82.7 76.5 63.5 67.8 70.4 65.8 72.7 DCT-GGD 77.8 82.1 81.6 77.7 69.6 69.4 69.6 68.7 74.5 DCT-Weibull 80.0 80.2 82.6 81.6 65.1 71.2 77.1 66.0 75.5 DCT-DO 67.3 76.0 78.9 73.3 66.9 60.6 66.8 63.2 69.1 DCT-CCF 74.8 71.8 77.9 70.0 64.5 65.7 74.7 65.5 70.6 CT-Gaussian 73.8 81.9 83.7 81.1 68.6 68.5 70.4 68.0 74.5 CT-GGD 77.6 85.1 85.8 82.9 74.1 72.0 75.3 69.7 77.8 CT-Weibull 79.8 83.3 87.2 86.0 71.5 71.0 81.7 69.9 78.8 CT-Histogram 68.0 78.4 82.1 78.2 62.8 68.3 75.5 67.2 72.6 CT-Cluster 75.6 80.1 84.3 79.9 70.4 66.0 67.9 65.2 73.7 ST-Gaussian 72.8 83.2 82.6 80.1 63.1 69.7 72.5 66.4 73.8 ST-GGD 75.8 85.6 84.6 82.8 70.8 72.9 75.5 68.6 77.1 ST-Weibull 7.59 85.7 86.9 83.8 69.2 73.3 79.7 68.0 78.2 ST-Energy 72.4 82.4 83.6 79.8 63.5 70.3 72.8 67.3 74.0 ST-LSEP 71.6 77.7 84.2 77.8 65.4 69.4 81.8 66.8 74.3 ST-Reg 76.6 79.0 83.2 84.3 63.6 73.8 67.0 75.3 75.4 ∅ 75.5 81.8 83.6 81.1 67.9 70.2 74.6 67.8 75.3 BA-LFD 74.4 86.7 80.9 79.0 70.6 76.1 84.6 63.5 77.0 BlobSC 78.6 84.7 87.4 86.6 66.3 77.0 79.5 70.8 78.9 SIFT 75.4 86.9 84.0 78.8 70.5 79.4 77.0 65.3 77.2 Vasc.F. 63.7 72.6 76.0 72.5 58.2 48.5 62.9 59.5 64.2 MB-LBP 70.5 82.9 79.6 76.4 65.7 74.3 73.3 73.3 74.5
methods.Theirresultsareevenhigherthanthoseofthe
state-of-the-art approaches. Also ST and CT combined withWeibull
fea-tures are among thebest performing approaches.Only the Blob-SCapproachachievessimilarlyhighresultsasthe4wavelet-based
transforms combined withWeibull features. DWT andDCT
com-binedwithWeibullfeaturesonlyachieveaverageresults.
The results ofthe wavelet-basedmethods extracting Gaussian parameters asfeatures are quite similar to each other and
aver-agecompared tothe resultsofother methods.The GGD
parame-ters provideconstantly higher resultsthan the Gaussian parame-tersandconstantlylowerresultsthantheWeibullparameters.
As already mentioned before,DCT-GGD and DCT-DOare
basi-cally thesame approaches withthe exception that DCT-DO aims
toachieverotationinvariancebycyclicshiftingfeatures.Whenwe compare their resultswe see that thecyclic shiftingprocess dis-tinctlydecreasestheresults.
Likeexpected,theVascularFeaturesarenotsuitedforthe clas-sification ofpolyps forthisdatabase. Especiallytheresultsofthe
subdatabases with stained mucosa are particularly bad because
the pits of the mucosal structure, which are filled with dye, are wronglyrecognizedasvessels.
When we compare the results of the wavelet-basedmethods
across the different imaging modalities (see row ∅ in Table 3), itbecomesclear thatstaining themucosa leadsto a degradation oftheresultswhereas thei-Scanmodesimprovethe results.The sameappliestothestate-of-the-artmethods.
BymeansoftheMcNemartest(McNemar,1947),weassessthe statisticalsignificance of our results.With the McNemar test we analyzeiftheimagesfromadatabaseareclassifieddifferentlyby thevarious wavelet-basedmethods, orif mostofthe imagesare classifiedidenticalbythevariouswavelet-basedmethods(whereat we only differentiate between classifying an image ascorrect or incorrect). The McNemar test tests ifthe classification results of twomethodsaresignificantlydifferentforagivenlevelof signifi-cance(
α
)by buildingteststatistics fromincorrectlyclassified im-ages.Thetestiscarriedoutonthei-Scan2databasewithout stain-ing using significance levelα
=0.05. We chose this subdatabaseFig.17. Averagedaccuraciesacrossallimageenhancementmodalitiesofthe CC-i-Scandatabase.
Fig.18. ResultoftheMcNemartestforthei-Scan2databasewithoutstaining.A blacksquareintheplotmeansthatthetwoconsideredwavelet-basedmethodare significantlydifferentwithsignificancelevelα=0.05.Awhitesquaremeansthat thereisnosignificantdifferencebetweenthemethods.
with different imaging modalities. Results are displayed in
Fig.18.
AswecanseeinFig.18,theDCT-CCF,theDCT-DOandthe CT-GGDapproachareclassifyingimagessignificantlydifferenttosome otherapproaches.For
α
=0.01 thereremains onlyonesignificantdifference betweenthe DCT-DOandthe CT-GGD approach.
How-ever, the outcomes of the McNemar test (and any other
signifi-cance test)are highly dependent on the samplesize (the higher thesamplesize,the morelikely significant differenceswilloccur usingtheMcNemartest).Sothelownumberofsignificant differ-encesisprobablymainly causedbythelow numberofimagesof thei-Scan 2database (89), since thereare distinct differences in theresultsinTable3.
Table4
Groundtruthinformationbasedonhistologyforthe CC-high-magnificationimagedatabase.
Non-neoplastic Neoplastic Total
Images 198 518 716
Patients 14 32 40
Fig.19. Accuraciesand thestandarddeviationsofthemethodsforthe CC-high-magnificationdatabase.
4.2. TheCC-high-magnificationdatabase
The high-magnification images are acquired at the
Depart-ment ofGastroenterology andHepatology ofthe Medical Univer-sityofViennausinga zoom-colonoscope(OlympusEvisExera
CF-Q160ZI/L) with a magnification factor of 150 and indigocarmine
dye-spraying. The database is acquired by extracting patches of size 256× 256from327 endoscopiccolor images(either ofsize 624×533pixelsor586×502pixels)of40patients.Table4lists thenumberofimagesandpatientsperclass.
Classification accuracy is computed using LOPO cross valida-tion. In Fig. 19 we see the averaged accuracies (for k=1,...,N)
ofour employed methodsusing theCC-high-magnificationimage
database.
The error bars in the figure indicate the standard deviations
across the 10 k-values of the kNN-classifier. As we can see in
Fig.19,thewavelet-basedmethodsextractingWeibull parameters asfeatures achievethe bestresults.EspeciallyDT-CWT,GWTand STcombinedwithWeibullfeaturesoutperformtheothermethods, butalsoDCTcombinedwithWeibullfeaturesperformsvery well. The state-of-the-art-approachesprovide poorresultscompared to thewavelet-basedmethods.
Comparing the results using Gaussian, GGD and Weibull
fea-turesacross thedifferentwavelet-basedapproaches, the DT-CWT, GWTandSTprovidethe bestresults.The resultsofthe DCTand CT are already distinctly lower and the DWTprovides the worst results.
Like in the previous database, extracting GGD features pro-vides constantly better results than extracting Gaussian features andmostlyworseresultsthanextractingWeibullfeatures.Similar totheprevious database, thecyclicshifting ofthe featuresofthe
DCT-DOapproachdecreasestheresultscomparedtotheDCT-GGD