PReFacTO: Preference Relations Based
Factor Model with Topic Awareness and
Offset
Priyanka Choudhary
A Thesis Submitted to
Indian Institute of Technology Hyderabad In Partial Fulfillment of the Requirements for
The Degree of Master of Technology
Department of Computer Science Engineering
Acknowledgements
My sincere thanks to my guide Dr. Maunendra S. Desarkar, Assistant Professor, Department of Computer Science and Engineering, Indian Institute of Technology Hyderabad, for his uncompromised support and guidance throughout my thesis work. He has been providing me invaluable help to develop insight for various practical aspects of the study.
I would like to express my profound gratitude towards the Indian Institute of Technology(IITH) and in particular the Computer Science Department, HoD of the department Dr. M. V. Panduranga Rao and the Faculty Advisor Dr. Vineeth N Balasubramanian for providing all the support, cooperation and resources to carry out my thesis work. I would like to thank my seniors, colleagues and friends for their inspiring words and motivation that helped me throughout my research work. Lastly, I sincerely thanks my parents for having faith in me.
Dedication
I would like to dedicate my thesis work to my teachers, faculty advisor, superivor, friends and my parents. Also, giving back to the whole community of researchers who may find my work interesting and work upon to further improvise in this area.
Abstract
Recommendation systems create personalized list of items that might interest the user by analyzing the user’s history of past purchases and/or consumption. Generally only a small subset of the items are assessed by each user, and from the large subset of unseen items, the systems need to produce an accurate list of recommendations.
For rating based systems, most of the traditional methods for recommendation focus on the absolute ratings provided by the users to the items. In this work, we extend the traditional Matrix Factorization approach for recommendation and propose pairwise relation based factor modeling. We propose the method based on the pairwise preferences between the items to capture the relative tendency of user selecting one item over the other.
While modeling the items in the system, the use of pairwise preferences allow information flow between the items through the preference relations as an additional information. Item feedbacks are available in the form of reviews apart from the rating information. The reviews have textual information that can be really helpful to represent the item’s latent feature vector appropriately. We perform topic modeling of the item reviews and use the topic vectors to guide the joint factor modeling of the users and items and learn their final representations. The proposed methods shows promising results in comparison to the state-of-the-art methods in our experiments.
Contents
Declaration . . . ii
Approval Sheet . . . iii
Acknowledgements . . . iv Abstract . . . vi Nomenclature viii 1 Introduction 1 1.1 Background . . . 2 1.1.1 Collaborative Filtering . . . 2 1.1.2 Topic Modeling . . . 4 1.2 Contributions . . . 5 2 Related Work 7 3 Methodology 9 3.1 Basic concepts . . . 9 3.2 Proposed Methods . . . 11
3.2.1 Preference Relation based Factor modeling (Pairwise) . . . . 11
3.2.2 Preference Relation based Factor modeling with Topics (Pairwise+Topic) . . . 14
3.2.3 Pairwise Relation based Factor modeling with Topics and Offset (PReFacTO) . . . 15
3.3 Baseline Methods . . . 16
3.3.1 Absolute Rating based Factor modeling (Pointwise) . . . 16
3.3.2 Absolute Rating based Factor modeling with Topics (Pointwise+Topics) . . . 17
3.3.3 Absolute Rating based Factor modeling with Topics and Offset (Pointwise+Topics+Offset) . . . 18
4 Performance Evaluation 20
4.1 Dataset . . . 20
4.2 Baselines . . . 21
4.3 Evaluation . . . 21
4.4 Experiment Results . . . 24
4.5 Experimental Analysis and Discussion . . . 26
5 Conclusions 30
6 Future Work 31
Chapter 1
Introduction
Users have access to large variety of items available online for purchase, subscription, consumption etc. Such a huge list of options often result in choice overload, where it becomes difficult to browse through and/or select the items of interest. Recommen-dation Systems (RS) make this task of selecting appropriate items easier by finding and suggesting subset of the items that might be of interest to the user. Many tra-ditional recommendation techniques use only ratings to assess the users’ taste and behavior. Given a small subset of rating data containing ratings given to the items by the users, RS try to predict the ratings of the items that are not yet rated/viewed by the user. Based on these predicted rating values, ranked list of the items that can be of user’s interest are recommended to the users. Latent factor models [1, 2, 3] have been extensively used in the past for this purpose.
There are lot of recommendation systems where the user feedback comes in the form of ratings. Majority of such recommendation systems use these absolute ratings entered by the users for modeling the users and items according to latent factor modeling, and use those models for recommendation. Latent factor models like Matrix Factorization [1] are commonly used to transform or represent the users and the items to latent feature spaces. These representations are helpful for explaining the observed ratings and predicting the unknown ratings. These latent factors, e.g. in case of movie recommendations, can be genres, actors or directors or something un-interpretable. These factors try to explain the aspects behind the liking of the items by a particular user. The items are modeled in a similar fashion by representation of the hidden factors possessed by them. This representation predicts the rating by possession of these factors in an item and affinity of users towards these hidden factors.
User feedback in the form of reviews along with the ratings is also available for many online systems like Amazon, IMDb, TripAdvisor etc. The review information
can be really useful as it contains the users’ perception about the items. There can be systems where the item description is also available. There are algorithms [4] which consider the item description as additional input for latent factor modeling. However, the descriptions are often entered by the item producers or sellers. On the other hand, the feedback in the form of reviews given by the user generally conveys these factors that are being liked or disliked in an item. An attempt to include these textual information can be helpful for better modeling, interpretation and visualization of hidden dimensions [5].
An alternate form of recommendation system can be based on pairwise prefer-ences of the user among the items [6, 7, 8]. Given a pair of items (i, j), user u may give feedback regarding which of the items he prefers over the other. Such type of feedback is referred to aspairwise preference orpairwise preference based feedback. A survey in [9] shows that users do prefer comparisons through pairwise scores rather than providing absolute ratings. Although there is no available dataset where the pairwise preferences were directly captured, many approaches in literature have in-duced pairwise preferences from absolute ratings [6, 8, 10] and used those relations for developing algorithms for recommendation.
The merits of the pairwise relation based latent factor modeling can be combined with the probabilistic modeling to provide more accurate ranking of the items. Thus, the list of recommendation is expected to be more endearing for the user and user satisfiability will increase. This will also help in huge profit for the service providers in the e-commerce business.
1.1
Background
Recommendation systems have become tools of service to present relevant items to the user online amongst the millions of products/items.
1.1.1
Collaborative Filtering
Collaborative filtering is the most widely used approach to build recommendation system. This technique relies on other users having similar taste. Based on the simi-larity of the users or items, relationships between the users and items are established. The ratings for the unknown user-item pair are predicted and recommendations are made. The assumption behind this concept lies on the fact that if users A and B have liked product i, then the chances of liking product j (likeable by the user B)
is highly probable then based on liking of a randomly chosen user. Given a partial list of users’ taste, collaborative filtering can identify the products which the user might like. It takes information from other users based on the items rated and cal-culate similarity of the users. This similarity can be computed using various ways such as Pearson Correlation, Cosine Similarity or Jaccard Similarity. This technique is extensively used in Data Mining and Information Retrieval. Most commonly used forms of collaborative filtering are user-based collaborative filtering and item-based collaborative filtering.
User-based Collaborative Filtering : Identify the users that share same rating pattern and suggest the items the other users have liked but not yet rated/seen by the current user. Nearest-neighbor algorithm is an application of user-based collaborative filtering.
Item-based Collaborative Filtering : Calculate the similarity between the
items and recommend to the user, similar items, that have been liked by the user before. This similarity is computed using user’s ratings of those items.
There are many challenges associated with the collaborative filtering. Sparsity, scalability and cold-start are the major concerns. As the number of users and items grow, the complexity of the algorithm increases and it becomes quite difficult to react immediately when real-time recommendations need to be made online. One way to handle the scalability and the sparsity is to leverage a latent factor model and turn recommendation problem into an optimization problem. In this thesis, we discuss latent factor models that will act as base for our proposed methods.
Latent Factor Modeling : Latent factor models, such as Matrix Factorization,
have gained popularity in recent years due to their effectiveness, scalability and pre-diction accuracy. The method transforms the users and items into same latent factor space and tries to explain the ratings given by the user to the items. Each user u can be represented as a latent vector pu of dimension K. Likewise, each item i is represented as latent vectorqi of same dimension K. The inner dot product of these two vectors gives the user-item interaction or ratingrui. This rating reflects the per-ceived quality of the item. In real-life scenarios only few user-item interactions are available. In order to recommend items to the user, we need to make predictions ˆrui for the other items that have not been rated yet by the user. These predictions can be made using the following equation:
ˆ
rui =qiTpu (1.1)
extend to which the user will be interested in the items that are high on the cor-responding factors. Much of the variations in the ratings involve factors, termed as bias, that are independent of the user-item interactions such as popular items have tendency to get higher ratings. The system tries to identify these bias factors of the items and models the true user-item interaction.
ˆ
rui =qiTpu +bi (1.2) The major task is to compute the latent factors of the items and the users based on which predictions are made. The latent factors can be computed using theStochastic
Gradient Descent where we generalize the given ratings and predict the unknown
ratings. min Θ X (u,i)∈T rui−(qTi pu+bi)2+λ||pu||2+ λ 2||qi|| 2 +λ 2||bi|| 2 (1.3)
1.1.2
Topic Modeling
Topic Modeling is a text-mining tool useful for discovering hidden topics in a collection of documents. It is a probabilistic model that determines the probability distribution of multiple topics present in the document.
Latent Dirichlet allocation (LDA) : LDA is widely used topic modeling
tech-nique that determines the topic distribution in the corpus. Each topic distribution is associated with set of words that defines the topic. LDA is a generative model which works as follows: Given a document collection D with N documents and let K denotes the number of topics.
• Process each document and assign each word of the document to the one of the K topics.
• For each wordw in document d:
– compute proportion of words in documentdassigned to topictk i.ep(tk|d).
– compute proportion of assignment of word w to topic tk over all the doc-uments Di.e p(w|tk).
• Reassign word w to new topic t´k where t´k is chosen with probability p( ´tk|d)∗ p(w|t´k). This gives the probability that the word w is generated by topic t´k. The iterative process gives stable assignments of the words to the topics and the assignments of topics to the documents.
1.2
Contributions
The existing methods from literature that are based on pairwise preferences do not consider the item content information in the modeling process. In this work, we pro-pose approaches that combine the pairwise feedback with the additional review data available. We propose an algorithm to use Latent Factor modeling using the pairwise preferences to discover the latent dimensions, map users and items to joint latent fea-ture vector space and produce recommendations for the end user. The latent feafea-ture vector space for the items are derived through topic modeling. In this approach, we construct a proxy document for each item by considering the reviews that it has got. If available, the descriptions of the items also can be used to populate this document. We performed probabilistic topic modeling on these documents representing items using Latent Dirichlet Allocation (LDA). These topics are then used to guide the factorization process for learning the latent representations of the users. We propose two different approaches for this purpose. One in which the LDA topic vectors for the items are directly used as the latent representations of the items, and another where these LDA representations are used to initialize the item vectors in the factorization process. For the second approach, the item-latent offset is introduced alongside the LDA representations. The offset is learned through the factorization process and tries to capture the deviations from the LDA representations of the items. We call our approach as Preference Relations Based Factor Model with Topic Awareness and Offset or PReFacTO in short. Experimental evaluation and analysis performed on a benchmark dataset helps to understand the strengths of the pairwise methods and their ability to generate efficient recommendations. We summarize the contribution of our work below:
• We use relative preferences over item pairs in a factor modeling framework for modeling users and items. The models are then used for generating recommen-dations.
• We incorporate item reviews in the factorization process.
• Detailed experimental evaluation is performed on a benchmark dataset. Analy-sis of the results are performed to understand the advantages and shortcomings of the methods.
The rest of the thesis work is organized as follows. After discussing the related work, we present the proposed methods in Chapter 3.2. We briefly talk about pairwise preferences and handling textual reviews and then provide detailed description about
the methods being proposed in this thesis work. In Chapter 4, we define the four evaluation matrices used to measure the performance of the proposed methods with the baseline followed by the discussion and analysis of the results obtained. We conclude the thesis in Chapter 5 and briefly talk about the future work in Chapter 6.
Chapter 2
Related Work
Traditional recommendation systems have extensively used latent factor based mod-eling techniques. Many researches have been done that employ the use of Matrix Fac-torization(MF) [1, 11] techniques for the prediction unknown rating values of items not seen by the user and providing recommendations by selecting top-N items. This basic MF model corresponds to the pointwise method used in this thesis. It acts as a baseline model to compare the proposed methods presented in this thesis work. The works of [5, 4, 12] have included the content based modeling to interpret the textual labels for the rating dimensions. This justifies the reasons how the user assess the products. Similar kind of work has been done in [13]. It tries to improve the rating predictions and provide feature discovery. Different users give different weights to these features. For e.g., a user who loves horror movies and hates romantic genre will have high weightage to "Annabelle" movie than the "The Notebook" in contrary to a romantic movie lover. This weightage will affect the overall scores and explain the rating difference.
Recently researchers have shown keen interest in pairwise preferences based rec-ommendation techniques. The authors of [8] have proposed the collaborative filtering methods i.e matrix factorization and nearest neighbour approaches for pairwise pref-erence scores. They have shown that these prefpref-erence relation based methods gives better prediction accuracy. In this thesis, we further extend this work for Matrix Fac-torization Technique by incorporating the information-rich reviews. In [14] suitable graphical interface has been provided to the user to mark his choices over the pair of items. Lenient users always end up giving high ratings to the items while strict users prefer giving less ratings. These ratings are absolute in nature, usually falling into the range 1-5 or 1-10. For such lenient users, if a new item comes up which is more likeable than the previous ones, the scale of the rating doesn’t allow them to rate
the item higher. In [8] the pairwise preferences are induced from the available rating values of the items. Both implicit [15] and explicit feedback can be modelled using the pairwise preferences based latent factor models. In [6], the users motivate the use of preference relations or relative feedback for recommendation systems. Pairwise preferences have been used in [6, 7, 10, 8] in matrix factorization and nearest neighbor of latent factor modeling settings to generate recommendations. However, in none of these works, the user reviews are taken into account.
Chapter 3
Methodology
3.1
Basic concepts
In this section, we present our proposed recommendation methods that work with pairwise preference information from the user. Apart from the pairwise feedback, we also consider the reviews that are provided by the users for different items. The methods represent each user and item in a shared latent feature space, through factor modeling approach. Before discussing our proposed methods in detail, we briefly describe the concepts of pairwise preferences and also about the way in which we handle the textual reviews available for the items.
Pairwise Preferences: The ratings in recommendation systems are generally
absolute in nature, often in the range of 1-5 or 1-10. However, users have different behavior while rating the items. The same rating value entered by two different users might be due to two different satisfaction levels. Moreover, the absolute rating entered by a user to an item may change over time, if the same user is asked to rate the same item again. Motivated by observations like this, pairwise preferences are introduced in modeling users and items in recommendation systems [6]. Pairwise relations based approaches try to capture the relative preference between the items. Such feedback, if directly obtained, removes the user bias that may correspond to the leniency or strictness of the users while assigning the absolute ratings.
Although pairwise preference relations can address some of the problems with absolute ratings mentioned above, there is no dataset (publicly available) with directly obtained pairwise preferences. In absence of such data, we consider in our work, datasets with absolute ratings as user feedback, and induce relative ratings from those absolute ratings. We then consider those relative pairwise preferences as input to the proposed methods.
Handling Textual Reviews - Topic modeling: If the item descriptions are available, then the system can identify more about the attributes or aspects that the items possess. This information can be useful in making the recommendations. In fact, content-based recommendation algorithms try to exploit these item attributes for generating the recommendations.
Several systems allow the users to enter reviews for the items. Item reviews are very useful in making view/purchase decisions as they often contain reasons or explanations regarding why the item was liked or disliked by the user who wrote the review. The reviews often describe some additional details about the items, for example the aspects that they possess. An example review for a product from Amazon is given below.
It seems like just about everybody has made a Christmas Carol movie. This one is the best by far! It seems more realistic than all the others and the time period seems to be perfect. The acting is also far better than any of the others I’ve seen; my opinion.
We hypothesize that even if item descriptions are not available, then also, the reviews reveal a great deal of information about the different attributes (specified or latent) that might be contained in the items1. These attributes can then be useful in modeling the items, and can further aid in generating efficient recommendations.
Based on this assumption, we use the reviews given by the users to different items as an additional source of information for learning the item representations. We use Latent Dirichlet Allocation (LDA) topic modeling technique to learn the topic representation of the items. LDA is an unsupervised method, which, given a document collection, identifies a fixed-number (say K, input to the algorithm) of latent topics present in the collection. Each document can then be represented as aK-dimensional vector in that topic space. LDA works on documents, so we need to represent each item as a document. For that purpose, we combine all the reviews assigned to an item to create a proxy document for that item. If dui represents a review given by a user u for an item i, then we denote the proxy document (di) for the item i as the concatenation of all the reviews given by the set of users U for i. Then, we can have a document collection dcorresponding to the set of items I asd=∪i(di)where i= 1,· · · ,|I|.
1The dataset used in our experiments did not have the item descriptions, but contained the
Table 3.1: Notations
U Set of users
I Set of items
N Number of users
M Number of items
rui Rating given by user ufor item i
ruij Pairwise score given by user u for item pair(i, j) R User-Item rating matrix of dimension (N x M) pu User latent space of dimension N x K
qi User latent space of dimension M x K
K Number of topics/Hidden dimensions of user-item interaction
µ Global offset term
bi Bias parameter of item i λ Regularization parameter
α Learning rate
latent item-vector offset
The notations that are used throughout this thesis have been defined in Table 3.1.
3.2
Proposed Methods
3.2.1
Preference Relation based Factor modeling (
Pairwise
)
Between the pair of items (i, j), users can express their relative preference if such a provision exists. This would allow the user to indicate, for the item pair, which item he prefers more. The user can also indicate if he favors both the items equally.This pairwise preference can be captured through an interface where users mark their preferences over a small subset of data. However, as mentioned earlier, we are not aware of the existence of any such system that allows the users to enter the pairwise preferences directly. In absence of that, if the rating data is available, pairwise preferences can be obtained as: ruij = rui− ruj. Here, rui indicates the
absolute rating given by user u to item i. If the sign of ruij is positive, we may
consider that i is preferred over j by the user u. If the sign is negative we may consider that j is preferred over i. If the value of ruij is zero, then it indicates that
both the items are equally preferable to u. Similar kind of approach was adopted in [7] for inducing pairwise preferences from absolute ratings.
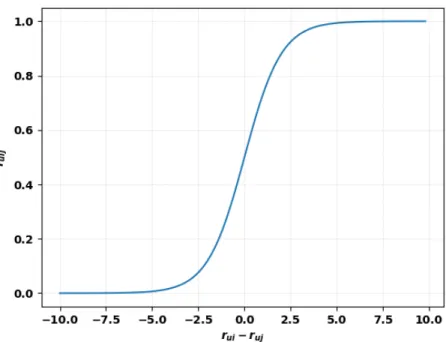
Figure 3.1: Graph showing pairwise relation between the items as a function of sig-moid.
We take a different approach for converting the absolute rating to relative pref-erences. If the ratings given by user u to the two items i and j are rui and ruj respectively, then we define the (actual or ground truth) preference strength for the triplet (u, i, j) as ruij = exp (rui) exp (rui) + exp (ruj) = 1 1 + exp (−(rui−ruj)) (3.1)
The value ofruij thus obtained can capture the strength of the preference relation as well. If the difference betweenrui andruj becomes larger, then the strength of this relation becomes stronger as shown in Figure 3.1.
We model the prediction of the unobserved ruij’s as:
ˆ ruij = exp (pu(qi−qj) + (bi−bj)) 1 + exp (pu(qi−qj) + (bi−bj)) = 1 1 + exp (−(pu(qi−qj) + (bi−bj)))) (3.2)
where the rating matrix R consisting of user-item interaction gives access to the values ofrui, indicating the rating given to itemiby useru. The quantitybirepresents the bias for the item. The method models each user u by a vector pu. This vector space measures user’s interest in the particular item based on affinity of user towards these factors. Similarly, each item i is represented by a feature vectorqi. This latent factor representation defines the degree to which these factors are possessed by the item.
Given the training set, the mean-squared error (MSE) function on the training data (with suitable regularization) is used as the objective function. The optimization is generally performed using Stochastic Gradient Descent (SGD) and the algorithm outputs optimized values of the rating parametersΘ ={B, P, Q}where B represents the bias values (bi) for all the items i∈I, P represents the user latent feature vector (pu) for all the users u ∈ U and Q represents the item latent feature vector (qi) for all the items i∈I. The objective function is defined as :
min Θ X (u,i,j)∈T ruij− sij 1 +sij 2 +λ||pu||2 + λ 2||qi|| 2 + λ 2||qj|| 2 + λ 2||bi|| 2 + λ 2||bj|| 2 (3.3) where sij = exp (pu(qi−qj) + (bi−bj))
T represents the training set and λ is the regularization parameter. The update rules for the optimizing the above objective function are given below:
Update rules : pu ←pu+α 2euijsij(qi−qj) (1 +sij)2 −2λpu (3.4) qi ←qi+α 2euijsijpu (1 +sij)2 −λqi (3.5) qj ←qj−α 2euijsijpu (1 +sij)2 +λqj (3.6) bi ←bi+α 2euijsij (1 +sij)2 −λbi (3.7)
bj ←bj −α 2euijsij (1 +sij)2 +λbj (3.8) where euij =ruij−
sij
(1+sij) and α is the learning rate.
After obtaining the model parameters through stochastic gradient descent, we can predict the personalized utility of the item i for the user u as:
ρui=bi+puqi (3.9) The top-N items according to this predicted personalized utility are recommended to the user.
3.2.2
Preference Relation based Factor modeling with Topics
(
Pairwise+Topic
)
As motivated in the previous section, the review comments about items can be useful in identifying the aspects that the items possess. Moreover, it also helps to understand the reasons behind the liking or disliking of the item by the user. Hence, we extend the previous method to incorporate the reviews about the items. The proxy documents
for the items are passed through a Latent Dirichlet Allocation (LDA) framework to identify the latent topics present in the documents.
LDA is a probabilistic topic modeling technique that discovers latent topics in the documents. It represents each document di by K-dimensional topic distribution θi through Dirichlet distribution. The k-th dimension of the vector indicates the probability with which thek-th topic is being discussed in the document. Each topic is associated with the word distribution φk which is the probability of the word-topic association.
We pass the collection of documents D = ∪i∈Idi to LDA. As an output, we get the topic vector qi corresponding to each document di ∈ D. For each item i, the latent representation is now fixed at qi, and these values of qi’s are fed to the factor modeling technique used in Section 3.2.1. The objective function for this method is given by Equation 3.10. The optimization variables (parameters) now become
Θ = {B, P}. The solution to this objective function is obtained through Stochastic Gradient Descent. min Θ X (u,i,j)∈T ruij− sij 1 +sij 2 +λ||pu||2+ λ 2||bi|| 2 + λ 2||bj|| 2 (3.10)
Here qi remains fixed throughout the learning process. Hence, we do not have regu-larization term forqi in the objective function. The update rules remain same for pu, bi and bj as in Equation 3.4, 3.7 and 3.8 respectively. Personalized utility scores of the items are computed using Equation 3.9 and recommendations are generated.
3.2.3
Pairwise Relation based Factor modeling with Topics
and Offset (
PReFacTO
)
In the previous method described in Section 3.2.2, the topic modeling provides the seed information for the item latent vector representations obtained from the reviews. These representations were fixed throughout the learning process. In our next method, we allow the item representations to take deviations from their LDA topic vectors. If i is the deviation of the item i’s representation from its topic vector qi, then the pairwise ratings can be modeled as:
ˆ ruij = exp (pu((qi+i)−(qj +j)) + (bi−bj)) 1 + exp (pu((qi+i)−(qj +j)) + (bi−bj)) = 1 1 + exp (−(pu((qi+i)−(qj +j)) + (bi −bj)))) (3.11)
The parameters for this model are Θ = {B, P,E}. As earlier, B and P are the collection of item-bias vectors and user vectors. E is the collection of deviations or offsets of the items from their LDA topic vectors. The objective function for this model can be written as:
min Θ X (u,i,j)∈T ruij− sij 1 +sij 2 +λ||pu||2 + λ 2||bi|| 2 + λ 2||bj|| 2 + λ 2||i|| 2 + λ 2||j|| 2 (3.12) where sij = exp (pu(qi+i)−(qj +j)) + (bi−bj)) and ruij is already defined in Equation 3.1.
The model parameters are learned using Stochastic Gradient Descent. The update rules are given below:
pu ←pu+α 2euijsij((qi+i)−(qj +j)) (1 +sij)2 −2λpu (3.13)
i ←i+α 2euijsijpu (1 +sij)2 −λi (3.14) j ←j−α 2euijsijpu (1 +sij)2 +λj (3.15) where euij =ruij−
sij
(1+sij).
The update rules for the bias terms remain same as specified in Equations 3.7 and 3.8. After the optimized values of the parameters are obtained, personalized utility of the item i for user u is computed using following equation and Top-N recommendations are made for each user.
ρui=bi+pu(qi+i) (3.16)
3.3
Baseline Methods
3.3.1
Absolute Rating based Factor modeling (
Pointwise
)
We take a different approach from the standard Matrix Factorization technique and converting the absolute ratings using the sigmoid function. If the ratings given by user u to the item i is rui, then we define the (actual or ground truth) preference strength for the dyad (u, i) aspui= exp (rui) 1 + exp (rui) = 1 1 + exp (−(rui)) (3.17)
The predicted utility scores pui’s can be modeled as:
ˆ pui = exp (puqi+bi) 1 + exp (puqi+bi) = 1 1 + exp (−(puqi+bi))) (3.18)
The mean-squared error (MSE) function with regularization term is used as the objective function. The optimization is generally performed using Stochastic Gradient Descent (SGD) and the algorithm outputs optimized values of the rating parameters
min Θ X (u,i)∈T pui− si 1 +si 2 +λ||pu||2+ λ 2||qi|| 2+ λ 2||bi|| 2 (3.19) where si = exp (puqi+bi)
The update rules, to obtain the optimized values of the parameters, are mentioned below: Update rules : pu ←pu+α 2euisiqi (1 +si)2 −2λpu (3.20) qi ←qi+α 2euisipu (1 +si)2 −λqi (3.21) bi ←bi+α 2euisi (1 +si)2 −λbi (3.22) where eui =pui− si
(1+si) and α is the learning rate.
After obtaining the model parameters through stochastic gradient descent, the personalized utility of the item i for the user u is predicted as:
ρui=bi+puqi (3.23)
The final computation of the personalized utility are same for the pointwsie as well as pairwise methods (Equation 3.9). The top-N items according to this predicted personalized utility are recommended to the user.
3.3.2
Absolute Rating based Factor modeling with Topics
(
Pointwise+Topics
)
User feedback in the form of reviews helps to interpret justifiable latent factors for the items in terms of topics identified by the LDA from the review documents of the items.
Hence, we extend the previous pointwise method to incorporate the reviews about the items. We pass the document of the items (documents of the items are formed from the reviews as mentioned earlier) to LDA. For each document di, LDA outputs a topic vector qi.
For each item i, the latent representation is now fixed at qi, and these values of qi’s are fed to the factor modeling technique used in Section 3.3.1. Since the
latent representation of the items qi is fixed, optimization parameters now become
Θ ={B, P}. The objective function is as follows:
min Θ X (u,i)∈T pui− si 1 +si 2 +λ||pu||2+ λ 2||bi|| 2 (3.24)
Here qi remains fixed throughout the learning process. Hence, we do not have regularization term for qi in the objective function. The update rules remain same forpu, bi and bj as in Equation 3.20 and 3.22 respectively. Personalized utility scores of the items are computed using Equation 3.23 and recommendations are generated.
3.3.3
Absolute Rating based Factor modeling with Topics and
Offset (
Pointwise+Topics+Offset
)
We use the latent variable introduced in Section 3.2.3.
In the previous section, the latent representations for the items were fixed. But, in this method, we allow the item representations to take deviations from their LDA topic vectors. If i is the deviation of the item i’s representation from its topic vector qi, then the scores of an itemifor useru can be modeled from the rating information as: ˆ pui = exp (pu(qi+i) +bi) 1 + exp (pu(qi+i)) +bi) = 1 1 + exp (−(pu(qi+i)) +bi))) (3.25)
The parameters for this model areΘ = {B, P,E}. As mentioned earlier, B andP are the item-bias vectors and user vectors respectively. E are item-latent offsets. The objective function for this model can be written as:
min Θ X (u,i)∈T pui− si 1 +si 2 +λ||pu||2+ λ 2||bi|| 2+ λ 2||i|| 2 (3.26)
where si = exp (pu(qi+i) +bi)and pui is already defined in Equation 3.17.
Using Stochastic Gradient Descent, model parameters are learned. The update rules are as follows:
pu ←pu+α 2euisi(qi+i) (1 +si)2 −2λpu (3.27)
i ←i+α 2euisipu (1 +si)2 −λi (3.28) where eui=rui− (1+sisi).
The update rule for the bias term remains same as specified in Equation 3.22. Personalized utility of the item i for user u is computed using following equation:
ρui=bi+pu(qi+i) (3.29) The ranking of the items is done based on these predicted utility scores and top-N recommendations are made for the user.
Chapter 4
Performance Evaluation
4.1
Dataset
We use the Amazon product review dataset1 for our experiments. This dataset
con-tains reviews and ratings given to different items by different users. We consider items from the Movies and TV category. All items in this category were released between 1999 to 2013. We divided this timeline into three blocks each consisting of 5 year span: (A) 1999-2003, (B) 2004-2008, and (C) 2009-2013. From each block, we removed the items which have less than 10 reviews in that block and the users who have given less than 5 reviews in that block. After this filtering to remove these non-prolific users and items, we have 3,513 items, 85,375 users, 725,198 ratings and 725,176 reviews in our dataset. We have used 70% of this data for training and the remaining 30% for testing purposes. From the dataset available, the release date or year of the item is not available. Thus, we have induced the release year of the item as the earliest year in which the first review of that item was written. For each block, we have identified the number of distinct users and number of distinct items as shown in Table 4.1
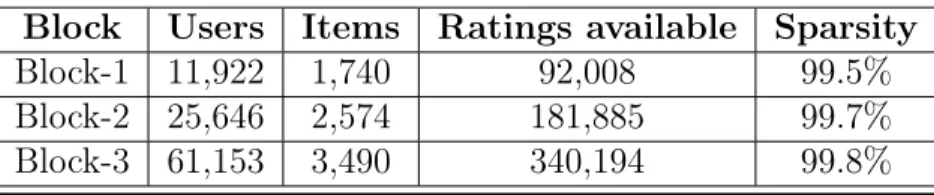
Table 4.1: Block-wise statistics for distinct users, items and ratings available
Block Users Items Ratings available Sparsity
Block-1 11,922 1,740 92,008 99.5% Block-2 25,646 2,574 181,885 99.7% Block-3 61,153 3,490 340,194 99.8%
The statistics shows that Block-1has only ratings92,008available out of20,744,280 1http://jmcauley.ucsd.edu/data/amazon/
total user-item interactions/ratings. Similarly, for Block-2, there are181,885 ratings available out of 66,012,804 from the distinct users and items available in that block. For Block-3, there are 340,194 ratings available out of total 213,423,970 user-item interactions. So, the sparsity is higher in Block-2as compared to Block-1and highest in Block-3 as compared to other two blocks.
4.2
Baselines
We compare our preference relation based models to the following baselines:
(a) Absolute Rating based Factor modeling (Pointwise): In analogous to
the standard latent-model [1], where the matrix factorization is used to predict the unknown ratings for the given (user,item) pair, we use the absolute ratings to train the model. We convert these ratings using the sigmoid function. The detailed description of this method is provided in Section 3.3.1 .
(b) Absolute Rating based Factor modeling with Topics
(Pointwise+Topics) : We combine the topic modeling technique with the latent factor modeling. The latent vector representations of the items are drawn from the reviews (by passing the reviews of the items as an input to the LDA) and fed to latent factor model. This method is discussed in Section 3.3.2.
(c) Absolute Rating based Factor modeling with Topics And Offset
(Pointwise+Topics+Offset) : Along with the factor and the topic mod-eling, we introduce item latent vector offset which captures the deviations of the item feature vector space representations drawn from the LDA. Section 3.3.3 contains the detailed description of this method.
4.3
Evaluation
For evaluation of the models presented in Section 3.2, we compare those three algo-rithms with the baseline methods mentioned in Section 4.2. We use Precision@N, Recall@N, IRecall and URecall as the evaluation metrics. Here, N is the number of recommendations. We took N = 100.
Precision: Precision is defined as:
P recision= 1 |U| |U| X i=1 x y, (4.1)
where x = |Items recommended| ∩ |Items rated| and y = N is the size of the recommendation list. For each user, we compute the precision as the items which have been rated and recommended to the number of recommendations made to the user. The mean precision value is computed by taking average of the precision values of all the users.
Recall: Recall is defined as:
Recall= 1 |U| |U| X i=1 x z, (4.2)
where x = |Items recommended| ∩ |Items rated| and z = |Items rated| For each user, we compute the recall as the items which have been rated and recommended to the number of items rated by the user. The mean recall value is computed by taking average of the recall values of all the users. Figure 4.1 explains the precision and recall graphically in form of set theory.2
Figure 4.1: Precision And Recall The IRecall and the URecall metrics are described below.
IRecall: IRecall of an item is computed using the following equation: IRecalli = |Rec(i)∩Rated(i)|
|Rated(i)| , (4.3)
where Rec(i) denotes the sets of users to whom item i is recommended. Rated(i)
denotes the set of users who have i in their test set. Thus this metric measures the algorithm’s ability to recommend items to the users who have actually rated it. IRecall for an algorithm is defined as the average of the item-wise IRecall values over the set of concerned items.
2Dan Termale 2012, Precision and Recall - Finding the right
docu-ment all the time, Konica Minolta ECM Blog, accessed 28 Dec 2017,
URecall: URecall of a user is computed as:
U Recallu = |Rec(u)∩Rated(u)|
|Rated(u)| , (4.4)
where Rec(u) denotes the sets of items that have been recommended to user u. Rated(u) denotes the set of items present in the test set of user u. Thus this metric measures the algorithm’s ability to recommend the items that have been actually rated by the user.
For the experimentation and evaluation purposes, we have divided the items into bins. These bins are created based on the number of reviews. For each block, we maintain item review count written by the user during that time span (block range). We define two bins for each block as follows: Bin-0 consists of the items having review count less than 40 and Bin-1 contains the items having review count greater than or equal to 40. We consider the Bin-0 as a collection of sparse items, and the items from Bin-1 as dense items. For each bin, we compute the average of the IRecall values of all the items present in the corresponding bin. Analogous to the items, we divide the users as well into the bins based on the number of reviews given by the user. Also, we take the average of the URecall values of all the users falling into the corresponding bin. We then compare the IRecall and URecall values of the different methods mentioned in this thesis with the baseline approaches.
Mean Reciprocal Rank(MRR): Mean Reciprocal Rank for the set of users U
is computed as: M RR= 1 |U| |U| X i=1 1 ranki (4.5)
where ranki is the position of the first hit in the recommended list where the rated item of the user has been recommended.
We compare the ground-truth data of the users consisting of the items rated by them with the recommended list generated by the models.For each user, we find the first rated item present in the recommended list and calculate its multiplicative inverse. This corresponds to the reciprocal rank of the user. To compute the mean reciprocal rank over all the users, we take the average of the reciprocal rank of the users.
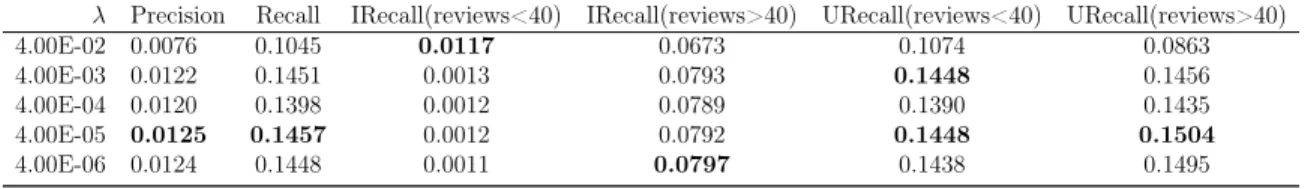
Table 4.2: Values of the evaluation metrics for different values ofλ. Number of topics were fixed at 10.
λ Precision Recall IRecall(reviews<40) IRecall(reviews>40) URecall(reviews<40) URecall(reviews>40)
4.00E-02 0.0076 0.1045 0.0117 0.0673 0.1074 0.0863 4.00E-03 0.0122 0.1451 0.0013 0.0793 0.1448 0.1456 4.00E-04 0.0120 0.1398 0.0012 0.0789 0.1390 0.1435 4.00E-05 0.0125 0.1457 0.0012 0.0792 0.1448 0.1504 4.00E-06 0.0124 0.1448 0.0011 0.0797 0.1438 0.1495
4.4
Experiment Results
We have implemented the algorithm and build models for all the six methods discussed above (three baseline methods and three proposed methods) and compared their results based on the evaluation metric measures.
Setting the parameters for the proposed method: To minimize the
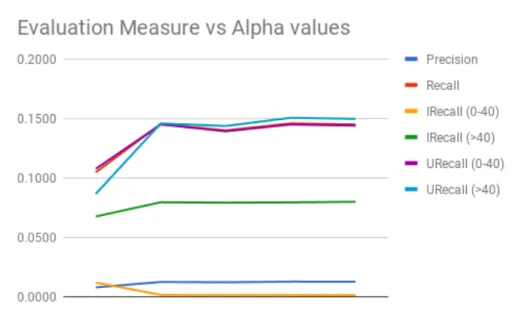
objec-tive function, we need to set the hyperparameters λ (regularization parameter) and K (number of topics). This setting produces best models for recommendation by finding the optimized values of the prediction parameters. We perform the experi-ments based on setting different values of the learning rate and obtain the predicted ratings. We evaluate the models based on different evaluation metrics and plotted the graph of these evaluation metrics with respect to different λ values. Figure 4.2 (x-axis represents different alpha values ranging from 4e−1 to 4e−6 and y-axis
repre-sents the evaluation metrics measure for the PReFacTO method)3. The metrics value
saturate after a point. The recommendation size taken into account while evaluating these models is N = 100.
Taking the value of λ as4E−05, we trained the model and obtain the optimized value of the user-item rating prediction.
We varied the value ofK to study the effect of number of topics on the prediction. The number of topics equals the hidden dimensions of the user-latent vector and the item-latent vector representations. Figure 4.3 shows the metrics measure based on the values of K. The graph shows the precision, recall and MRR remains same and does not vary much with the change in the number of hidden dimensions or the number of topics. The IRecall and URecall metrics have peak values at K = 10.
Performance of the algorithm on the test set for different values of λ (keeping K fixed at 10) and different values of K (keeping λ fixed at 4E −05 are shown in numbers as well in Table 4.2 and Table 4.3 respectively. From the experiments, the combination of λ = 4E −05 and K = 10 were found to be the best values for the
3Here, the graph is shown only for PReFacTO method. For all other methods similar graph can
Figure 4.2: Evaluation metrics based on different λ values
Table 4.3: Values of the evaluation metrics for different values of K: the number of topics. The value of λ was fixed at 4.00E−05.
No.of Topics Precision Recall IRecall(reviews<40) IRecall(reviews>40) URecall(reviews<40) URecall(reviews>40)
5 0.0107 0.1229 0.0008 0.0781 0.1221 0.1302
10 0.0125 0.1457 0.0012 0.0792 0.1448 0.1504
15 0.0108 0.1246 0.0011 0.0778 0.1238 0.1324
20 0.0108 0.1244 0.0008 0.0784 0.1233 0.1331
parameters. Hence, we select these two values of the hyperparameters for further experimentation.
Comparison with other methods: We evaluate the models discussed in this
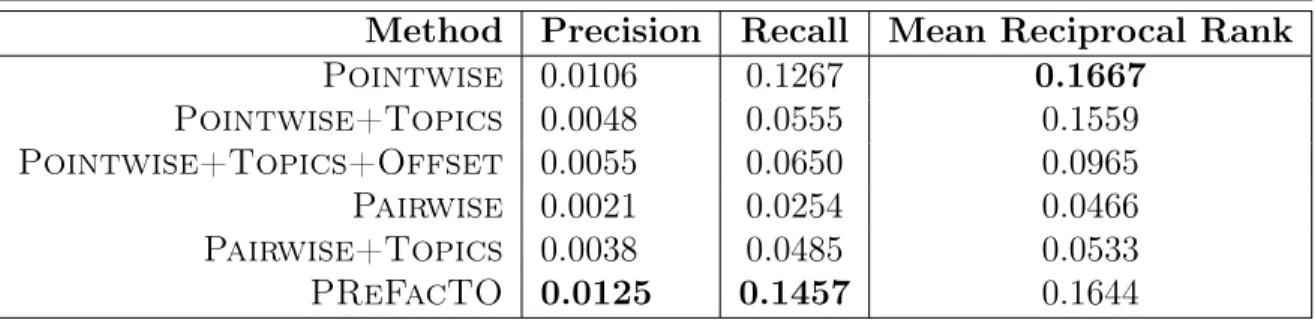
work by comparing the precision, recall and Mean Reciprocal Rank (MRR) values of these models as shown in Table 4.4. The results suggest that the PReFacTO method outperforms all other methods in terms of overall precision and recall values. It is comparable to Pointwise method in terms of Mean Reciprocal Rank.
The IRecall values for different methods are shown in Table 4.5. These values suggest that the Pairwise method performs well for the items having review count less than 40 and PReFacTO performs well for the items having review count greater than 40. The items which are sparse can be recommended more effectively using the Pairwise method and dense items by the PReFacTO method.
Figure 4.3: Evaluation metrics based on varying number of topics
Table 4.4: Comparison of the evaluation metrics (Precision, Recall and MRR) of the proposed methods with the baseline approaches
Method Precision Recall Mean Reciprocal Rank
Pointwise 0.0106 0.1267 0.1667 Pointwise+Topics 0.0048 0.0555 0.1559 Pointwise+Topics+Offset 0.0055 0.0650 0.0965 Pairwise 0.0021 0.0254 0.0466 Pairwise+Topics 0.0038 0.0485 0.0533 PReFacTO 0.0125 0.1457 0.1644
the PReFacTO performs well both for the sparse users as well the dense users.
4.5
Experimental Analysis and Discussion
It can be seen from the experimental results that pairwise methods and in particular, PReFacTO gives the best results compared to other algorithms for the complete dataset. Although the PReFacTO and pointwise are at par based on their per-formance but the PReFacTO slightly surpasses the pointwise in terms of overall precision and recall values. If we compare the IRecall values for the sparse items, the Pairwise method outperforms all other approaches. The IRecall values for dense
Table 4.5: Comparison of the IRecall values of the proposed methods with the baseline approaches
Method IRecall(reviews<40) IRecall(reviews>40)
Pointwise 0.0141 0.0635 Pointwise+Topics 0.0256 0.0551 Pointwise+Topics+Offset 0.0252 0.0514 Pairwise 0.0420 0.0312 PairWise+Topics 0.0378 0.0399 PReFacTO 0.0012 0.0792
Table 4.6: Comparison of the URecall values of the proposed methods with the base-line approaches
Method URecall(reviews<40) URecall(reviews>40)
Pointwise 0.1271 0.1210 Pointwise+Topics 0.0551 0.0568 Pointwise+Topics+Offset 0.0651 0.0632 Pairwise 0.0255 0.0252 PairWise+Topics 0.0491 0.0448 PReFacTO 0.1448 0.1504 0 0.01 0.02 0.03 0.04 0.05 0.06 0.07 0.08
Block-1 Block-2 Block-3 Average
Pointwise Pointwise+Topic Pointwise+Topic+Offset Pairwise Pairwise+Topic PreFacTO
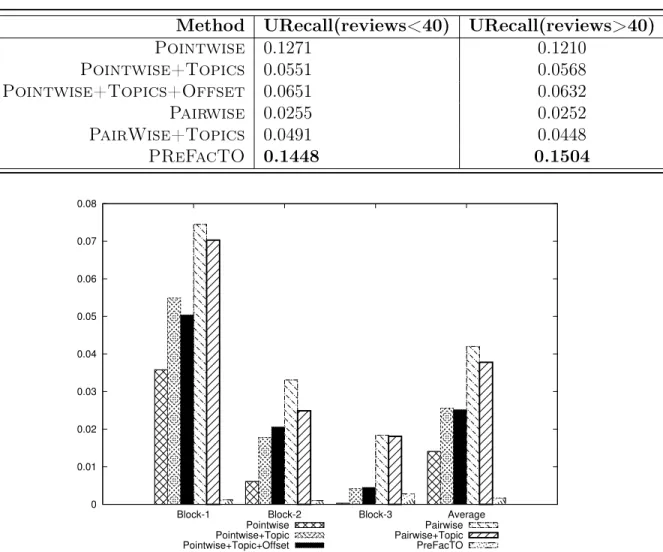
Figure 4.4: Comparison of IRecall values of different algorithms taking into consider-ation the items having review count less than 40.
0 0.02 0.04 0.06 0.08 0.1 0.12 0.14
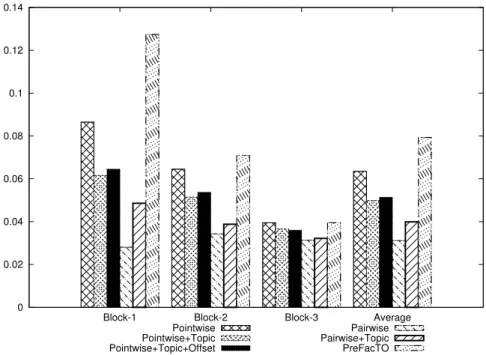
Block-1 Block-2 Block-3 Average Pointwise Pointwise+Topic Pointwise+Topic+Offset Pairwise Pairwise+Topic PreFacTO
Figure 4.5: Comparison of IRecall values of different algorithms with review count of the items greater than or equal to 40.
items shows that PReFacTO performs very well. The IRecall values for the sparse and dense items for different blocks are compared in Figure 4.4 and Figure 4.5 respec-tively. There are four groups of columns in both the figures. The first three represent the three blocks, and the last one represents the average value over the three blocks. The superior performance of Pairwise and worst performance of PReFacTO in case of the sparse items might be due to the sparseness of the reviews. The LDA representation for the sparse items having very less reviews and further learning in the form of deviations on top of the LDA vectors do not provide any additional benefit. On the contrary, it might have led to overfitting. But on the other hand, Pairwise tries to model the system only through rating information. The preference relations provide some additional information to the item in the process of comparing it with the other items. There is no overfitting in the process and modeling the system for the sparse items works well. If we look at URecall values for the sparse users, the PReFacTO actually performs well.
However, in case of dense items, the PReFacTO outperforms every other method including Pointwise. Along with the pairwise preference based learning, the item vector representation from the rich-textual information of the reviews and learning the deviations from these item vectors helps in better prediction with reasoning as to why the item will be likeable or dislikable to the user.
In any real recommendation system, there are sparse items, and there are dense items as well. Depending on the exact system or domain, the ratio of sparse to dense items can vary. In this study, we have explored few algorithms that consider pairwise feedback instead of absolute ratings. Among the proposed methods,Pairwiseworks well for sparse items and PReFacTO works well for dense items. The experiments show the power of preference relations based feedback for recommendation. However, it does not establish the superiority of any single algorithm that works across the entire range of data (both sparse and dense zones). Nonetheless, we believe that it might be possible to design such algorithms that work well for the entire range of data. It might be an interesting research direction to develop hybrid methods that considers bothPairwiseandPReFacTOfor fusing the recommendations from sparse and dense zones to generate the final recommendations. It might also be possible to develop parameterized algorithms that automatically switches between Pairwise (no consideration of reviews) and PReFacTO (considering the reviews) depending on the availability of data for the item under consideration during the modeling.
Chapter 5
Conclusions
We have presented the PReFacTO approach in this thesis, which aligns the latent factor modeling between the users and the item pairs with the hidden topics in the reviews of the item. The pairwise relation adds significant information for the sparse items and provides better modeling of the user-item interaction, and the item hidden dimensions are effectively drawn from the reviews.The topic modeling based latent factors of the items along with the pairwise relation between these items (where the latent feature space of the items drawn from the LDA are allowed to change through offset during the learning process) provides significant improvement over the methods considered in isolation. Our algorithm runs very effectively on large dataset and comparable with the pointwise approach. In fact, PReFacTO method gives marginal improvements over the pointwise methods. It is also shown that Pairwise method works well for the sparse items and PReFacTO provides better performance in case of dense items.
Chapter 6
Future Work
It was observed in the experimental results thatPairwiseworks well for sparse items and PReFacTO works well for dense items. It might be possible to develop hybrid methods that consider both Pairwise and PReFacTO and fuse the recommenda-tions generated by them from sparse and dense zones to come up with the final rec-ommendations. It might also be possible to develop parameterized algorithms that automatically switch between Pairwise (no consideration of reviews) and PReF-acTO (considering the reviews) depending on the availability of data for the item under consideration during the modeling.
Publications
• Priyanka Choudhary, Maunendra Sankar Desarkar. PReFacTO: Preference
Relations Based Factor Model with Topic Awareness and Offset.
References
[1] R. B. Koren, Yehuda and C. Volinsky. Matrix factorization techniques for rec-ommender systems. Computer (Long Beach, Calif.) 42, (2009) 30–37.
[2] D. Agarwal and B.-C. Chen. Regression-based latent factor models. In Proceed-ings of the 15th ACM SIGKDD international conference on Knowledge discovery and data mining. ACM, 2009 19–28.
[3] R. Salakhutdinov and A. Mnih. Bayesian probabilistic matrix factorization using Markov chain Monte Carlo. In Proceedings of the 25th international conference on Machine learning. ACM, 2008 880–887.
[4] C. Wang and D. M. Blei. Collaborative topic modeling for recommending scien-tific articles. In Proceedings of the 17th ACM SIGKDD international conference on Knowledge discovery and data mining. ACM, 2011 448–456.
[5] J. McAuley and J. Leskovec. Hidden factors and hidden topics: understanding rating dimensions with review text. Proceedings of the 7th ACM conference on
Recommender systems. ACM, 2013 165–172.
[6] M. S. Desarkar, S. Sarkar, and P. Mitra. Aggregating Preference Graphs for Collaborative Rating Prediction. In Proceedings of the Fourth ACM Conference on Recommender Systems, RecSys ’10. ACM, New York, NY, USA, 2010 21–28. [7] M. S. Desarkar, R. Saxena, and S. Sarkar. Preference relation based matrix fac-torization for recommender systems. In International conference on user model-ing, adaptation, and personalization. Springer, 2012 63–75.
[8] S. Kalloori, F. Ricci, and M. Tkalcic. Pairwise preferences based matrix factor-ization and nearest neighbor recommendation techniques. In Proceedings of the 10th ACM Conference on Recommender Systems. ACM, 2016 143–146.
[9] N. Jones, A. Brun, and A. Boyer. Comparisons instead of ratings: Towards more stable preferences. In Proceedings of the 2011 IEEE/WIC/ACM International Conferences on Web Intelligence and Intelligent Agent Technology-Volume 01. IEEE Computer Society, 2011 451–456.
[10] S. Liu, G. Li, T. Tran, and Y. Jiang. Preference Relation-based Markov Random Fields for Recommender Systems. In G. Holmes and T.-Y. Liu, eds., Asian Conference on Machine Learning, volume 45 ofProceedings of Machine Learning
Research. PMLR, Hong Kong, 2016 157–172.
[11] Y. Koren and R. Bell. Advances in collaborative filtering. In Recommender systems handbook, 77–118. Springer, 2015.
[12] D. Agarwal and B.-C. Chen. fLDA: matrix factorization through latent dirichlet allocation. In Proceedings of the third ACM international conference on Web search and data mining. ACM, 2010 91–100.
[13] G. Ganu, N. Elhadad, and A. Marian. Beyond the stars: improving rating predictions using review text content. In WebDB, volume 9. Citeseer, 2009 1–6. [14] L. Blédaité and F. Ricci. Pairwise preferences elicitation and exploitation for con-versational collaborative filtering. In Proceedings of the 26th ACM Conference on Hypertext & Social Media. ACM, 2015 231–236.
[15] L. Peska and P. Vojtas. Using implicit preference relations to improve recom-mender systems. Journal on Data Semantics 6, (2017) 15–30.