Northumbria Research Link
Citation: Pandit, Diptangshu, Zhang, Li, Chattopadhyay, Samiran, Lim, Chee Peng and Liud, Chengyu (2018) A Scattering and Repulsive Swarm Intelligence Algorithm for Solving Global Optimization Problems. Knowledge-Based Systems, 156. pp. 12-42. ISSN 0950-7051
Published by: Elsevier
URL: http://dx.doi.org/10.1016/j.knosys.2018.05.002 <http://dx.doi.org/10.1016/j.knosys.2018.05.002> This version was downloaded from Northumbria Research Link: http://nrl.northumbria.ac.uk/34387/ Northumbria University has developed Northumbria Research Link (NRL) to enable users to access the University’s research output. Copyright © and moral rights for items on NRL are retained by the individual author(s) and/or other copyright owners. Single copies of full items can be reproduced, displayed or performed, and given to third parties in any format or medium for personal research or study, educational, or not-for-profit purposes without prior permission or charge, provided the authors, title and full bibliographic details are given, as well as a hyperlink and/or URL to the original metadata page. The content must not be changed in any way. Full items must not be sold commercially in any format or medium without formal permission of the copyright holder. The full policy is available online:
http://nrl.northumbria.ac.uk/pol i cies.html
This document may differ from the final, published version of the research and has been made available online in accordance with publisher policies. To read and/or cite from the published version of the research, please visit the publisher’s website (a subscription may be required.)
A Scattering and Repulsive Swarm Intelligence
Algorithm for Solving Global Optimization
Problems
Diptangshu Pandit1, Li Zhang1, Samiran Chattopadhyay2, Chee Peng Lim3 and Chengyu Liu4
1Computational Intelligence Research Group
Department of Computer and Information Sciences Faculty of Engineering and Environment
University of Northumbria Newcastle, NE1 8ST, UK
2Department of Information Technology
Jadavpur University Kolkata, India
3Institute for Intelligent Systems Research and Innovation
Deakin University Waurn Ponds, VIC 3216, Australia
4School of Instrument Science and Engineering, Southeast University, Nanjing, 210018, P.R. China
Email: {d.pandit; li.zhang}@northumbria.ac.uk; [email protected]; [email protected]; [email protected]
Abstract.
The firefly algorithm (FA), as a metaheuristic search method, is useful for solving diverse optimization problems. However, it is challenging to use FA in tackling high dimensional optimization problems, and the random movement of FA has a high likelihood to be trapped in local optima. In this research, we propose three improved algorithms, i.e., Repulsive Firefly Algorithm (RFA), Scattering Repulsive Firefly Algorithm (SRFA), and Enhanced SRFA (ESRFA), to mitigate the premature convergence problem of the original FA model. RFA adopts a repulsive force strategy to accelerate fireflies (i.e. solutions) to move away from unpromising search regions, in order to reach global optimality in fewer iterations. SRFA employs a scattering mechanism along with the repulsive force strategy to divert weak neighbouring solutions to new search regions, in order to increase global exploration. Motivated by the survival tactics of hawk-moths, ESRFA incorporates a hovering-driven attractiveness operation, an exploration-driven evading mechanism, and a learning scheme based on the historical best experience in the neighbourhood to further enhance SRFA. Standard and CEC2014 benchmark optimization functions are used for evaluation of the proposed FA-based models. The empirical results indicate that ESRFA, SRFA and RFA significantly outperform the original FA model, a number of state-of-the-art FA variants, and other swarm-based algorithms, which include Simulated Annealing, Cuckoo Search, Particle Swarm, Bat Swarm, Dragonfly, and Ant-Lion Optimization, in diverse challenging benchmark functions.
Keywords: Optimization, Metaheuristic Search Algorithms, and Firefly Algorithm.
1.
INTRODUCTION
Nature inspired algorithms have gained popularity and been widely used for solving various global optimization problems. Among them, the firefly algorithm (FA) [1] is a popular metaheuristic search method that has been applied to undertaking diverse optimization problems in engineering, medical, and social sciences [2]. In FA, each firefly represents a solution in the search space. Its light intensity is determined by an objective function. Each firefly moves to the optimal region by following multiple optimal solutions in the neighbourhood. Overall, the FA search strategies enable the fireflies (i.e. solutions) with lower light intensities (i.e. fitness values) to move towards those with higher light intensities in the neighbourhood, in
order to achieve global optimality. Although each firefly serves as a search agent to increase global exploration, the empirical results [3, 4] indicate that high dimensional optimization problems still pose great challenges to FA, and the random movement of FA has a high likelihood to be trapped in local optima. One of the limitations of the original FA model is its pure attractiveness force that moves each firefly towards the brighter counterparts in the neighbourhood. If there is no brighter firefly in the neighbourhood, the attractiveness action stagnates, and there is no alternative mechanism to drive the search out of the local optima traps. In other words, there is no effective strategy to avoid poor solutions while moving towards the optimal ones. Moreover, by following the neighbouring brighter fireflies, there is an increased likelihood that part of the population could be clustered in the same region, therefore reducing the possibility of finding the global optimum residing elsewhere. Solving the first issue results in better performance and faster convergence, while resolving the second issue tackles the premature convergence problem. Both challenges constitute the key motivation of this research.
To deal with the abovementioned challenges, this research proposes three FA variants, i.e., Repulsive Firefly Algorithm (RFA), Scattering Repulsive Firefly Algorithm (SRFA), and Enhanced SRFA (ESRFA). Besides the conventional attractiveness movement of the FA model, RFA uses a repulsive force strategy to drive the search to reach global optimality in fewer iterations. SRFA, in addition to using the repulsive force action, incorporates a scattering mechanism to explore rarely exploited distinctive search spaces to increase search diversity and overcome premature convergence. ESRFA incorporates hawk-moths’ local hovering and sharp dive escaping movements to diversify the attractiveness and repulsive force actions of SRFA, as well as exchanges with historical best experiences in the neighbourhood to accelerate convergence. Specifically, the research novelties are five-fold. (1) The proposed repulsive force works together with the original attractive force to enable the search procedure to converge towards the global optima and, at the same time, avoid poor solutions. (2) The scattering strategy overcomes premature convergence by diverting a number of weak solutions to unexploited regions. (3) Exploitation-driven attractiveness and exploration-based evading mechanisms are used to enhance the search operations in diversifying the search process. (4) Interactions with the historical personal best experiences of other fireflies are conducted to accelerate convergence. (5) The proposed strategies cooperate with each other to overcome premature convergence, especially in solving high dimensional optimization problems. We evaluate the three proposed FA models with ten standard and CEC2014 [5] benchmark optimization functions. RFA, SRFA and ESRFA significantly outperform state-of-the-art FA variants and other evolutionary search methods, which include Particle Swarm Optimization (PSO) [6], Simulated Annealing (SA) [7], FA, Bat Swarm Optimization (BSO) [8, 9], Cuckoo Search Optimization (CSO) [10], Dragonfly Optimization (DFO) [11] and Ant-Lion Optimization (ALO) [12]. The research contributions are summarized, as follows:
Three FA variants, i.e., RFA, SRFA and ESRFA, are proposed. RFA incorporates a repulsive force strategy to enable fireflies with higher light intensities to jump out of unpromising search regions to achieve fast convergence.
SRFA employs the repulsive force action and a scattering mechanism to avoid local optima. The latter diverts a proportion of weak neighbouring solutions to an unexploited distinctive search space to increase search diversity. The repulsive behaviour and the scattering mechanism in SRFA work cooperatively to mitigate premature convergence of the original FA model. On one hand, when the repulsive force action stagnates, the scattering mechanism is able to extend the search to rarely explored regions to reduce the probability of premature convergence. On the other hand, when the scattering behaviour is unable to generate fitter solutions, the repulsive force action enables each firefly to conduct long jumps to move towards optimal regions to escape from local optima.
ESRFA incorporates exploitation and exploration coefficients to diversify the attractiveness and repulsive operations of SRFA, respectively, and interacts with neighbouring historical best experiences to accelerate convergence. It has three key properties. Firstly, the exploitation factor simulates the mid-air hovering of hawk-moths around attraction, which enables a refined random examination of a promising neighbourhood and overcomes the local optima traps, as compared with the original attractiveness operation in FA. Secondly, the exploration-driven escaping coefficient simulates a sharp dive of moths in response to predators, which enables the search to explore a wider search space while evading from the worse solutions. The newly proposed attractiveness operation increases local exploitation while the updated evading action increases global exploration. In other words, both properties enable the search process to balance well between local exploitation and global exploration. Thirdly, a distinctive attractiveness-based operation guided by the historical personal best experiences of neighbouring fireflies is conducted to accelerate convergence.
A comprehensive evaluation with diverse unimodal, multimodal and challenging CEC2014 optimization functions is conducted. The proposed RFA, SRFA and ESRFA models outperform the original FA model and advanced FA variants, as well as other metaheuristic search methods, significantly. They also show great robustness and superiority in dealing with complex high dimensional optimization problems.
The paper is organised as follows. A literature review on related work is presented in Section 2. The proposed RFA, SRFA and ESRFA models are introduced in detail in Section 3. Comprehensive experiments for evaluation of three proposed models are presented in Section 4. Finally, conclusions and directions for future work are given in Section 5.
2.
RELATED WORK
Swarm intelligence (SI) based optimization methods have gained popularity recently [13, 14]. As a recent SI algorithm, FA is an effective metaheuristic search method on par with other existing models, in solving diverse optimization problems, which include PSO, Genetic Algorithm (GA), CSO, Artificial Bee Colony (ABC) and Ant Colony Optimization (ACO). In this section, we discuss the basic concepts of FA, different FA variants, and other recently proposed metaheuristic search methods.
2.1
Firefly Algorithm
Introduced by Yang [1], FA is inspired by the movement of fireflies based on their bioluminescence. It employs three strategies to guide the search process: (1) fireflies are unisex, and are attracted to each other; (2) attraction is proportional to the degree of brightness and inversely proportional to the distance between a pair of fireflies. As a result, less bright fireflies move towards the brighter ones in the neighbourhood. The brightest firefly moves randomly; (3) the brightness of each firefly represents the solution quality. In FA, each firefly represents a solution, which is characterised by its position and light intensity (the fitness value). The light intensity decreases as the distance to its source increases. The variation of light intensity is defined by
𝐼(𝑟) = 𝐼0𝑒−𝛾𝑟 2
(1)
where 𝑟 denotes the distance and 𝐼0 represents the original light intensity when the distance 𝑟 = 0. γ represents a fixed light absorption coefficient. The attractiveness of a firefly is defined by
𝛽(𝑟) = 𝛽0𝑒−𝛾𝑟2 (2) where 𝛽0 indicates the initial attractiveness when the distance r = 0. Equation (3) illustrates the position updating formula of each firefly, which moves a firefly, 𝑖, with a lower light intensity towards a brighter one, 𝑗, in the neighbourhood, i.e.,
𝑥𝑖𝑡+1= 𝑥𝑖𝑡+ 𝛽0𝑒−𝛾𝑟𝑖𝑗 2
(𝑥𝑗𝑡− 𝑥𝑖𝑡) + 𝛼𝑡𝜀𝑡 (3) where 𝑥𝑖𝑡 and 𝑥𝑗𝑡 denote the positions of fireflies i and j at the 𝑡-th iteration, respectively. 𝑟𝑖𝑗 denotes the distance between two fireflies, i and j. 𝛼𝑡is a randomization parameter that controls the step size of the randomized move with 𝜀𝑡as arandom walk behaviour defined by a Gaussian (or other) distribution. The second term in Equation (3) denotes the attractiveness behaviour while the third term implements random exploitation. The pseudo-code of the FA model [1] is presented in Algorithm 1.
Algorithm 1: Pseudo-Code of the Firefly Algorithm
1. Start
2. Initialize a population of fireflies randomly;
3. Evaluate each firefly using the fitness/objective function, 𝑓(𝑥); 4. Set light intensity 𝐼 = 𝑓(𝑥) and light absorption coefficient 𝛾;
5. While (stopping criterion is not satisfied)// until it finds the optimal solution or the maximum number of iterations is met.
6. {
7. Fori = 1 to ndo//for all fireflies
8. {
9. Forj = 1 to ndo //for all fireflies
11. If (𝐼𝑗> 𝐼𝑖)
12. {
13. Move firefly i towards firefly j using Equation (3); 14. } End IF
15. Vary attractiveness with distance 𝑟 using exp[-𝛾𝑟2];
16. Evaluate new solutions and update the light intensity values; 17. } End For
18. } End For
19. Rank the fireflies and find the current global best, gbest; 20. }End While
21. Output the most optimal solution, gbest; 22. End
FA has several distinctive advantages. FA performs automatic subdivision of the population into subgroups. Unlike the particles in PSO, which purely follow the global best solution, each firefly in FA is a search agent, and follows multiple brighter fireflies (i.e. optimal solutions) in the neighbourhood to increase global exploration. Therefore, FA shows a great capability of solving multimodal optimization problems by finding local and global optima simultaneously.
2.2
FA Variants and Other Evolutionary Search Methods
Recently, numerous modified FA models have been proposed. Fister et al. [2] discussed different FA variants proposed for challenging real-life engineering optimization applications. Known as LFA, Yang [15] replaced the Gaussian distribution with a Lévy flight for randomization to increase exploration of the original FA model. Chaos-enhanced FA with parameter tuning was also proposed by Yang [16] to overcome stagnation. Apostolopoulos and Vlachos [17] employed the original FA model for solving economic emission load dispatch problem by minimizing both fuel cost and emission of the generating units. In addition, the FA model was used in Yang et al. [18] to solve complex non-convex economic dispatch problems with nonlinear characteristics. Horng [19] combined FA with the Linde-Buzo-Gray (LBG) algorithm for vector quantization in digital image compression. Their model outperformed LBG, PSO, and quantum PSO, significantly. Hassanzadeh et al. [20] optimized the hyper-parameters of Structure Equivalent Fuzzy Neural Network using the FA model for speech recognition tasks. An FA variant was proposed by Coelho and Mariani [21] for solving chiller loading problem in heating, ventilation, and cooling systems. In their work, Gaussian distribution was used to fine-tune the randomization parameter as well as the absorption coefficient. Huang et al. [22] developed a hybrid FA model for reactor planning and placement in underground cable transmission systems. In their model, a local random search was conducted to further improve the global best solution identified by the FA model to overcome premature convergence. Evaluated with real power systems, their work showed impressive performance. Kavousi-Fard et al. [23] incorporated a modified FA model to fine-tune the hyper-parameters of a Support Vector Regressor (SVR) for short-term electrical load forecast. Their model employed mutation, crossover, and an adaptive randomization parameter to maintain swarm diversity and balance between exploitation and exploration. Marichelvam et al. [24] undertook multi-objective hybrid flowshop scheduling problems using a discreet FA model to minimize both makespan and mean flow time. Fister et al. [25] proposed several randomized FA models by employing various probability distributions as randomization strategies, including Uniform, Gaussian, Lévy, Kent, and Logistic Chaotic maps, and random sampling in turbulent fractal cloud. Coelho et al. [26] incorporated chaotic maps to fine-tune the light absorption coefficient, γ, and the step parameter, α, for randomized movements. The proposed model was evaluated with reliability-redundancy optimization problems, and outperformed the original FA model significantly. Massan et al. [27] employed the FA model for optimization of large wind farm allocation. The model outperformed GA and a finite difference method, significantly.
Zhang et al. [28] proposed an intelligent facial expression recognition system with moth-firefly feature optimization. The model integrated FA with moth-flame optimization (MFO). It employed the spiral search capability of moths to increase local exploitation of fireflies, and the attractiveness search behaviours of FA to increase global exploration of moths. Evaluated using facial expression recognition tasks with frontal-view and side-view images, the proposed model outperformed PSO, GA, FA, MFO, and other PSO and FA variants, significantly. Twelve chaotic maps were employed by Gandomi et al. [29] to fine-tune the attractiveness coefficient of FA. The Gauss map for parameter tuning yielded the most competitive performance in undertaking the Sphere and Griewank functions. Mitić et al. [30] proposed a chaotic fruit fly optimization algorithm (FOA). Ten different chaotic maps were used for dynamic parameter adjustment. Evaluated using fourteen benchmark functions, the Chebyshev map produced the best performance. FOA also outperformed other advanced chaotic accelerated search methods, including chaotic BSO, chaotic FA, chaotic CSO, chaotic ABC and chaotic PSO. Another FA variant was proposed by Amiri et al. [31] to deal
with multi-objective optimization problems for community detection in complex social networks. Besides employing the Logistic chaotic map for randomization parameter tuning, it used self-adaptive probabilistic mutation mechanisms to enable each firefly in the population to have a chance to mutate, in order to increase population diversity and overcome local optima. Evaluated using several real world and synthetic data sets, the proposed model showed superiority in achieving global optima. Teshome et al. [32] proposed an FA variant for optimization of power electronics applications. Instead of using the location of each brighter neighbouring firefly for position updating, the average position of all brighter fireflies in the neighbourhood was used to guide the search. In comparison with the original FA model, the proposed model achieved fast convergence toward optimal positions directly. Yang [33] proposed a multi-objective FA model to deal with multi-criteria design optimization in industrial engineering. Verma et al. [3] developed a modified FA algorithm, i.e. Opposition and Dimensional based FA (ODFA), for solving high-dimensional optimization problems. It used an opposition-based methodology to initialize a second swarm, which was opposite to the positions of the original population to increase exploration. Their global best solution was obtained by identifying the best solution in each dimension. Instead of using neighbouring brighter fireflies for position updating, their method used the current global best solution to update each firefly. Evaluated with eleven benchmark functions, ODFA outperformed basic search methods such as FA, PSO, and ACO. SFA and LSFA were developed by Alweshah and Abdullah [34]. SA was employed to further improve the global best solutions of FA and LFA, respectively. Both FA variants were used to optimize the weights of a neural network classifier to improve classification accuracy. Evaluated with eleven standard benchmark data sets, the proposed algorithms achieved impressive classification accuracy, outperforming FA and LFA. Kazem et al. [35] proposed a chaotic FA (CFA) for optimization of hyper-parameters of SVR, and demonstrated its application to stock market price forecasting. The proposed CFA model employed the Logistic chaotic map for population initialization. The Logistic map was also used to provide chaotic attractiveness movement by fine-tuning the randomization component. Evaluated with challenging stock market time series data from NASDAQ, the model outperformed GA-based SVR, chaotic GA-based SVR, FA-based SVR, artificial neural networks, and adaptive neuro-fuzzy inference systems, significantly.
Modified FA models have also been used to solve diverse real-life optimization problems. Zhao et al. [36] proposed a multi-objective FA model for solving radio-frequency identification (RFID) network planning. A hybrid firefly differential evolution (HFDE) algorithm was proposed by Dash et al. [37] for designing multipurpose digital linear phase double band filters. To increase global search capabilities, HFDE integrated FA with DE. It outperformed other search methods in terms of design accuracy and computational efficiency. Kaur and Ghosh [38] developed a fuzzy-firefly model for optimizing unbalanced distribution networks with the aim to reduce power losses and improve voltage profiles. Fuzzified objective functions were employed in the model. Evaluated using 25-node and 19-node unbalanced networks, the proposed model showed impressive performance, and outperformed GA, PSO, and ABC. Xiong et al. [39] conducted interval-valued time series forecasting of stock price index using a Multiple-output Support Vector Regression (MSVR) model. FA was used to identify the optimal parameter setting of MSVR. The resulting model, FA-MSVR, yielded better performances in comparison with those of PSO-MSVR and GA-MSVR for one- and multi-step-ahead stock price index forecasting. Kalantzis et al. [40] developed a GPU-based FA model for constrained optimization of intensity modulated radiation therapy treatment planning. The model performed better than a sequential version of the algorithm executed on a CPU for evaluation of both prostate and head and neck cancer cases. Kisi et al. [41] employed SVM integrated with FA for prediction of lake levels. FA was used to identify the optimal SVM parameters. The model outperformed neural networks combined with genetic programming (GP) for one-day ahead lake level prediction. A similar model that combined both SVM and FA was applied to region-based image retrieval by Kanimozhi and Latha [42]. Mistry et al. [43] proposed a modified FA model for feature selection and facial expression recognition. The global best solution of FA was enhanced by Gaussian, Cauchy and Levy distributions. The model outperformed PSO, GA, and other facial expression recognition methods. Su et al. [44] used FA for optimal band selection and parameter setting identification for the extreme learning machine (ELM). The model was applied to hyperspectral image classification, and outperformed other classical search methods in experiments using two hyperspectral image data sets, i.e. HYDICE and HYMAP. Zhang et al. [45] proposed a return-cost-based binary FA model for feature selection, while Rodrigues et al. [46] employed FA for multi-thresholding in image segmentation.
Other state-of-the-art swarm-based metaheuristic search methods have also been proposed for solving diverse optimization problems, e.g. an improved simplified swarm optimization [47] and chaotic BSO [48]. Motivated by the hunting mechanism of antlions, Mirjalili [12] proposed an ALO model that comprised hunting prey actions of ants such as randomization, building trap, entrapment, catching preys, and re-building traps. Tested with nineteen benchmark functions, and constrained optimization problems, ALO
showed superior performance in avoiding local optima and possessed a great capability of solving unimodal and multimodal optimization problems. Mistry et al. [49] proposed micro-GA embedded PSO feature optimization for facial expression recognition. The proposed PSO algorithm included a new velocity updating mechanism with sub-dimension based local facial feature search. It also adopted a non-replaceable memory and a small-population secondary swarm to increase search diversity. Ensemble classifiers were used for recognition of seven facial expressions. Evaluated with challenging facial expression recognition tasks, the proposed algorithm outperformed PSO, GA and other state-of-the-art PSO variants significantly. Srisukkham et al. [50] employed Bare-Bones PSO based feature selection for blood cancer detection. Wan et al. [51] integrated binary coded ACO (BACO) with the GA for feature optimization. Two models were proposed, i.e., a visibility density model and a pheromone density model. The GA outputs were used as the initial visibility and pheromone information of BACO, respectively. The algorithm outperformed the GA, binary PSO, binary ACO and binary differential evolution (DE) significantly when evaluated with well-known UCI data sets. Neoh et al. [52] proposed both direct similarity and Pareto-based feature selection with a layered cascade model for facial expression recognition. The former took within-class variation into account while the latter employed both between- and within-class variations for discriminative facial feature selection. Haklı and Uğuz [53] incorporated PSO with Levy flight. Their work re-distributed the particles that did not achieve improvement in a number of iterations to new unexploited search regions. Moreover, Kang et al. [54] combined PSO with the artificial immune system for structure damage detection. Non-dominated Sorting Genetic Algorithm-II (NSGA-II) was utilized for ensemble classifier construction by Zavaschi et al. [55]. Optimization was performed by minimization of both classification error and ensemble size, in order to construct the most optimal ensemble classifier.NSGA-II was also employed by Soyel et al. [56] for discriminative facial feature optimization to enhance class separation in facial expression recognition. A modified NSGA-II based feature selection model was developed by Huang et al. [57] for churn prediction in telecommunications. The model was able to identify feature subsets of different sizes to overcome the limitations of original NSGA-II, in which the search process purely focused on finding features of fixed sizes. Evaluation results indicated the efficiency of the proposed model. Other metaheuristics models for optimization tasks are also available in the literature, which include parameter identification [58], image segmentation [59], and feature selection [60], and promising future directions are discussed in [61].
3.
METHODOLOGY
In this research, we propose three FA variants, i.e., RFA, SRFA and ESRFA, to mitigate the premature convergence problem of the original FA model. RFA employs the repulsive force strategy while SRFA uses both the repulsive force and the scattering mechanisms to increase local and global search capabilities. Motivated by both RFA and SRFA, another enhanced algorithm, ESRFA, is proposed, which embeds the hovering-based attractiveness behaviour, exploration-based repulsive action, and interaction with the best memories of neighbouring fireflies to accelerate convergence.
3.1 The Proposed RFA and SRFA Models
We introduce the proposed RFA and SRFA models in detail in this section. The repulsive force strategy complements the attractiveness behaviour of the original FA model. The aim is to accelerate brighter fireflies to move away from less promising search regions to achieve fast convergence. The attractiveness and repulsive search behaviours work alternatively to guide the search process in RFA. Specifically, when there are brighter fireflies in the neighbourhood, the less bright ones are attracted to the brighter ones by the attractiveness movement as in the original FA model. On the contrary, when there are no brighter fireflies in the neighbourhood, instead of purely performing randomized movement, the fireflies employ the repulsive force action to move away from those with lower light intensities. This repulsive force movement is defined in Equation (4).
𝑥𝑖𝑡+1= 𝑥𝑖𝑡− 𝛽0𝑒−𝛾𝑟𝑖𝑗 2
Start
1. Generate an initial population of fireflies
2. Evaluate fitness of all fireflies using objective function
3. Update the brightness of the fireflies
4. Rank the fireflies
5. Move i towards j using attractiveness movement
6. Output the most optimal solution
End Termination?
Y 𝑗 is brighter than 𝑖?
Y
5. Move i away from j
using repulsive force action N j == n? i == n? N N N Y Y (a)
where 𝑟𝑓 denotes a repulsive force factor with the assumption that firefly i has better fitness than thatof firefly j. Equation (4) indicates that brighter firefly i moves away from the less optimal solution j. Alternatively, this can be interpreted as the less bright firefly j pushes the brighter firefly iaway from itself.
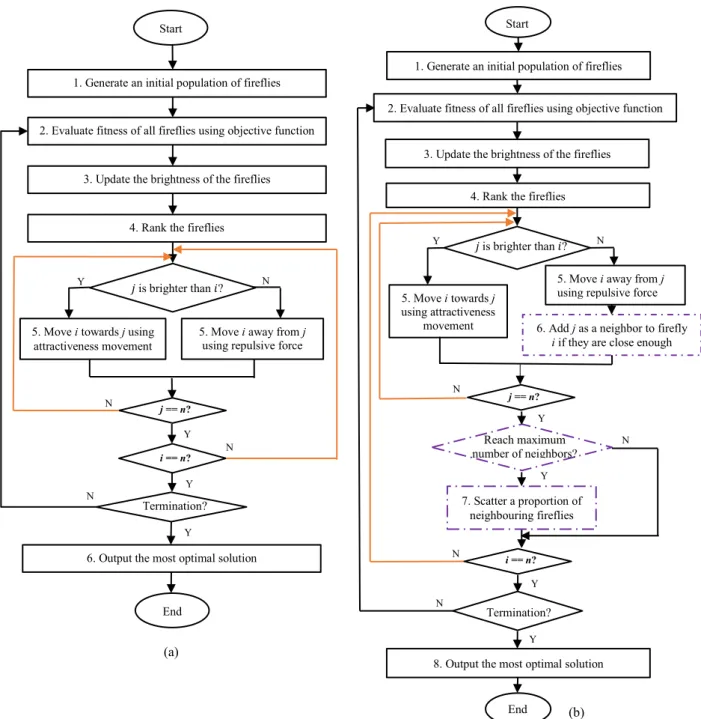
Figure 1 Flowcharts of the proposed two FA variants, i.e. (a) RFA and (b) SRFA
In comparison with the attractiveness behaviour in Equation (3), the repulsive movement enables the current brighter fireflies to move to the opposite direction of those with less brightness. The repulsive force parameter, 𝑟𝑓, determines the impact of the repulsive force for position updating of the current firefly i. In other words, it determines the fraction of repulsive force to be applied for fine-tuning the repulsive movement.
Figure 1 (a) shows a flowchart of the proposed RFA and SRFA variants. The key steps of RFA are as follows. An initial population of fireflies is generated by randomly distributing the fireflies in the search space. Then, each firefly is evaluated using the objective (fitness) function formulated with respect to the problem domain. Next, the fireflies are ranked based on their fitness values and the number of neighbours of each firefly is calculated based on a neighbour distance threshold (𝐷𝑇). Subsequently, the attractiveness and
End Start
8. Output the most optimal solution Termination? Y N Reach maximum number of neighbors? reached? 7. Scatter a proportion of neighbouring fireflies
6. Add j as a neighbor to firefly
i if they are close enough 5. Move i towards j
using attractiveness movement
Y
5. Move i away from j
using repulsive force action
N 𝑗is brighter than 𝑖?
Start
1. Generate an initial population of fireflies 2. Evaluate fitness of all fireflies using objective function
3. Update the brightness of the fireflies 4. Rank the fireflies
i == n? j == n? Y N Y N N Y (b)
repulsive force movements are used alternatively to move fireflies towards optimal search regions. The attractiveness or repulsive movement is applied based on whether the neighbouring firefly j has higher or lower degree of brightness than that of the current firefly i, respectively. If firefly j has better fitness than firefly i, firefly i moves towards firefly j based on the attractive movement as defined in the original FA model. Otherwise, if firefly j has less fitness than firefly i, firefly i is pushed away from j byemploying the repulsive force movement defined in Equation (4). A repulsive immune threshold, 𝑟𝑡, is also employed to ensure a certain portion (i.e., 10% of the population in this research) of top ranked fireflies are kept unaffected by the repulsive force movement. The immune threshold ensures that certain top ranking fireflies are not pushed away from their optimal positions, in an attempt to balance between convergence speed and search diversity. Overall, in comparison with the original FA model where the brighter firefly only performs random movement, RFA enables the brighter firefly not only performs random walk, but also carries out the repulsive force action to avoid unpromising search regions and achieve fast convergence.
Another FA variant, SRFA, is also proposed in this research. SRFA incorporates both the repulsive force movement and a scattering mechanism to overcome premature convergence of the original FA model. The scattering mechanism diverts a proportion of weak neighbouring solutions randomly to other distinctive search spaces, therefore increasing search diversity. As shown in Figure 1 (b), extra steps are dedicated to SRFA for performing the scattering movement (marked with dotted squares). The pseudo-code of SRFA, which includes both the repulsive force and the scattering actions, is provided in Algorithm 2.
In SRFA, the neighbouring distance threshold, 𝐷𝑇, is used to set the maximum distance between two fireflies to be considered as neighbours. After employing the repulsive force action to move a brighter firefly, i, away from the less optimal solution, j, the neighbouring distance threshold is used to determine if the weak firefly j
is a neighbour of firefly i. If it is, the neighbour counter of firefly i is incremented by one. In this way, the weak solutions in the neighbourhood of the current promising solution i, can be identified. In order to balance between search diversity and convergence speed, some neighbours (i.e. 50% in this research) of firefly i are preserved while others are scattered away to new search regions. As such, a threshold for the maximum permissible number of neighbours, 𝑛𝑡, is used for firefly i. If the neighbour number exceeds the 𝑛𝑡 percentage of the population, SRFA scatters extra neighbours randomly to other rarely explored search regions, in order to increase exploration. As a result, the scattering mechanism keeps a maximum 𝑛𝑡 percentage of the population as the neighbours for a promising firefly i and scatters extra neighbouring fireflies away to increase search diversity. This random scatter behaviour is defined in Equation (5).
𝑥𝑘𝑑= 𝐿𝑑𝑏+𝜇 ×(𝑈𝑏𝑑− 𝐿𝑑𝑏) (5)
where 𝜇 is a randomly generated vector with each element in the range of [0, 1]. 𝐿𝑑𝑏 and 𝑈𝑏𝑑represent the lower and upper bounds in the d-th dimension, respectively, while 𝑥𝑘𝑑 denotes the position of firefly k in the
d-th dimension.
The repulsive force action and the scattering behaviour embedded in SRFA work cooperatively to overcome local optima. If the repulsive force action is unable to find a fitter offspring, the scattering behaviour is able to discover other distinctive regions to widen the search region and avoid local optima. On the other hand, if the random scattering behaviour is not able to identify more optimal search regions, the repulsive force action enables the brighter fireflies to perform long jumps and move towards more promising search regions, in order to overcome premature convergence and achieve global optimality.
Algorithm 2: Pseudo-Code of the Scattering Repulsive Firefly Algorithm (SRFA) Initialization
Objective function: f(X), X=(x1, x2, x3, x4, … xd);
Generate an initial population of fireflies Xi (i=1, 2, 3, …, n); Formulate light intensity I so that it is associated with f(X); Define absorption coefficient γ;
Initialize thresholds as follows;
Default Thresholds
1) Repulsive Force Factor 𝑟𝑓=0.6; //1/2 (default)
2) Repulsive Immune Threshold 𝑟𝑡= 0.1; //10% of the population (default) 3) Neighbour Distance Threshold
𝐷𝑇 = 𝑑𝑡 × √(𝑈𝑏− 𝐿𝑏)2 × 𝐷, where 𝑑𝑡 = 0.2;
//20% of root square differences in each dimension, where Uband Lb represent upper and lower bounds
for each dimension respectively with D denoting the problem dimensions.
4) Neighbour Number Threshold 𝑛𝑡 = 0.5; //50% of the population (default)
1 Start 2 t = 0;
3 While (t < Max_Generation) {
4 S= Zeros(n);
//S is the array containing scattering flags for each firefly, which are initialized as ‘0’. Sirepresents the scattering flag for firefly i.
5 Vary attractiveness with distance r via exp(-γr2);
6 Evaluate light intensities of the population;
7 Rank the fireflies;
8 Fori = 1 to n (all n fireflies) {
9 bi = 0; //Number of neighbours initialized as 0 for firefly i
10 Forj = 1 to n (all n fireflies) {
11 If (Sj = =1) { //Skip if the firefly is marked for scattering
12 Continue; //Go back to line 10 and increase j by 1.
13 }End If
14 Calculate distance (r) between firefly i and firefly j;
15 If (Ij> Ii){ //Firefly j is brighter than firefly i
16 Move firefly i towards j using Equation (3);
17 }Else If (i > 𝑟𝑡× 𝑛){ //Repulsive immune threshold – 10% of the population by default
18 Move firefly i away from firefly j using Equation (4);
19 If (r < 𝐷𝑇) { //Less than the neighbour distance threshold, 𝐷𝑇
20 bi = bi + 1; //Increase the neighbour counting
21 add j to NA; //neighbouring fireflies NA is the array containing the indices of
22 }End If
23 }End If 24 }End For j
25 If (bi > (𝑛𝑡 × 𝑛)) { //neighbour number threshold, Start of the scattering part (more than the 𝑛𝑡 × 𝑛)
26 Fork = (𝑛𝑡 × 𝑛) to bi {
27 SNA[k] = 1;
28 Scatter firefly NA[k] using Equation (5); //Scatter the kth firefly in NA
29 }End For k 30 }End If
31 Clear NA; //End of the scattering part
32 }End For i 33 t = t + 1;
34 Rank all the fireflies and find the current global best;
35 }End While
36 Output the most optimal solution;
37 End
3.2 The Proposed ESRFA Model
An enhanced SRFA model, i.e. ESRFA, is also proposed in this research. ESRFA integrates both hovering/exploitation-driven attractiveness and exploration-driven escaping mechanisms, as well as interaction with historical best experiences of neighbouring fireflies to overcome premature convergence. We introduce each key proposed mechanism in detail, as follows.
Firstly, we identify several aspects to further improve the abovementioned SRFA model. As an example, SRFA employs the attractiveness action of the original FA model shown in Equation (3) to guide the fireflies with lower light intensities to move towards brighter ones. When the distance between two fireflies are close, 𝑒−𝛾𝑟𝑖𝑗2 → 1, and based on Equation (3), the movement towards the brighter firefly is more likely to take a comparatively larger step. In order to enable fine-tuning the movement towards the neighbouring promising solution, we propose a new attractiveness operation by incorporating an exploitation factor. Such a
fine-tuned movement enables a granular random examination of the neighbourhood around a promising solution to avoid local optima traps. Equations (6)-(8) define the updated attractiveness operation.
𝑥𝑖𝑡+1= 𝑥𝑖𝑡+ (𝛽 × ℎ)(𝑥𝑗𝑡− 𝑥𝑖𝑡) + 𝛼𝑡𝜀𝑡 (6) ℎ = sin(sin(𝑟𝑎𝑛𝑑2)) (7)
𝛽 = (1 − 𝛽𝑚𝑖𝑛) × 𝑒−𝛾𝑟𝑖𝑗 2
+ 𝛽𝑚𝑖𝑛 (8) where ℎ and 𝛽 denote the exploitation and attractiveness coefficients, respectively. Equation (7) defines the proposed exploitation factor ℎ, while Equation (8) represents the updated attractiveness coefficient 𝛽, with 𝛽𝑚𝑖𝑛 = 0.2, according to Yang [1, 15].
The exploitation factor is incorporated with the attractiveness coefficient to implement fine-tuning. Such an exploitation factor simulates the hovering behaviour of hawk-moths around attraction (e.g. lights) or food (e.g. flower). Owing to the efficiency in employing standard sine and cosine functions (i.e. sin(2𝜋 × 𝑟𝑎𝑛𝑑) or cos(2𝜋 × 𝑟𝑎𝑛𝑑)) to explore the search space [62], we consider variations of such functions for the implementation of the exploitation coefficient. Since we aim to implement both refined and erratic examination of optimal neighbourhoods to simulate the hovering actions of moths, Equation (7) that represents an irregular and subtle movement is proposed.
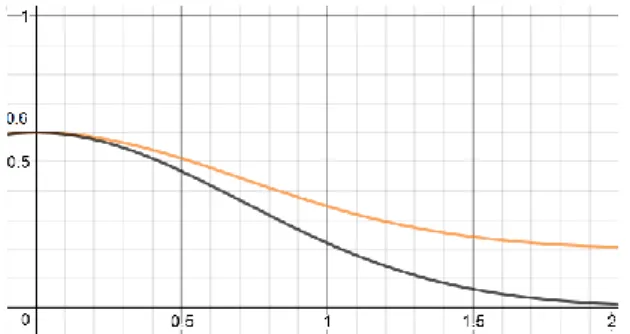
Figure 2 illustrates the exploitation flight/path (the orange line) generated by Equation (7) using sin(sin(𝑟𝑎𝑛𝑑2)) and a reference path (the black line) produced by a standard sin(𝑟𝑎𝑛𝑑) function. As shown in Figure 2, Equation (7) yields a refined search step (as indicated by the orange line) than that generated using the standard sin(𝑟𝑎𝑛𝑑) function (as indicated by the black line). Therefore, the former produces a granular step as the exploitation factor to enable more detailed examination of a promising neighbourhood in comparison to that generated by a standard sine function. Moreover, the proposed sin(sin(𝑟𝑎𝑛𝑑2)) function in Equation (7) denotes comparatively more irregular/erratic wave-like patterns than those generated by the standard sine function, which represent regular waveforms. Therefore, Equation (7) is selected as an attempt to simulate the rapid swing-hovering behaviours of hawk-moths to implement the local exploitation factor.
Figure 2 The exploitation path generated by Equation (7) (orange line) and the reference path generated by a standard sin(𝑟𝑎𝑛𝑑) function (black line)
As shown in Figure 2, for a randomly selected value between (0, 1), it produces an exploitation coefficient in the range of (0, sin(sin(1))). Since multiplying this exploitation factor with the attractiveness coefficient tunes down the movement step, it enables a random examination with different degrees of granularity pertaining to the local neighbourhood of promising firefly 𝑗 to achieve fine-tuning.
Besides the attractiveness operation, we further improve the proposed repulsive force action in SRFA by incorporating an escaping coefficient to increase global exploration. It simulates the anti-predator behaviour of moths which take a sharp dive or fall in response to the sonar clicks of bats to explore a wider search space. Equations (9)-(10) define the newly updated repulsive force action. It employs a comparatively larger repulsive factor to conduct a wider global exploration in comparison with that of the repulsive action defined in Equation (4).
𝑥𝑖𝑡+1= 𝑥𝑖𝑡− (𝑥𝑗𝑡− 𝑥𝑖𝑡) × 𝜃 − 𝛼𝑡𝜀𝑡 (9)
𝜃 = (𝑟𝑓− 𝜃𝑚𝑖𝑛) × 𝑒−𝛾𝑟𝑖𝑗 2
where 𝜃 indicates an escaping coefficient defined in Equation (10). The repulsive force factor 𝑟𝑓 is set to 0.6 according to our experimental studies (see Section 4) with 𝜃𝑚𝑖𝑛= 0.2 based on empirical experiments. In comparison with the repulsive factor of SRFA, 𝑒−𝛾𝑟𝑖𝑗2× 𝑟
𝑓, employed in Equation (4), the escaping coefficient 𝜃 defined in Equation (10) generates a comparatively stronger repulsive impact. As shown in Figure 3, the orange line indicates the coefficients generated by Equation (10) while the black line shows the factors generated by 𝑒−𝛾𝑟𝑖𝑗2 × 𝑟𝑓 in Equation (4). It enables the repulsive action defined in Equation (9) to perform a larger movement away from less optimal regions. Therefore, the evading operation defined in Equation (9) explores a wider search space in comparison with the SRFA movement denoted by Equation (4). Overall, the updated repulsive operation enhances global exploration to avoid stagnation. In other words, the proposed attractiveness and evading operations increase local exploitation and global exploration, respectively, and cooperate with each other to attain global optima.
Figure 3 The escaping coefficients generated using Equation (10) (orange line) and the formula, 𝑒−𝛾𝑟𝑖𝑗2 × 𝑟 𝑓, used in Equation (4) (black line), respectively
Besides the proposed attractiveness and repulsive actions, the search process is further improved by taking the historical best personal experience of each neighbouring firefly into account. The detailed operation is defined in Equations (11)-(12). 𝑥𝑖𝑡+1= 𝑥𝑖𝑡+ (𝑝𝐵𝑒𝑠𝑡𝑗− 𝑥𝑖𝑡) × 𝛽𝑝 (11) 𝛽𝑝= 𝛽 0𝑒 −𝛾𝑟𝑖𝑝𝐵𝑒𝑠𝑡𝑗2 × (𝑓𝑖𝑡𝑛𝑒𝑠𝑠𝑖− 𝑓𝑖𝑡𝑛𝑒𝑠𝑠𝑝𝐵𝑒𝑠𝑡𝑗) (𝑓𝑖𝑡𝑛𝑒𝑠𝑠⁄ 𝑚𝑎𝑥− 𝑓𝑖𝑡𝑛𝑒𝑠𝑠𝑚𝑖𝑛) (12) where 𝑝𝐵𝑒𝑠𝑡𝑗 represents the historical personal best experience of neighbouring firefly 𝑗. 𝛽𝑝 denotes the neighbouring historical attractiveness coefficient, as defined in Equation (12). The distance parameter r in Equation (12) is calculated using the distance between the current solution 𝑖 and the historical best personal experience of the neighbouring firefly 𝑗. Moreover, as indicated in Equation (12), the fitness score difference between the current firefly and the best experience of neighbouring firefly 𝑗 is used for determining 𝛽𝑝, whereby 𝑓𝑖𝑡𝑛𝑒𝑠𝑠𝑖 and 𝑓𝑖𝑡𝑛𝑒𝑠𝑠𝑝𝐵𝑒𝑠𝑡𝑗 denote the fitness scores of the current firefly 𝑖, and the historical best experience of firefly 𝑗, respectively, with 𝑓𝑖𝑡𝑛𝑒𝑠𝑠𝑚𝑎𝑥 and 𝑓𝑖𝑡𝑛𝑒𝑠𝑠𝑚𝑖𝑛 representing the maximum and minimum fitness scores of the current iteration. This operation is activated when the current firefly has a lower fitness score than that of the personal best of neighbouring firefly 𝑗. In this way, the historical best experiences of all neighbouring individuals are used to accelerate convergence. Moreover, note the movement step is adjusted not only by the distance between two fireflies but also by the difference of their fitness/brightness. The scatting action of SRFA is also embedded in ESRFA to divert a proportion of weak neighbouring solutions of firefly 𝑖 to an unexploited distinctive search space to increase search diversity. Algorithm 3 shows the detailed pseudo-code of the proposed ESRFA model. Overall, the three proposed strategies diversify the search process by embedding hawk-moth motivated exploitation and exploration coefficients, as well as learning from neighbouring historical best experiences. We evaluate the proposed ESRFA, SRFA and RFA models using diverse challenging optimization problems, as follows.
Algorithm 3: Pseudo-Code of the Proposed ESRFA Model
1. Start
2. Initialize a population of fireflies randomly;
4. Set light intensity 𝐼 = 𝑓(𝑥) and light absorption coefficient 𝛾; 5. Initialize all thresholds dedicated to SRFA;
6. While (stopping criterion is not satisfied)// until it finds the optimal solution or the maximum number of iterations is met.
7. {
8. Fori = 1 to ndo//for all fireflies
9. {
10. Forj = 1 to ndo //for all fireflies
11. {
12. If (j is marked for scattering)
13. Continue; //Skip if the firefly is marked for scattering 14. End If
15. If (𝐼𝑗> 𝐼𝑖)
16. Move firefly i towards firefly j using Equation (6); 17. Else If (i > 𝑟𝑡× 𝑛)
18. Move firefly i away from firefly j using Equation (9); 19. End If
20. If personal best experience of j, 𝑝𝐵𝑒𝑠𝑡𝑗, is better than i,
21. Move firefly i towards 𝑝𝐵𝑒𝑠𝑡𝑗 using Equation (11); 22. End If
23. Increase the neighbour counting; 24. } End For j
25. Scatter if more neighbours than the allowed threshold; 26. } End For i
27. Rank the fireflies and find the current global best, 𝑔𝑏𝑒𝑠𝑡; 28. }End While
29. Output the most optimal solution, 𝑔𝑏𝑒𝑠𝑡; 30. End
4.
EVALUATION
A comprehensive evaluation has been conducted to evaluate RFA, SRFA and ESRFA models. To indicate efficiency of the proposed models, several FA variants proposed in recent years, i.e. ODFA [3], SFA [34], LSFA [34], and CFA [35] and other metaheuristic search methods, i.e. PSO, SA, FA, BSO, CSO, DFO and ALO, have been implemented for comparison. All algorithms are implemented using MATLAB R2016b. Details of the experimental study are as follows.
4.1 Experimental Setup
We use ten standard benchmark optimization functions to evaluate and compare our proposed models with state-of-the-art FA variants and conventional methods. These benchmark functions have been widely used for evaluation of swarm-based optimization algorithms [3, 11, 12, 30, 48]. We list these standard benchmark functions in Table 1, which include various physical properties and shapes. Artificial landscapes 1, 3, 4 and 5 contain many local minima; artificial landscapes 6, 8, and 9 are bowl-shaped functions; landscapes 2 and 7 are valley-shaped functions, while function 10 as a plate-shaped function. These artificial landscapes also represent different optimization problems including multimodal (1, 3, 4, and 5) and unimodal (2, 6, 7, 8, 9, and 10) problems.
In addition, challenging CEC2014 benchmark functions [5] have been employed for evaluation. This CEC test suite includes 30 test functions with 3 rotated unimodal, 13 shifted and rotated multimodal, 6 hybrid, and 8 composition functions. These test functions represent challenging real-parameter optimization problems. We use these shifted, rotated, hybrid and composition benchmark functions from CEC2014 test suite to further evaluate the proposed models and compare the results with those from other methods.
The following settings of the proposed models and other methods are used for evaluation of standard and CEC2014 test functions. These default settings are based on empirical studies and related publications in the literature [1, 3, 6, 7, 8, 10, 11, 12, 15, 28, 34, 35, 49, and 60], which yield the best trade-off between model performance and computational efficiency for diverse general optimization problems. As an example, we apply the following default settings of FA, i.e. initial attractiveness=1.0, randomization parameter=0.25, and absorption coefficient=1.0. These settings have been applied to the proposed models and other FA variants (i.e., ODFA [3], LSFA [34], SFA [34] and CFA [35]). SA applies the following settings [1], i.e. the initial temperature=1.0, cooling factor=0.95 with the final stopping temperature=1e-10. These settings of FA and SA have been applied to SFA [34] and LSFA [34]. Based on empirical studies [1], the discovery probability
of CSO is set to 0.25, while the PSO parameters are, maximum velocity=0.6, inertia weight=0.78, and acceleration constants=1.2. The weights of the five social behaviours pertaining to dragonflies in DFO are, separation weight=0.1, alignment weight=0.1, cohesion weight=0.7, food factor=1, and enemy factor=1. Moreover, the initial inertia weight in DFO is set to 0.9, which decreases according to the number of iterations. Finally, BSO employs the following settings, i.e. loudness=0.5 and pulse rate=0.5. ALO does not require any operation parameters. In the experiments, we have used the following default settings for our models, i.e. repulsive force factor, 𝑟𝑓=0.6, repulsive immune threshold, 𝑟𝑡=0.1, and neighbour number threshold, 𝑛𝑡 = 0.5. Table 2 shows the parameter settings for all the employed methods. We apply the maximum iterations of 500, the population size in the range of [10, 100], and the dimension of 2𝑖, where i=1 to 8, for all methods to evaluate their efficiency using the abovementioned ten standard benchmark functions.
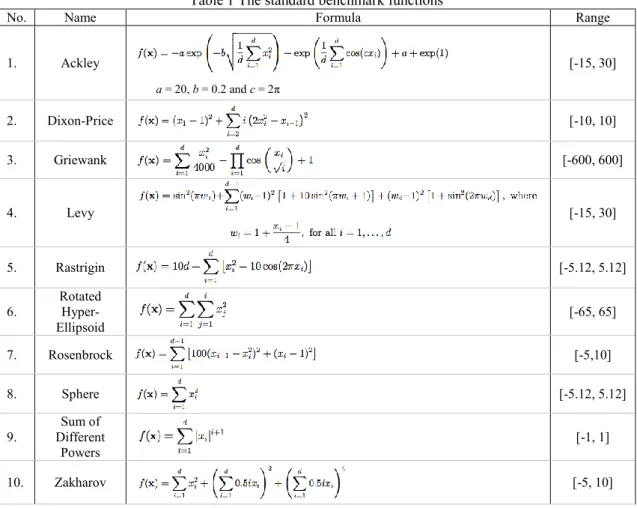
Table 1 The standard benchmark functions
No. Name Formula Range
1. Ackley a = 20, b = 0.2 and c = 2π [-15, 30] 2. Dixon-Price [-10, 10] 3. Griewank [-600, 600] 4. Levy [-15, 30] 5. Rastrigin [-5.12, 5.12] 6. Rotated Hyper-Ellipsoid [-65, 65] 7. Rosenbrock [-5,10] 8. Sphere [-5.12, 5.12] 9. Sum of Different Powers [-1, 1] 10. Zakharov [-5, 10]
Table 2 Summary of parameter settings for different optimization algorithms
Methods Parameter settings
SA Initial temperature = 1.0, Cooling factor = 0.95, Stopping temperature = 1e-10
CSO Discovery probability = 0.25
PSO Maximum velocity = 0.6, Inertia weight = 0.78, Acceleration constants = 1.2
DFO Separation weight = 0.1, Alignment weight = 0.1, Cohesion weight = 0.7, Food factor = 1, Enemy factor = 1, Initial inertia weight = 0.9
BSO Loudness = 0.5, Pulse rate = 0.5
LSFA [34], SFA [34] FA – Attractiveness = 1.0, Randomization parameter = 0.25, Absorption coefficient =1.0 SA – Initial temperature = 1.0, Cooling factor = 0.95, Stopping temperature = 1e-10
FA, ODFA [3], CFA [35]
Attractiveness = 1.0, Randomization parameter = 0.25, Absorption coefficient =1.0
RFA, SRFA, ESRFA
Attractiveness = 1.0, Randomization parameter = 0.25, Absorption coefficient =1.0 Repulsive force factor = 0.6, Repulsive immune threshold = 0.1, Neighbour number threshold = 0.5 (for SRFA and ESRFA).
4.2 Evaluation Results
We conduct several experiments to compare the proposed models with advanced FA variants and other metaheuristic search methods. The first experiment focuses on the convergence speed among different algorithms using the standard benchmark functions in Table 1. We then conduct performance comparison among different algorithms by increasing the dimension exponentially while maintaining a fixed size of population and the number of iterations. Experiments have been conducted by increasing the population size with an incremental step of 10 while maintaining a fixed size of dimension and the number of iterations. Finally, we use the standard benchmark functions with fixed high dimensional experimental settings for performance comparison. The CEC2014 benchmark functions have also been employed to further demonstrate the efficiency of the proposed models. The comparison between the proposed models and an exact algorithm is also conducted for solving the Traveling Salesman Problem (TSP).
4.2.1 Performance Comparison of Different Parameter Settings
To measure the impact of different parameter settings on the performances of SRFA, a series of experiments has been conducted using diverse settings of the following key optimization parameters, i.e. repulsive force factor 𝑟𝑓, repulsive immune threshold, 𝑟𝑡, neighbour number threshold, 𝑛𝑡, and neighbour distance threshold,
DT. The standard benchmark functions shown in Table 1 are evaluated with 30 test runs to generate the results using each parameter setting. The average results of all ten test functions pertaining to 𝑟𝑓 and 𝑟𝑡 are shown in Figure 4.
As indicated in Figure 4, for each test function, we conduct 30 runs using each parameter setting in the range of [0, 1] with an incremental step of 0.1 for both 𝑟𝑓 and 𝑟𝑡. The gradual increase of the repulsive force factor,
𝑟𝑓, indicates that the repulsive force action has more and more impact on the search process. Figure 4 (a) indicates that SRFA is able to achieve optimal performances when𝑟𝑓 is in the range of [0.1, 0.9]. Therefore, 0.6 is selected as the default setting for the proposed RFA, SRFA and ESRFA models in our experiments. On the other hand, the increase of the repulsive immune threshold, 𝑟𝑡, indicates that more and more proportions of the population are eliminated from the repulsive behaviour, and the proposed models are more and more likely to behave like the original FA model. Figure 4 (b) indicates that SRFA achieves better performances when 𝑟𝑡 is in the range of [0, 0.7]. Therefore, we use the setting of 𝑟𝑡= 0.1, i.e. 10% of the population, in SRFA. This indicates that 10% of the top solutions are unaffected by the repulsive strategies, and remain at the original optimal positions to enable fast convergence.
(a) (b)
Figure 4 The evalution results of SRFA along with the increase of repulsive force factor 𝑟𝑓 (a) and repulsive immune threshold 𝑟𝑡 (b), respectively (with fixed settings for other optimization parameters)
As discussed earlier, the neighbour number threshold 𝑛𝑡 is used to determine the maximum number of neighbours to keep for a promising firefly, i. If the neighbour number exceeds 𝑛𝑡 (in percentage), SRFA scatters any extra neighbours randomly to other rarely explored search regions to increase exploration. In SRFA, 𝑛𝑡 is used as the criterion to activate the scattering behaviour. A smaller 𝑛𝑡 is more likely to activate the scattering behaviour while a larger value becomes less likely to activate the corresponding action. Figure 5 (a) shows the mean global minima of 30 runs along with 𝑛𝑡 with an increment step of 10% for evaluation of all standard benchmark functions. SRFA achieves the best performances with 𝑛𝑡 in the range of [0.5, 0.9]. Therefore, we employ a balanced threshold, i.e. 𝑛𝑡 = 0.5, for activation of the scattering behaviour in SRFA, in order to achieve the best trade-off between swarm diversity and convergence speed.
(a) (b)
Figure 5 The evaluation results of SRFA along with the increase of (a) neighbour number threshold 𝑛𝑡 and (b) 𝑑𝑡 as the key parameter in the neighbour distance threshold, respectively (with fixed settings for other
optimization parameters)
The neighbour distance threshold, DT, employs a 𝑑𝑡 proportion of the root square differences between the lower and upper boundaries in each dimension for identifying the neighbouring fireflies. A larger 𝑑𝑡 imposes a comparatively larger search space as the neighbourhood, therefore it is more likely to gain a large number of neighbours to activate the scattering behaviour to increase search diversity. On the contrary, a smaller 𝑑𝑡 contributes a smaller neighbourhood with fewer fireflies as neighbours, therefore the scattering behaviour is less likely to be activated, which may lead to premature convergence. The evaluation results of increasing 𝑛𝑡 in the range of [0, 1] are shown in Figure 5 (b). The average of the mean global minima for the evaluation of all the test functions with 30 runs for each parameter setting is used to generate the plot. As illustrated in Figure 5 (b), SRFA achieves the best performances with 𝑑𝑡 in the range of [0.2, 0.4]. Therefore, we employs 𝑑𝑡=0.2, i.e. 20% of root square differences in each dimension, as the criterion for identification of neighbours in SRFA.
Based on the above experimental observations, we set the key parameters of SRFA as follows: 𝑟𝑓 = 0.6,𝑟𝑡 = 0.1, 𝑛𝑡 = 0.5 and 𝑑𝑡 = 0.2, in all subsequent experiments. These optimal settings are also employed in ESRFA.
4.2.2 Convergence Comparison
In this experiment, we compare the convergence performance of RFA SRFA and ESRFA with FA variants and other swarm-based methods using the ten standard benchmark functions shown in Table 1.
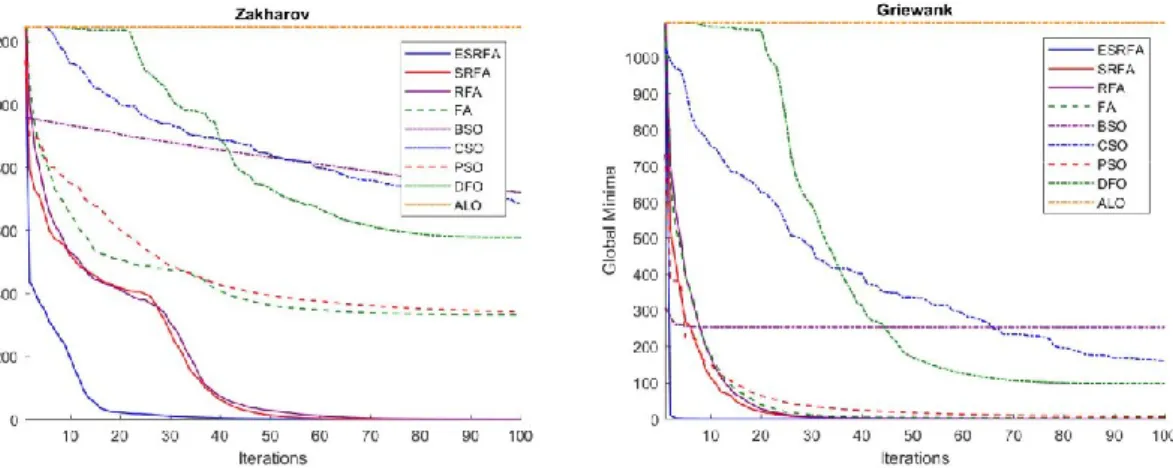
Figure 6 Convergence curves of the proposed models and other relevant methods for the Levy, Rastrigin, Zakharov, and Griewank functions
Figure 7 Convergence curves of the proposed models and other advanced FA variants for the Levy, Rastrigin, Zakharov, and Griewank functions
We keep the population size, dimension, and the number of iterations fixed, i.e. the population size=40, dimension=50 and the number of iterations=100, in this experiment. Note that other population and dimension settings have also been employed, which achieve similar convergence performances. The convergence curves over 30 runs for four standard functions (i.e. Levy, Rastrigin, Zakharov and Griewank) are shown in Figure 6. The results of SA are not included, since it takes a larger number of iterations to converge, and extends beyond the range of the plots in Figure 6 for most cases. Overall, ESRFA, SRFA and RFA achieve the best convergence for four functions of artificial landscapes in most cases.
We have compared RFA, SRFA and ESRFA with other state-of-the-art FA variants. Figure 7 shows the convergence curves of 30 runs using the Levy, Rastrigin, Zakharov, and Griewank functions. Our proposed models incorporate diverse attractiveness, repulsive and scattering behaviours to accelerate the search process and achieve fast convergence, in comparison with other FA variants. Since ODFA employs a dimensional-based approach for updating the global best solution in each dimension and LSFA embeds SA to further improve the global best solution in each iteration, both models have a high computational cost and require a large number of iterations to converge. A similar observation can be obtained for other test functions, as shown in Figure 7.
As indicated in Figures 6-7, the three proposed models show significant convergence improvements against other methods owing to the proposed attractiveness, repulsive force and scattering strategies. In RFA, the repulsive force strategy enables brighter fireflies in the neighbourhood to reach optimal regions in fewer iterations in comparison with those in the original FA model. SRFA shows a slight convergence improvement in most cases in comparison with RFA, owing to the scattering mechanism, which diverts a small portion of population congested in a converging location to a random search space to overcome stagnation. ESRFA outperforms SRFA, RFA and state-of-the-art FA variants for all test functions, owing to the proposed exploitation and exploration search mechanisms and the interaction with the neighbouring historical best experiences.
4.2.3 Diverse Dimensions
In the second experiment, we compare different methods by increasing the dimension exponentially, i.e. 2𝑖where i=1 to 8, while fixing the population size to 30 individuals and the number of iterations to 100. Specifically, a total of 30 runs are conducted using the standard benchmark functions in Table 1, with the dimension increasing from 2 to 256.
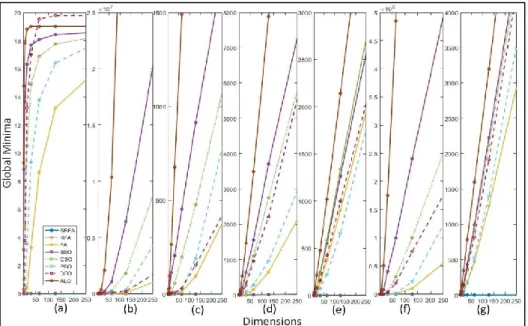
Figures 8 and 9 show the mean minima of different search methods and FA variants, respectively, in comparison with SRFA and RFA. As shown in Figure 8, the final outcomes of all other search methods tend to drift further away from the global minima (i.e. zero) with increasing dimension of the test function. As the dimension increases, it becomes more challenging for the compared search methods to find the global optima, and their performances deteriorate drastically. However, increasing the dimension has little impact on the final outcomes of RFA and SRFA, as shown in Figure 8. A similar observation is also depicted in Figure 9. All other FA variants (i.e. CFA [35], LSFA [34], ODFA [3] and SFA [34]) tend to be affected significantly by the increase of dimension, whereas RFA and SRFA show great flexibility and outperform other FA variants. The RFA and SRFA results are very close to the global minima, which nearly overlap with the x axis for all experiments. A similar observation applies to ESRFA, in which its results nearly overlap with the x axis for all the test functions. ESRFA also outperforms SRFA and RFA for all the test cases.
Figure 8 The global minima results for the proposed RFA and SRFA models and other methods subject to an increment of dimension. The x axis indicates the exponential increase of dimension, i.e., 2𝑖 (i=1 to 8), while
the y axis shows the global minima of (a) Ackley, (b) Dixon-Price, (c) Griewank, (d) Levy, (e) Rosenbrock, (f) Rastrigin and (g) Zakharov, respectively
Figure 9 The global minima results for the proposed RFA and SRFA models and other FA variants subject to an increment of dimension. The x axis indicates the exponential increase of dimension, i.e., 2𝑖 (i=1 to 8),
while the y axis shows the global minima of (a) Dixon-Price, (b) Griewank, (c) Levy, (d) Rastrigin, (e) Rosenbrock, and (f) Zakharov, respectively
(a) (b)
(c)
(e)
(d)
Figure 10 The global minima results for the proposed RFA, SRFA and ESRFA models subject to an increment of dimension. The x axis indicates the exponential increase in dimension, i.e., 2𝑖 (i=1 to 8), and the
y axis shows the global minima of Dixon-Price, Rastrigin, Rosenbrock, and Zakharov, respectively Figure 10 illustrates the performance comparison between the proposed ESRFA, SRFA and RFA models subject to the increment of dimension. To better present the results of the proposed models with respect to the test function dimension, the results are plotted by scaling the y axis. Specifically, owing to the cooperation between the attractiveness, repulsive force and the scattering movements, ESRFA and SRFA show a better capability of escaping from local optima in comparison with RFA, therefore yielding the best global minima. Furthermore, because of the embedded exploitation and exploration mechanisms, ESRFA outperforms SRFA for most test cases in all dimensional settings.
4.2.4 Population Size
We have evaluated all methods with diverse population settings subject to a fixed problem dimension of 20 over 30 test runs. Figures 11 and 12 indicate the mean global minima for the standard test functions with the population size ranging from 10 to 100, for SRFA and RFA in comparison with state-of-the-art FA variants and other related methods, respectively.
Figure 11 The global minima results for the proposed RFA and SRFA models and other methods subject to increasing population size of (a) Ackley, (b) Griewank, (c) Levy, (d) Rastrigin, (e) Sphere and (f) Rotated
Hyper-Ellipsoid, respectively
As shown in Figures 11-12, increasing the population size from 10 to 100 improves the performances of most of the search methods and FA variants, owing to the increase of swarm diversity. On the contrary, the increase of the population size shows very little impact on the performances of RFA and SRFA, whose results remain very close to global minima (i.e. 0), and outperform those of all other methods and FA variants. Moreover, as indicated in the scale-up comparison among ESRFA, SRFA and RFA in Figure 13, the increase of the population size shows very little impact on the ESRFA performances as well, in which the results remain very close to global minima. Obviously, ESRFA outperforms SRFA and RFA. A similar observation can also be obtained for other standard test functions.
Figure 12 The global minima results for the proposed RFA and SRFA models and other FA variants subject to increasing population size of (a) Ackley, (b) Dixon-Price, (c) Griewank, (d) Levy, (e) Rastrigin, and (f)
Rosenbrock, respectively
Figure 13 The global minima results for the proposed RFA, SRFA and ESRFA models subject to increasing population size of Griewank and Rosenbrock, respectively
4.2.5 Evaluation Using the Standard Benchmark Functions
To further ascertain efficiency of the proposed models, a number of FA variants (ODFA [3], SFA [34], LSFA [34] and CFA [35]) as well as other search methods have been implemented for comparison using ten
(a) (b)
(c) (d)