Symbol key
The CEO speaks 4
Part 1 | Enova’s outlook 5
Green competitiveness 6
Part 2 | Enova’s activities 9
Social responsibility 10
Organization 10
Management 12
Part 3 | Market descriptions 13
Enova – market team player 14
Indicators 14
Renewable heating:
From new establishment to growth 16
Industry and non-industrial plants and facilities: More companies are cooperating with Enova 18 Non-residential buildings:
Energy smart buildings for the future 20
Residential buildings:
From advice to action 22
New energy and climate technology:
An innovation perspective 24
Bioenergy:
Small steps towards a stronger market 26
Part 4 | New energy and climate
technology 27
New technology for the future’s non-residential
buildings 28
2012 and 2013 35
Enova’s main objective 36
Objectives and results of the Energy Fund 38 Management of the Energy Fund’s resources 40
New energy and climate technology 41
Climate reporting 52
In-depth reporting 54
Energy results 54
Funding level 55
Energy results by project category 56
Portfolio composition 58
Activities 62
International 65
Geographical distribution and the largest
projects 67
Tasks outside the Energy Fund 70
Energy Technology Data Exchange (ETDE) 70
Intelligent Energy Europe (IEE) 70
Natural gas 70
Part 6 | Reporting – the Energy Fund
2001-2011 71
Energy results and allocations 2001-2011 72
Climate reporting 78
Appendices 80
Consultation submissions 81
Publications 81
Definitions and explanation of terminology 82
Projects Financing Industry Investigated Graphs/tables Advicing Renewable heating Renewable
New energy and climate technology
Interaction
Non-residential buildings
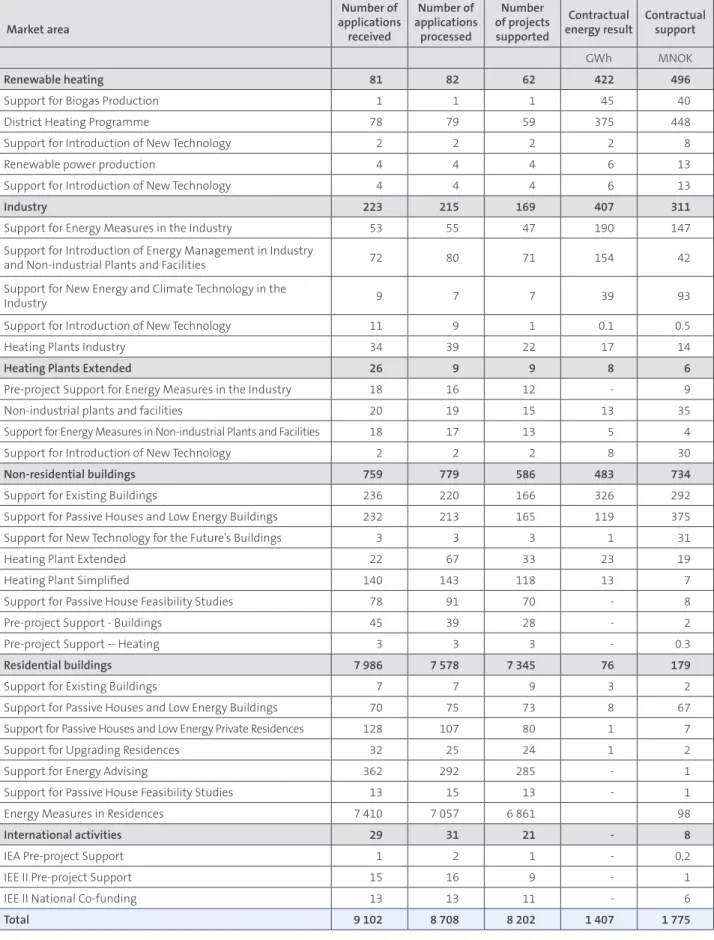
RENEWABLE HEATING Enova will ensure renewable heating becomes the preferred heating method in Norway. Restructuring to renewable heating is an important measure for more climate- friendly use of energy in our country. In 2013, 60 projects were supported by Enova. NEW TECHNOLOGY New technology will solve the future’s energy challenges. Enova supports market introduction of new technology and contributes investment support for market innovators. In 2013, 19 projects received funding commitments from Enova. INDUSTRY Enova will contribute to a more climate-friendly and energy-efficient industry supplied with renewable energy. Enova works continu-ously to increase the pace of restructuring of energy end-use and energy production in the industry. In 2013, 174 projects were supported by Enova. NON-RESIDENTIAL BUILDINGS Enova works to realize maximum energy efficiency potential in buildings. Enova supports market players that want to construct, renovate or operate the energy-efficient buildings of tomorrow. In 2013, 583 projects were supported by Enova RESIDENTIAL BUILDINGS Enova provides advice and support for energy improvements in residential buildings. Support is provided both for constructing new buildings, as well as for upgrading existing residences. In 2013, 484 projects and more than 6800 energy initiatives received funding commitments from RENEWABLE HEATING
30%
RESIDENTIAL BUILDINGS5%
NON-RESIDENTIAL BUILDINGS34%
INDUSTRY AND NON-INDUSTRIAL PLANTS AND FACILITIES30%
RENEWABLE POWER PRODUCTION1%
Key figures 2013
1,4
TWh
In 2013, Enova supported projects with a total energy result of 1.4 TWh through the Energy Fund, distributed over energy efficiency measures, conversion and increased utilization of
renewable energy.
Did you know that… 1.4 TWh corresponds to the energy consumption of every household in
Enova invests in energy
and climate solutions
Never before has interest in implementing projects in collaboration with Enova been greater.
For many, innovation and use of new energy and climate technology is the only natural choice.
It is also the necessary choice to face the challenges posed by greenhouse gas emissions.
NILS KRISTIAN NAKSTAD
Chief Executive Officer
In development
In 2013, Enova launched new programmes and strengthened its own organization. We provide investment support through more than 20 programmes, about half of which are new or were rene-wed in 2013. The organization has been reinforced through stron-ger market orientation and specialization.
Results in 2013
We invested in 1350 new projects in 2013, with an overall energy result of 1.4 TWh. We are eager to see a higher energy result, but are very satisfied with the general activity level and the beginning of the new energy and climate technology focus.
The markets for Norwegian industries have been somewhat chal-lenging and turbulent. Investments in mainland industries are relatively low, which is reflected in our results. One positive feature is a record number of projects from small industrial companies. The results within renewable heating in 2013 were better than anticipated. Investments are particularly high within increasing expansion of existing district heating plants.
The largest result contribution came from non-residential buildings. Rehabilitation of existing buildings yielded the greatest energy results, while new building efforts have lower results and are more expensive.
We are very happy with the development in our programmes for passive houses and low energy buildings; from very few new pas-sive houses being constructed in 2009 to 10 per cent of all non-residential buildings in 2013. The development was so robust that we discontinued support for new passive houses near the end of 2013. We believe the market will continue this development wit-hout our support.
Enova has expanded its programmes for households with support for energy advising and phasing out oil boilers, and launched a new subsidy programme for those utilizing the best solutions in the household market as well.
More projects were cancelled in 2013 than in previous years. The most affected markets were renewable heating and industry. A drop in power prices and turbulent industrial markets may have contributed to this. The largest cancelled project in 2013 came after Sødra Cell Tofte AS’ plant on Tofte was wound up.
The Energy Fund received NOK 1.7 billion and pledged NOK 2.0
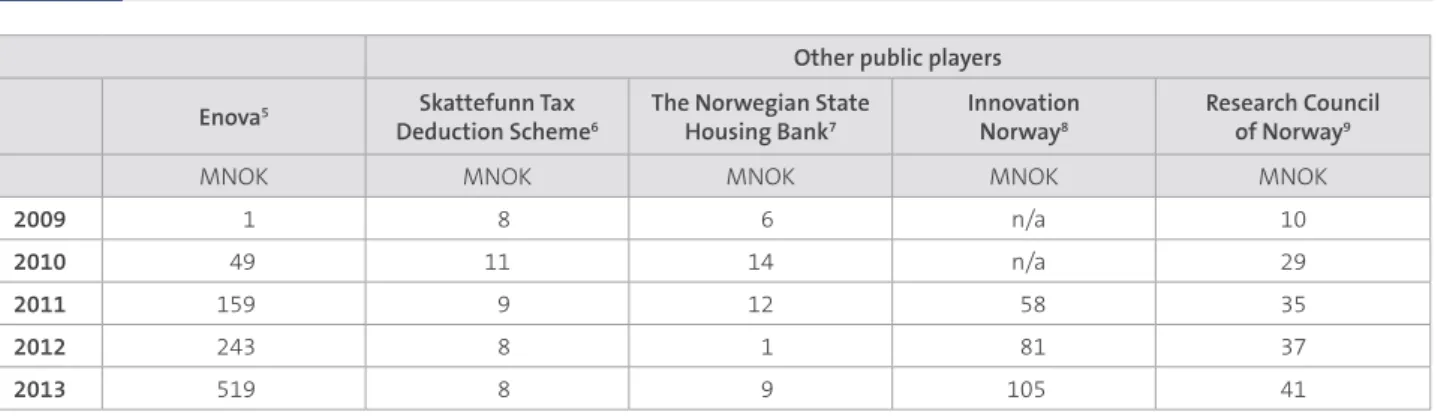
billion in 2013. The new allocations in the Primary Capital Fund (Climate Technology Fund) will not yield income to the Energy Fund until 2014. We advanced the new efforts by investing NOK 93 million in seven energy and climate technology projects in the industry.
Innovation and new technology
A red thread in Enova’s development in 2013 is increased investments in introduction of new technology and innovation. Innovation in the markets consists of new technology, changed behaviour, new knowledge and new business models.
Enova stimulates such innovation, for example through efforts in energy management, energy advising and pre-project support. In technology projects we require the customer to have a business model for the new solutions before we become involved. We strengthened our efforts vis-à-vis the oil and gas industry in 2013. We believe technology and knowledge from oil and gas can be transferred to projects in land-based industries and other areas in society. Enova has experience from such projects and believes this can be applied on a greater scope.
We strengthened follow-up and reporting in the technology pro-jects. We believe there could be many valuable lessons to learn here on technology development and innovation processes, and believe it will provide us with ideas for further development.
Restructuring of energy end-use and energy production, scarcity of resources and greenhouse gas emissions
Our energy system is changing. New production is coming, new distribution is being developed and consumption is changing. A robust supply and efficient energy use are important for continued development of industry and value creation, and to reduce greenhouse gas emissions.
The global challenges associated with scarcity of resources and increasing greenhouse gas emissions are inching steadily closer. Increased renewable energy production and more efficient ener-gy use are an important part of the solution.
In a Norwegian context, we cannot allow a good power balance and an expansive, oil-driven economy to keep us from action. The inter-national markets want more renewable power and products that utilize resources efficiently, and leave a small climate footprint. Enova contributes to green competitiveness.
Part 1
Enova’s outlook
Green competitiveness
6
ADVISING
Enova’s second most important tool is the advice we provide to projects. It is given in a structured manner through our targeted programmes.
FINANCING
Enova’s most important tool is the financing we provide to projects, whether they are major industrial projects, or smaller household measures.
INTERACTION
Enova is a market team player. We contribute knowledge and capital for projects and enable more market players to realize their projects.
6
Green competitiveness
Without new initiatives, in 20 – 25 years, the world will no longer be able to limit global warming to two degrees. Luckily, there are ways to reduce greenhouse gas emissions, and the recipe is quite straightforward. The world needs to use its energy resources more efficiently, and reduce greenhouse gas emissions from energy production and production of goods and services. In the absence of new technology to address this issue, consumption must go down.
Development of new and improved technology for renewable energy production, carbon capture and storage, as well as for efficient energy use, are essential for solving the global challenges, and could also have the added benefit of giving Norway more legs to stand on as revenues from the oil and gas sector start to decline. Norway has the knowledge and means to take a prominent role in the development of the future’s energy solutions. Are we courageous enough to take the challenge? Can we afford not to?
In the 2012 Climate Agreement, Enova was assigned clear
responsibility by the Norwegian Parliamentfor helping develop the future’s energy and climate technology. This responsibility came on top of an already considerable responsibility for efficient energy use and a robust energy supply. Enova plays a key role in delivering the solutions which Norway and the world are requesting on the way towards a low emission society.
The world doesn’t wait for the UN
The recipe for how the global climate challenges should be solved is simple, but no country can solve the challenge alone. This is the reason for the intense work to get binding international agreements into place in the past two to three years. The most recent UN climate conference was held in Poland in the autumn of 2013 but once again, proved less successful than many desired.
The ambition for a new agreement in Paris in 2015 is set, however, while we are waiting for a new agreement, the time left for the world to solve the challenge is diminishing. Luckily, not everyone is paralyzed while waiting for a new agreement.
The message from the UN Climate Panel (Intergovernmental Panel on Climate Change – IPCC)
and the International Energy Agency is crystal clear. If the world does not take action quickly,
climate change will be dramatic, with a global temperature increase of six degrees Celsius –
which we definitely want to avoid. And we can, but it’s urgent.
FIGURE 1.1 GLOBAL NEW INVESTMENTS IN RENEWABLE ENERGY, 2012 (USD BILLION)
Figur 6.5 500 1 000 1 500 2 000 2 500 GWh Active projects Final reported 2010-2013 Achieved from projects final reported during the period 2001-2010 1 403 1 448 1 704 1 335 1 420 2 334 1 763 1 065 820 544 948 0 500 1 000 1 500 2 000 2 500 3 000 3 500 MNOK 3 954 MNOK
Financial framework Allocated
3 954 MNOK
Returns on the Fund for Climate, Renewable Energy and Energy Restructuring: 999
Interest income Energy Fund 2012: 93 Allocations: 20
Parafiscal charge on grid tariff: 694
Cancelled projects: 827
Transferred from previous years: 1322 Commitments: 1 999 Transferred to next year: 1 955
Figur 5.2 0 0,5 1,0 1,5 2,0 2,5 3,0 3,5 4,0 Rente
Total energy end-use 2012, 282 TWh Total : USD 244.2 billion
Total emissions 2011: 53 million tonnes CO2 equivalents
20 30 000 40 000 50 000 60 000 70 000 80 000 90 000 100 000 40 60 80 100 120 140 160 180 0 Index 200 400 600 800 1 000 1 200 1 400 1 600 1 800 0 GWh Figur 5.1 0 1 2 3 4 5 6 TWh 0 2015 2012 2013 2014
Industries and non-industrial plants and facilities Renewable heating and renewable power production Non-residential and residential buildings
Statsobligasjoner 10 år Nibor 3 mnd Goal 2015: 6.25 TWh Figur 5.4 14% 24% 5% 57% Energy efficiency Production Distribution Conversion Figur 3.1 Figur 1.1 Figur 3.2
Figur 3.3 Utgår foreløpig.
26% 20% 36 5,4 9,5 79,9 11,5 66,6 6,5 29 20% 22% 26% 32% 1%2% 17% 17% 11% 6% Industry, 74 TWh Oil and gas, 55 TWh Transport, 58 TWh Households, 47 TWh Services, 32 TWh Other, 15 TWh US Brazil
America (excl. the US and Brazil) Europe
Middle East and Africa China
India
Asia and Oceania (excl. China and India)
Industry, 12 million tonnes CO2 equivalents Oil and gas, 14 million tonnes CO2equivalents Transport, 17 million tonnes CO2 equivalents Households, 0.6 million tonnes CO2 equivalents Services, 1 million tonnes CO2 equivalents Other, 9 million tonnes CO2equivalents
Figur 5.5 200 0 400 600 800 1 000 Number GWh MNOK
Number of projects supported Contractual result [GWh] Contractual support [MNOK] < 1 GWh 1 092 162 381 1-10 GWh 199 643 731 10-50 GWh 478 469 23 50-100 GWh 1 62 89 Figur 5.6 200 0 400 600 800 1 000 1 200 1 400 1 600 Number GWh MNOK < 1 GWh 1-10 GWh 10-50 GWh 50-100 GWh > 100 GWh
Number of projects supported Contractual result [GWh] Contractual support [MNOK] 1 638 263 311 581 1 023 1 155 853 774 40 2 423 450 Figur 5.7 100 0 200 300 400 500 600 Number GWh MNOK 2013 2014 2015 2016 2017 2018-2020
Number of projects supported Contractual result [GWh] Contractual support [MNOK] 394 132 161 643 394 379 92 255 350 24 145 156 19 236 338 244 383 146 Figur 5.8 100 0 200 300 400 500 600 700 800 900 Number GWh MNOK 2012 2013 2014 2015 2016 2017 2018-2020
Number of projects supported Contractual result [GWh] Contractual support [MNOK] 83 27 33 789 307 315 197 766 921 766 698 734 109 458 534 35 459 462 21 249 355 Figur 5.9 15% 17% 1% 20% 3% 16%
29% Pellet stove and pellet boiler
Central control system Water-to-water heat pump Solar collector
Air-to-water heat pump Conversion from electric to renewable central heating Phase-out of oil boilers
Contractual energy result (GWh) Contractual support (MNOK) 0 50 100 150 GWh MNOK 200 250 Figur 5.10
Aust-Agder Buskerud Finnmark Hedmark Hordaland
Møre og Romsdal Nordland Nord-Trøndelag Oppland Oslo Rogaland Sør-Trøndelag Telemark Troms Vest-Agder Vestfold Østfold Svalbard Sogn og Fjordane Akershus Nationwide 118 172 264 118 104 101 129 164 161 1023 7580 89 5653 61 85 3534 3842 119 23 41 44 68 104 4744 78 109 109 75 78 62 79 88 78 0 20 40 60 120 140 160 Number of projects supported 80 100 Figur 5.11
Aust-Agder Buskerud Finnmark Hedmark Hordaland
Møre og Romsdal Nordland Nord-Trøndelag Oppland Oslo Rogaland Sør-Trøndelag Telemark Troms Vest-Agder Vestfold Østfold Svalbard Sogn og Fjordane Akershus Nationwide 11 171 90 30 10 45 91 96 36 42 58 146 81 135 24 38 47 60 51 85 1 Figur 6.1 0% 10% 20% 30% 40% 50% 60% 70% 80% 90% 100% Active projects
– disbursement has not started Active projects
– disbursement has started Final reported 2013 Final reported – 2001-2012 2001 2002 2003 2004 2005 2006 2007 2008 2009 2010 2011 820 548 -20 -989 -691 -684 -910 -662 -781 -638 -293 -448 952 1 467 1 454 1 629 1 424 1 430 2 341 1 764 1 065 Figur 6.2 500 1 000 -1 000 -500 1 500 2 000 2 500 GWh Industry
Renewable power production Solid biofuel production Renewable heating Cancelled projects Buildings New technology 2001 2002 2003 2004 2005 2006 2007 2008 2009 2010 2011
apr 11 jul 11 okt 11 jan 12 apr 12 jul 12 okt 12 jan 13 apr 13 jul 13 okt 13
jan11
Figur 3.3
Carbon quotas (ICE-ECX-EUA) Coal (Coal ICE AP12 CIF ARA) Natural gas (Natural Gas, Henry Hub) Crude oil (Crude Oil North Sea) Electricity (NordPool 1 year forward)
Apartment buildings Houses Businesses Hotels Offices Figur 3.4 2010 2011 2012 2013 MNOK 11-Q1 11-Q2 11-Q3 11-Q4 12-Q1 12-Q2 12-Q3 12-Q4 13-Q1 13-Q2 13-Q3 2 000 4 000 6 000 8 000 0 MNOK 11-Q1 11-Q2 11-Q3 11-Q4 12-Q1 12-Q2 12-Q3 12-Q4 13-Q1 13-Q2 13-Q3 50 100 150 200 250 300 350 400 0 kWh/m2 Figur 4.1
Tek 97 Tek 07 Tek 10 Low energy Passive house Near zero energy
Passive house Low energy Tek 10 Tek 08 Tek 97
Passive house new building Passive house rehabilitation Low energy new building Low energy rehabilitation
5 10 15 20 25 30 35 40 0 kWh/m2 Figur 4.2 Figur 4.3 Room Heating Ventilation heating Tap water Fans Pumps Lightning
Technical equipment Ventilation cooling
100 000 200 000 300 000 400 000 500 000 600 000 700 000 800 000 900 000 0 m2 2005 2006 2007 2008 2009 2010 2011 2012 2013 Figur 4.4 1 000 2 000 3 000 4 000 5 000 6 000 0 NOK/m2 U value 0,7 0,8 1 1,2 6 084 5 344 5 222 4 680 1 000 0 2 000 3 000 4 000 5 000 Figur 6.3 GWh 4 889 4 821 4 805
Contractual Final reported Achieved (normal year)
Figur 6.4
Realisert energiresultat i et normalår Forventet intervall for variasjon i energiresultat fra år til år
Kontraktsfestet energiresultat Sluttrapportert energiresultat
Fornybar varme Yrkesbygg,
bolig og anlegg Industri
Biobrensel Fornybar kraft
Figur 5.3 0 200 400 600 800 1 000 NOK/tonnes CO2 equivalents 727 299 195
Assuming Nordic coal power as alternative supply Assuming Nordic electricity
mix as alternative supply Assuming European electricity mix as alternative supply Figur 1.2 Billion/USD Billion/USD US 0 10 20 30 40 50 60 04 05 06 07 08 09 10 11 12 Billion/USD EUROPE 0 20 40 60 80 100 120 04 05 06 07 08 09 10 11 12 Billion/USD CHINA 0 10 20 30 40 50 70 60 04 05 06 07 08 09 10 11 12
Figur 3.6 Utgår foreløpig.
Figur 3.7 Utgår foreløpig. 0,1 0,2 0,3 0,4 0,5 0,6 0,7 0,8
0 Electricity (spline method)
Electricity
Fuel oil (spline method) Fuel oil 2005 2006 2007 2008 2009 2010 2011 2012 2013 NOK/kWh 5 338 293 Figure 1.1: The figure shows new investments (in USD billion) in 2012 distributed by region.
7
Norway has its Climate Agreement, and the EU has its 2020 goals. Considerable work is also underway in the world’s two largest emission generators, China and the US.
None of these countries could be called initiators for getting a global climate agreement into place, the changes are being driven by regional initiatives at state levels. For China, the need for more energy combined with major local pollution challenges are the most important drivers. The fact that major emission generators such as China and the US are making major investments in emission reductions also means that they are investing heavily in technology.
The future’s energy solutions
China increased its investments in renewable energy from USD 2.6 billion in 2004 to USD 66.6 billion in 2012. For comparison, the US and Europe invested USD 36 and 80 billion in 2012, respectively. Though the investments in renewable energy are considerable, a total of USD 244 billion in 2012, the volume needs to be raised significantly in order to reach the Two-Degree Target.
In its New Policy Scenario (WEO 2013), the IEA estimates that, globally, USD 260 billion must be invested annually in renewable energy and another USD 280 billion in transmission capacity – and this is a scenario that comes nowhere close to achieving the
Two-Degree Target1. In addition, about USD 350 billion must be
invested annually in energy efficiency measures, of which USD 100 billion are directed at buildings.
Though all forms of renewable energy and carbon capture must contribute in order for the world to achieve the Two-Degree Target, which technological solutions become the winners and which countries become important technology suppliers could be determined as early as now.
Norway already has a high level of expertise within renewable energy, with long experience from hydropower and power refining industry. More recently, we have harvested experience from both wind and solar power. Norway also has a highly competent supplier industry for the oil and gas sector, which delivers innovative solutions that satisfy high quality requirements and operate under tough climate conditions. The overall knowledge and experience which these industries possess could give Norway a leading role within efficient energy use, the future’s renewable production, carbon capture and storage. However, this entails that we use these opportunities when they arise. If we wait, we risk being left on the sideline.
The future’s energy system
An energy system with a significantly higher renewables percentage than today will result in greater challenges related to security of supply. This would not be due to insufficient energy
NEW INVESTMENTS IN RENEWABLE ENERGY, 2004-2012 FIGURE 1.2 Figur 6.5 1 000 1 500 2 000 2 500 GWh 1 403 1 448 1 704 1 335 1 420 2 334 1 763 1 065 948 0 500 1 000 1 500 2 000 2 500 3 000 3 500 MNOK 3 954 MNOK
Financial framework Allocated
3 954 MNOK
Returns on the Fund for Climate, Renewable Energy and Energy Restructuring: 999
Interest income Energy Fund 2012: 93 Allocations: 20
Parafiscal charge on grid tariff: 694
Cancelled projects: 827
Transferred from previous years: 1322 Commitments: 1 999 Transferred to next year: 1 955
Figur 5.2 0 0,5 1,0 1,5 2,0 2,5 3,0 3,5 4,0 Rente
Total energy end-use 2012, 282 TWh Total : USD 244.2 billion
Total emissions 2011: 53 million tonnes CO2 equivalents
20 30 000 40 000 50 000 60 000 70 000 80 000 90 000 100 000 40 60 80 100 120 140 160 180 0 Index 200 400 600 800 1 000 1 200 1 400 1 600 1 800 0 GWh Figur 5.1 0 1 2 3 4 5 6 TWh 0 2015 2012 2013 2014
Industries and non-industrial plants and facilities Renewable heating and renewable power production Non-residential and residential buildings
Statsobligasjoner 10 år Nibor 3 mnd Goal 2015: 6.25 TWh Figur 5.4 14% 24% 5% 57% Energy efficiency Production Distribution Conversion Figur 3.1 Figur 1.1 Figur 3.2
Figur 3.3 Utgår foreløpig.
26% 20% 36 5,4 9,5 79,9 11,5 66,6 6,5 29 20% 22% 26% 32% 1%2% 17% 17% 11% 6% Industry, 74 TWh Oil and gas, 55 TWh Transport, 58 TWh Households, 47 TWh Services, 32 TWh Other, 15 TWh US Brazil
America (excl. the US and Brazil) Europe
Middle East and Africa China
India
Asia and Oceania (excl. China and India)
Industry, 12 million tonnes CO2 equivalents Oil and gas, 14 million tonnes CO2equivalents Transport, 17 million tonnes CO2 equivalents Households, 0.6 million tonnes CO2 equivalents Services, 1 million tonnes CO2 equivalents Other, 9 million tonnes CO2equivalents
Figur 5.5 200 0 400 600 800 1 000 Number GWh MNOK
Number of projects supported Contractual result [GWh] Contractual support [MNOK] < 1 GWh 1 092 162 381 1-10 GWh 199 643 731 10-50 GWh 478 469 23 50-100 GWh 1 62 89 Figur 5.6 200 0 400 600 800 1 000 1 200 1 400 1 600 Number GWh MNOK < 1 GWh 1-10 GWh 10-50 GWh 50-100 GWh > 100 GWh
Number of projects supported Contractual result [GWh] Contractual support [MNOK] 1 638 263 311 581 1 023 1 155 853 774 40 2 423450 Figur 5.7 100 0 200 300 400 500 600 Number GWh MNOK 2013 2014 2015 2016 2017 2018-2020
Number of projects supported Contractual result [GWh] Contractual support [MNOK] 394 132 161 643 394 379 92 255 350 24 145 156 19 236 338 244 383 146 Figur 5.8 100 0 200 300 400 500 600 700 800 900 Number GWh MNOK 2012 2013 2014 2015 2016 2017 2018-2020
Number of projects supported Contractual result [GWh] Contractual support [MNOK] 83 27 33 789 307 315 197 766 921 766 698 734 109 458 534 35 459 462 21 249 355 Figur 5.9 15% 17% 1% 20% 3% 16%
29% Pellet stove and pellet boiler
Central control system Water-to-water heat pump Solar collector
Air-to-water heat pump Conversion from electric to renewable central heating Phase-out of oil boilers
Contractual energy result (GWh) Contractual support (MNOK) 0 50 100 150 GWh MNOK 200 250 Figur 5.10
Aust-Agder Buskerud Finnmark Hedmark Hordaland
Møre og Romsdal Nordland Nord-Trøndelag Oppland Oslo Rogaland Sør-Trøndelag Telemark Troms Vest-Agder Vestfold Østfold Svalbard Sogn og Fjordane Akershus Nationwide 118 172 264 118 104 101 129 164 161 1023 7580 89 5653 61 85 3534 3842 119 23 41 44 68 104 4744 78 109 109 75 78 62 79 88 78 0 20 40 60 120 140 160 Number of projects supported 80 100 Figur 5.11
Aust-Agder Buskerud Finnmark Hedmark Hordaland
Møre og Romsdal Nordland Nord-Trøndelag Oppland Oslo Rogaland Sør-Trøndelag Telemark Troms Vest-Agder Vestfold Østfold Svalbard Sogn og Fjordane Akershus Nationwide 11 171 90 30 10 45 91 96 36 42 58 146 81 135 24 38 47 60 51 85 1 Figur 6.1 0% 10% 20% 30% 40% 50% 60% 70% 80% 90% 100% Active projects
– disbursement has not started Active projects
– disbursement has started Final reported 2013 Final reported – 2001-2012 2001 2002 2003 2004 2005 2006 2007 2008 2009 2010 2011 820 548 -20 -989 -691 -684 -910 -662 -781 -638 -293 -448 952 1 467 1 454 1 629 1 424 1 430 2 341 1 764 1 065 Figur 6.2 500 1 000 -1 000 -500 1 500 2 000 2 500 GWh Industry
Renewable power production Solid biofuel production Renewable heating Cancelled projects Buildings New technology 2001 2002 2003 2004 2005 2006 2007 2008 2009 2010 2011
apr 11 jul 11 okt 11 jan 12 apr 12 jul 12 okt 12 jan 13 apr 13 jul 13 okt 13
jan11
Figur 3.3
Carbon quotas (ICE-ECX-EUA) Coal (Coal ICE AP12 CIF ARA) Natural gas (Natural Gas, Henry Hub) Crude oil (Crude Oil North Sea) Electricity (NordPool 1 year forward)
Apartment buildings Houses Businesses Hotels Offices Figur 3.4 2010 2011 2012 2013 MNOK 11-Q1 11-Q2 11-Q3 11-Q4 12-Q1 12-Q2 12-Q3 12-Q4 13-Q1 13-Q2 13-Q3 2 000 4 000 6 000 8 000 0 MNOK 11-Q1 11-Q2 11-Q3 11-Q4 12-Q1 12-Q2 12-Q3 12-Q4 13-Q1 13-Q2 13-Q3 50 100 150 200 250 300 350 400 0 kWh/m2 Figur 4.1
Tek 97 Tek 07 Tek 10 Low energy Passive house Near zero energy
Passive house Low energy Tek 10 Tek 08 Tek 97
Passive house new building Passive house rehabilitation Low energy new building Low energy rehabilitation
5 10 15 20 25 30 35 40 0 kWh/m2 Figur 4.2 Figur 4.3 Room Heating Ventilation heating Tap water Fans Pumps Lightning
Technical equipment Ventilation cooling
100 000 200 000 300 000 400 000 500 000 600 000 700 000 800 000 900 000 0 m2 2005 2006 2007 2008 2009 2010 2011 2012 2013 Figur 4.4 1 000 2 000 3 000 4 000 5 000 6 000 0 NOK/m2 U value 0,7 0,8 1 1,2 6 084 5 344 5 222 4 680 1 000 0 2 000 3 000 4 000 5 000 Figur 6.3 GWh 4 889 4 821 4 805
Contractual Final reported Achieved (normal year)
Figur 6.4
Realisert energiresultat i et normalår Forventet intervall for variasjon i energiresultat fra år til år
Kontraktsfestet energiresultat Sluttrapportert energiresultat
Fornybar varme Yrkesbygg,
bolig og anlegg Industri
Biobrensel Fornybar kraft
Figur 5.3 0 200 400 600 800 1 000 NOK/tonnes CO2 equivalents 727 299 195
Assuming Nordic coal power as alternative supply Assuming Nordic electricity
mix as alternative supply Assuming European electricity mix as alternative supply Figur 1.2 Billion/USD Billion/USD US 0 10 20 30 40 50 60 04 05 06 07 08 09 10 11 12 Billion/USD EUROPE 0 20 40 60 80 100 120 04 05 06 07 08 09 10 11 12 Billion/USD CHINA 0 10 20 30 40 50 70 60 04 05 06 07 08 09 10 11 12
Figur 3.6 Utgår foreløpig.
Figur 3.7 Utgår foreløpig. 0,1 0,2 0,3 0,4 0,5 0,6 0,7 0,8
0 Electricity (spline method)
Electricity
Fuel oil (spline method) Fuel oil 2005 2006 2007 2008 2009 2010 2011 2012 2013 NOK/kWh 5 338 293
Figure 1.2: The figure shows the development in new investments (in USD billion) in the US, Europe and China during the period 2004-2012. Source: Bloomberg New Energy Finance; UNEP.
production, but because much of this production cannot be controlled to the same extent as energy production from non-renewable energy sources. Increased use of wind and solar power will result in an increased need for balance power in combination with storage.
With more than one hundred years of experience with major-scale production of renewable energy, Norway is already an important contributor in the work on making Europe more renewable. Norway still has major unused opportunities for increased renewable energy production, and we also have the possibility of offering renewable energy when it is needed. The current challenge is that, while Europe has high ambitions for increased use of renewable energy, and has come far in succeeding with this ambition, use of the most polluting power production – coal-based power - is also increasing. Despite Germany’s significant renewable energy supply ambitions through its “Energiewende”, coal-based power has increased at the expense of gas power. The reason for this is low coal prices in combination with low prices for greenhouse gas emissions. One of the most important preconditions for achieving a reduction in greenhouse gas emissions from the energy sector is not in place, considering that emitting greenhouse gases is basically free. This is in stark contrast to what the IEA, among others, stipulates as a precondition for achieving the UN’s Two-Degree Target; a high, global price for greenhouse gas emissions.
In its 450 scenario, the IEA assumes a global CO2 price of USD
125; far above the current quota price in the EU, a scant USD 5. In order for the world to succeed in limiting the global temperature increase to two degrees, the cost of emitting greenhouse gases must increase. This could take place through global agreements, perhaps as early as in Paris, France in 2015, but more likely through national and regional initiatives such as EU-ETS. When the price of emissions increases, it will not only affect technology choices in the energy supply, but also which products and services become preferred.
The future’s products
As steadily more countries and regions take steps to reduce their own greenhouse gas emissions, the climate footprint will become an increasingly important argument. Energy-efficient and climate-friendly will be a competitive advantage, green products will become the winners of the future.
Norway has some basic preconditions in place for being competitive through ample access to cheap, renewable energy, sound expertise and stable political conditions. However, we know that Norwegian competitiveness could be substantially improved if we did an even better job of utilising our opportunities.
Back in 2010, Enova (McKinsey) highlighted the considerable potential for improved competitiveness through increasing
energy efficiency in Norwegian industries. Though the figures are a few years old and some companies have done a lot in the interim, there is still room for reducing production costs by several billion kroner through further energy efficiency measures.
Competitive industries are far more important for a small country like Norway, which exports for 40 per cent of its GDP, than for major players such as the US, China and the EU. However, despite the EU exports representing just 14 per cent of the overall GDP, competiveness and employment are at the top of the agenda in the EU. A leading position within energy and climate technology will improve competitiveness and yield higher employment.
Energy-efficient production is only half the story, the products and production processes also need to be energy-efficient. In order to achieve our goals, everything from mobile telephones to the houses we live in need to be energy-efficient. At the same time, it is important to see products and production in context. We do not achieve much by just moving energy use and greenhouse gas emissions from products to production. In the same way, we need to be aware of how changes in one step of the energy system from energy resource to energy demand impact the big picture.
The possibilities are out there, but they require action
The UN’s goal to limit global warming to two degrees is ambitious, but the prescription is relatively simple: more renewable energy, more carbon capture, more energy-efficient production and more energy-efficient products and services. The biggest challenge is that decisions are required – tough decisions. If we are brave enough to take a stand, the road is open not just for a sustainable future, but also a competitive future. There are powerful growth impulses at play here, but also considerable risk.
Enova’s mission is to make the necessary choices easier. Enova invests in the energy and climate solutions.
Part 2
50% WOMEN MEN50% AGE COMPOSITION 2013 DISTRUBTION 2013 WOMEN/MEN 21-30 31-40 41-50 51-60 2 34 11 15Enova’s activities
Social responsibility
10
Organization
10
Management
12
20 01 12 20 02 23 20 03 30 20 04 31 20 05 31 20 06 37 20 07 44 20 08 44 20 09 53 201 0 52 20 11 59 20 12 55 20 13 62Enova is Norwegian authorities’ foremost tool for cultivating environmentally friendly energy restructuring and renewable energy production, as well as for contributing to development of energy and climate technology. Enova will strengthen security of supply and reduce greenhouse gas emissions. Enova helps private and public market players to address their social responsibility related to environmental and climate measures. Part of Enova’s corporate social responsibility is exercised through shaping good attitudes among children and young peo-ple. The Rainmakers, our campaign for children aged 9-12, will increase children’s knowledge of energy use and climate impact.
The Energy Challenge is part of this, and has engaged thousands of children and young people across the nation. Together with
Ungt Entreprenørskap, Enova organizes Nasjonal gründercamp
which inspires upper secondary students to develop new energy and climate technology.
Enova shall be a role model within the environment and climate and attempt to minimize the company’s impact on the exter-nal environment. Our offices have low energy consumption and use renewable energy sources. We prepare annual environmen-tal action plans including measures within energy consump-tion, water consumption and recycling. A limited number of
parking spaces encourages employees to walk/bike, or use public transportation to/from work. We purchase climate quotas for air travel and our company car is electric.
Enova shall be perceived as an honest and predictable employer and partner. A basic precondition is that our work is carried out in accordance with applicable statutes and regulations, and in line with good practice within areas such as health, safety, the environment, human rights, business ethics and anti-corruption. Our governance has a value-based approach with clear
expectations for all employees to comply with our values: clear,
responsible , inspiring and market oriented. Enova has extensive ethical guidelines that stipulate requirements for employees and others acting on our behalf, as well as our partners. The entire ethical guidelines are available on our website. We shall be open, honest and sensitive in our communication and contact with the outside world.
We exercise corporate governance principles emphasising openness, transparency, responsibility, equality and long-term perspectives. For example, we use external partners for quality assurance of our processes when necessary.
Enova manages considerable State resources on behalf of our society. We depend on trust and credibility in order to succeed. As a knowledge organization, each of our employees plays an important part. We need to be able to convert our employees’ knowledge and expertise into desired actions, actions that help Enova achieve its goals. We must be skilled and professional in our tasks, and this shall be reflected in our encounters with the outside world.
A flexible organization that is able to adapt to solve new tasks is vital. Our experience is that the correct use of expertise in teams provides greater power and performance than each individual’s achievement alone. We therefore focus on learning and how to share and build joint expertise. Clear roles and delegation of responsibility and authority help stimulate each individual to use their experience and their expertise in tasks to achieve the desired result.
We work with the aim of being an attractive workplace, and the 2013 employee survey showed strong results with improvement from 2012. Our employees have individual development plans, and we stimulate social wellbeing through cultural and physi-cal activities. We are an IA (inclusive working life) company, and focus on facilitating work situations for people on sick leave. We aim for an open and close cooperation with the trade unions. Enova sees the value of equality and diversity in the workplace. We have 62 full-time employees, of which 31 are women and 31 men. The main group of employees is currently in the age group 41 – 50 years. At the same time, it is important for us to maintain a broad range of ages to benefit from the knowledge and experi-ence represented by both younger and older employees. We have few employees in relation to our responsibilities. Special expertise and capacity needs are solved through cooperation with others.
Social responsibility
Our values
Clear,
Responsible,
Inspiring and
Market
Oriented
• We have goals, values and ethical guidelines that describe the fundamental attitudes and the phi-losophy that shall characterize our organization • We exercise corporate governance principles
where we emphasize openness, transparency, re-sponsibility, equality and long-term perspectives • We set high integrity requirements, which
e.g. entail that we do not tolerate any form of corruption and that we promote free market
• We are open, honest and sensitive in our com-munication and contact with the outside world • We do not discriminate based on gender,
religion, nationality, ethnicity, social groups or political viewpoints
• We are attentive to changes in what society in general considers good business practices. We evaluate and change our own practices when
Values and ethical guidelines
Our ethical guidelines and fundamental values are our rules of conduct for behaving ethically and in a socially responsible manner in all our activities:
Office of the Auditor General of Norway
Through guidance, control and auditing, the Office of the Auditor General of Norway will help ensure Norway’s resources and values are managed in accordance with what the Storting has decided.
Internal control
Enova conducts systematic follow-up, management and control over its own activities. Systems and routines are adapted to risk and significance.
Social contribution
In 2013, Enova supported projects with an overall energy result of 1.4 TWh through the Energy Fund, distributed over energy efficiency measures, conversion and increased utilization of renewable energy.
Enova’s
social responsibility
deals with operating our
enterprise so it provides a positive contribution to value
creation in society, both in relation to achieving our mission,
as well as how our deliveries are carried out.
Enova’s social mission
The Norwegian State
The Storting (Norwegian Parliament) is Norway’s legislative and budgetary power. The Storting passes Norway’s statutes, determines the state budget and controls the government. The government is Norway’s executive authority. The government is responsible for implementing the decisions adopted by the Storting.
The Ministry of Petroleum and Energy (MPE)
The MPE’s primary task on behalf of the Norwegian State is facilitating comprehensive and value-creating energy policy based on efficient and environmentally friendly utilization of natural resources. The MPE is Enova’s owner and principal; it issues letters of award and receives reporting.
The Energy Fund
The purpose of the Energy Fund is to promote environmentally friendly restructuring of energy end-use and energy production, as well as contribute to development of energy and climate technology. The Energy Fund shall be a predictable and long-term financing source for the restructuring work.
The 4-year agreement
Agreement between the Norwegian State through the MPE and Enova which defines and sets the framework for the social mission Enova has been tasked with. The Agreement will ensure the resources from the Energy Fund are managed in compliance with the goals and preconditions that form the basis for establishment of the Energy Fund.
Enova
Enova’s primary task is to cultivate environmentally friendly restructuring of energy end-use and energy production, as well as contribute to development of energy and climate techno-logy. This shall take place through management of the Energy Fund.
Enova’s social
responsibility
Enova’s
social mission
is to create lasting change in the supply
of and demand for efficient and renewable energy and climate
solutions. These activities will strengthen the security of supply
and reduce greenhouse gas emissions.
Our vision
An
energy-efficient and
renewable
Norway
Born: 1962
Position: Chief Executive Officer from 2008.
Education: Chartered engineer from the Norwegian Institute of Technology, Mechanical Engineering.
Experience: Nakstad has worked as a researcher and research manager in SINTEF and project manager in Hydro. He has headed enterprises such as Trondhjem Preservering AS and ReVolt Technology AS.
External board positions: Board member in Pro Venture Seed AS, Trondhjem Preserving AS (and group companies) and Labek AS, the Norwegian University of Science and Technology (NTNU) and Langrennskomiteen (Norwegian Ski Federation).
Audhild Kvam
Marketing DirectorBorn: 1968
Position: Marketing Director from 2013.
Education: Chartered engineer from Pacific Lutheran University, USA.
Experience: Kvam was hired by Enova as the Director of the Energy Efficiency Department in August 2010. She has experience as the VP Strategy and Marketing in Powel ASA, has worked as an information consultant and head of information in Trondheim Energi and has been CEO of Trondheim Energiverk Kraftsalg AS.
External board positions: Board member in Energi 21.
Previous board positions: Chair of NHO Trøndelag, board member of Istad AS, the Low Energy Programme and Clean-tech Mid Norway.
Geir Nysetvold
Director of Strategy and CommunicationBorn: 1961
Position: Director of Strategy and Communication from 2013.
Education: Chartered engineer from the Norwegian Institute of Technology, with a major in technical cybernetics. He also has several courses in technology, management and finance from the Norwegian Institute of Technology and the Norwegian School of Economics.
Experience: Nysetvold was hired as the Chief Financial Officer in December 2007. In the period from 2009-2012 he also headed the Strategy and Analysis department. He has experience from several top positions, primarily within insurance, e.g. as a division director and head of the corporate market area in Vital Forsikring.
External board positions: Member of the control committee in Nordea Liv Norge AS.
Full member - board member - European Energy Network (EnR).
Gunn Jorun Widding
Director of Enterprise ManagementBorn: 1970
Position: Director of Enterprise Management from mid-2013.
Education: Master of Business and Science from the University of Nordland (HHB). She also has a number of courses from the university colleges in Sør-Trøndelag, Bodø and Lillehammer.
Experience: Widding has previous experience from a management position within the travel industry and project management and several top positions in EVRY (previously ErgoGroup).
Øyvind Leistad
Programme DirectorBorn: 1972
Position: Programme Director from 2013.
Education: Norwegian University of Life Sciences, investment and financing.
Experience: Leistad was hired by Enova as senior adviser in 2005. During the period 2007-2012 he was the Director of the Energy Production Department in Enova. Leistad previously worked in the Ministry of Petroleum and Energy, where he worked with administration of various policy instruments related to stationary energy supply and renewable energy and energy efficiency in particular.
External board positions: Member of the programme board for ENERGIX, Research Council of Norway.
Part 3
Market descriptions
Enova – market team player
14
Indicators
14
Renewable heating:
From new establishment to growth
16
Industry and non-industrial
plants and facilities:
More companies are cooperating
with Enova
18
Non-residential buildings:
Energy smart buildings for the future
20
Residential buildings:
From advice to action
22
New energy and climate technology:
An innovation perspective
24
Bioenergy:
Small steps towards a stronger market
26
APPLICATIONS 2013 DISTRIBUTED BY MARKET AREA APPLICATIONS 2012-2013 2012 2013* Energy measures in residences are not included in the above figures. In 2013,
Residential buildings Industry Renewable heating and renewable power Non-residential buildings Non-industrial plants and facilities
14
Enova – market team player
PART 3MARKET DESCRIPTIONS
Inspiring and market oriented
Two of Enova’s values are inspiring and market oriented. As the driving force for new energy and climate solutions, these values are important to us. Being market oriented means always interacting with the market. We meet the market players and listen to their challenges.
Enova follows developments closely and ensures that our services consistently contribute to real market change. We inspire energy smart choices through campaigns and our annual Enova Conference, and increase expertise in the market through courses and gatherings.
Financing
Enova’s most important tool is the financing we provide for projects, whether they are major industrial projects or smaller household measures. Enova shall manage the Norwegian State’s resources so they can provide the greatest possible benefit for our society. When we support projects, we cover a percentage of the additional costs the market players incur by choosing more energy and climate-friendly solutions. The size of the support constitutes a smaller percentage than the project owner’s own contribution, the level must be sufficient, but cannot overcompensate. Financing increases project profitability and reduces risk. Support promotes good energy and climate
projects in the private and public sectors that would not have been initiated without State support. We must continuously assess whether we risk paying for something that would have been done regardless.
Advising/Guidance
The second most important tool in our portfolio is the guidance we provide to projects. Enova’s contribution in the form of state support and guidance is provided in a structured manner through targeted programmes. Advice for smaller projects is provided through our Ask Enova helpline in addition to information and advice on our website. In large projects, Enova and the project team will work closely over time to improve the project with regard to technical solutions and implementation, and make it more financially robust. Enova’s guidance is based on the experience from a total project portfolio of several thousand projects.
Cooperation
The goal of public tools is for more ideas to reach the market. The path from good ideas to solutions that are ready to use can be long. The need for public support will change along the way. A prudent work distribution and sound cooperation with other public policy instrument agencies is important from our perspective.
Indicators
FIGURE 3.1 ENERGY END-USE IN NORWAY 2012
Figur 6.5 500 1 000 1 500 2 000 2 500 GWh Active projects Final reported 2010-2013 Achieved from projects final reported during the period 2001-2010 1 403 1 448 1 704 1 335 1 420 2 334 1 763 1 065 820 544 948 0 500 1 000 1 500 2 000 2 500 3 000 3 500 MNOK 3 954 MNOK
Financial framework Allocated
3 954 MNOK
Returns on the Fund for Climate, Renewable Energy and Energy Restructuring: 999
Interest income Energy Fund 2012: 93 Allocations: 20
Parafiscal charge on grid tariff: 694
Cancelled projects: 827
Transferred from previous years: 1322 Commitments: 1 999 Transferred to next year: 1 955
Figur 5.2 0 0,5 1,0 1,5 2,0 2,5 3,0 3,5 4,0 Rente
Total energy end-use 2012, 282 TWh
Total emissions 2011: 53 million tonnes CO2 equivalents
20 30 000 40 000 50 000 60 000 70 000 80 000 90 000 100 000 40 60 80 100 120 140 160 180 0 Index 200 400 600 800 1 000 1 200 1 400 1 600 1 800 0 GWh Figur 5.1 0 1 2 3 4 5 6 TWh 0 2015 2012 2013 2014
Industries and non-industrial plants and facilities Renewable heating and renewable power production Non-residential and residential buildings
Statsobligasjoner 10 år Nibor 3 mnd Goal 2015: 6.25 TWh Figur 5.4 14% 24% 5% 57% Energy efficiency Production Distribution Conversion Figur 3.1 Figur 3.2
Figur 3.3 Utgår foreløpig.
26% 20% 79,9 11,5 66,6 20% 22% 26% 32% 1%2% 17% 17% 11% 6% Industry, 74 TWh Oil and gas, 55 TWh Transport, 58 TWh Households, 47 TWh Services, 32 TWh Other, 15 TWh
America (excl. the US and Brazil) Europe
Middle East and Africa China
India
Asia and Oceania (excl. China and India)
Industry, 12 million tonnes CO2 equivalents Oil and gas, 14 million tonnes CO2equivalents Transport, 17 million tonnes CO2 equivalents Households, 0.6 million tonnes CO2 equivalents Services, 1 million tonnes CO2 equivalents Other, 9 million tonnes CO2equivalents
Figur 5.5 200 0 400 600 800 1 000 Number GWh MNOK
Number of projects supported Contractual result [GWh] Contractual support [MNOK] < 1 GWh 1 092 162 381 1-10 GWh 199 643 731 10-50 GWh 478 469 23 50-100 GWh 1 62 89 Figur 5.6 200 0 400 600 800 1 000 1 200 1 400 1 600 Number GWh MNOK < 1 GWh 1-10 GWh 10-50 GWh 50-100 GWh > 100 GWh
Number of projects supported Contractual result [GWh] Contractual support [MNOK] 1 638 263 311 581 1 023 1 155 853 774 40 2 423450 Figur 5.7 100 0 200 300 400 500 600 Number GWh MNOK 2013 2014 2015 2016 2017 2018-2020
Number of projects supported Contractual result [GWh] Contractual support [MNOK] 394 132 161 643 394 379 92 255 350 24 145 156 19 236 338 244 383 146 Figur 5.8 100 0 200 300 400 500 600 700 800 900 Number GWh MNOK 2012 2013 2014 2015 2016 2017 2018-2020
Number of projects supported Contractual result [GWh] Contractual support [MNOK] 83 27 33 789 307 315 197 766 921 766 698 734 109 458 534 35 459 462 21 249 355 Figur 5.9 15% 17% 1% 20% 3% 16%
29% Pellet stove and pellet boiler
Central control system Water-to-water heat pump Solar collector
Air-to-water heat pump Conversion from electric to renewable central heating Phase-out of oil boilers
Contractual energy result (GWh) Contractual support (MNOK) 0 50 100 150 GWh MNOK 200 250 Figur 5.10
Aust-Agder Buskerud Finnmark Hedmark Hordaland
Møre og Romsdal Nordland Nord-Trøndelag Oppland Oslo Rogaland Sør-Trøndelag Telemark Troms Vest-Agder Vestfold Østfold Svalbard Sogn og Fjordane Akershus Nationwide 118 172 264 118 104 101 129 164 161 1023 7580 89 5653 61 85 3534 3842 119 23 41 44 68 104 4744 78 109 109 75 78 62 79 88 78 0 20 40 60 120 140 160 Number of projects supported 80 100 Figur 5.11
Aust-Agder Buskerud Finnmark Hedmark Hordaland
Møre og Romsdal Nordland Nord-Trøndelag Oppland Oslo Rogaland Sør-Trøndelag Telemark Troms Vest-Agder Vestfold Østfold Svalbard Sogn og Fjordane Akershus Nationwide 11 171 90 30 10 45 91 96 36 42 58 146 81 135 24 38 47 60 51 85 1 Figur 6.1 0% 10% 20% 30% 40% 50% 60% 70% 80% 90% 100% Active projects
– disbursement has not started Active projects
– disbursement has started Final reported 2013 Final reported – 2001-2012 2001 2002 2003 2004 2005 2006 2007 2008 2009 2010 2011 820 548 -20 -989 -691 -684 -910 -662 -781 -638 -293 -448 952 1 467 1 454 1 629 1 424 1 430 2 341 1 764 1 065 Figur 6.2 500 1 000 -1 000 -500 1 500 2 000 2 500 GWh Industry
Renewable power production Solid biofuel production Renewable heating Cancelled projects Buildings New technology 2001 2002 2003 2004 2005 2006 2007 2008 2009 2010 2011
apr 11 jul 11 okt 11 jan 12 apr 12 jul 12 okt 12 jan 13 apr 13 jul 13 okt 13
jan11
Figur 3.3
Carbon quotas (ICE-ECX-EUA) Coal (Coal ICE AP12 CIF ARA) Natural gas (Natural Gas, Henry Hub) Crude oil (Crude Oil North Sea) Electricity (NordPool 1 year forward)
Apartment buildings Houses Businesses Hotels Offices Figur 3.4 2010 2011 2012 2013 MNOK 11-Q1 11-Q2 11-Q3 11-Q4 12-Q1 12-Q2 12-Q3 12-Q4 13-Q1 13-Q2 13-Q3 2 000 4 000 6 000 8 000 0 MNOK 11-Q1 11-Q2 11-Q3 11-Q4 12-Q1 12-Q2 12-Q3 12-Q4 13-Q1 13-Q2 13-Q3 50 100 150 200 250 300 350 400 0 kWh/m2 Figur 4.1
Tek 97 Tek 07 Tek 10 Low energy Passive house Near zero energy
Passive house Low energy Tek 10 Tek 08 Tek 97
Passive house new building Passive house rehabilitation Low energy new building Low energy rehabilitation
5 10 15 20 25 30 35 40 0 kWh/m2 Figur 4.2 Figur 4.3 Room Heating Ventilation heating Tap water Fans Pumps Lightning
Technical equipment Ventilation cooling
100 000 200 000 300 000 400 000 500 000 600 000 700 000 800 000 900 000 0 m2 2005 2006 2007 2008 2009 2010 2011 2012 2013 Figur 4.4 1 000 2 000 3 000 4 000 5 000 6 000 0 NOK/m2 U value 0,7 0,8 1 1,2 6 084 5 344 5 222 4 680 1 000 0 2 000 3 000 4 000 5 000 Figur 6.3 GWh 4 889 4 821 4 805
Contractual Final reported Achieved (normal year)
Figur 6.4
Realisert energiresultat i et normalår Forventet intervall for variasjon i energiresultat fra år til år
Kontraktsfestet energiresultat Sluttrapportert energiresultat
Fornybar varme Yrkesbygg,
bolig og anlegg Industri
Biobrensel Fornybar kraft
Figur 5.3 0 200 400 600 800 1 000 NOK/tonnes CO2 equivalents 727 299 195
Assuming Nordic coal power as alternative supply Assuming Nordic electricity
mix as alternative supply Assuming European electricity mix as alternative supply Figur 1.2 Billion/USD US 0 10 20 30 40 50 60 04 05 06 07 08 09 10 11 12 Billion/USD EUROPE 0 20 40 60 80 100 120 04 05 06 07 08 09 10 11 12 Billion/USD CHINA 0 10 20 30 40 50 70 60 04 05 06 07 08 09 10 11 12
Figur 3.6 Utgår foreløpig.
Figur 3.7 Utgår foreløpig. 0,1 0,2 0,3 0,4 0,5 0,6 0,7 0,8
0 Electricity (spline method)
Electricity
Fuel oil (spline method) Fuel oil 2005 2006 2007 2008 2009 2010 2011 2012 2013 NOK/kWh 5 338 293
Figure 3.1: The figure shows relative distribution of energy end-use in Norway, including offshore activities, distributed by sector in 2012. Source: Statistics Norway. Energy accounts and energy balance 2011-2012.
Enova must be close to the market to carry out its mission. To help with our market monitoring we have chosen to follow a set of indicators that give us an overview of key preconditions for the development within our markets. Figures 3.1 – 3.4 are examples of conditions and indicators we follow.