Original Paper
Analysis of Wrinkle Properties of Fabrics
Using Wavelet Transform
Jian HAN *, Minzhuang YANG*, and MATSUDAIRA Mitsuo
* Graduate School of Natural Science, Kanazawa University, Kanazawa City 920-1192 Japan **Faculty of Education, Kanazawa University, Kakuma-machi, Kanazawa City 920-1192 Japan Received 15, October 2002; Accepted for publication 24, December 2003
Abstract
The decomposition and analysis of wrinkle profiles (signals) utilizing the wavelet transforms are presented. The Continuous Wavelet Transform (CWT) is used to analyze their wavelet coefficients C, which indicates the similarity closely correlated with the wavelet, and their wavelet power spectra. The signal can be decomposed into an approximation a$ and details do with the Discrete Wavelet Transform (DWT), and 3-D images of the fabric wrinkles decomposed is obtained, proving a convenient format for the analysis of wrinkles and identifying the characterization of wrinkles. The analysis of wrinkle properties of AATCC replicas and fabrics are performed with this method.
Key words: Wrinkle, Image processing, Slit beam projecting, Wavelet transform
1. Introduction
During wearing or after repeated home laundering, there were more or fewer wrinkles on the garment and its outward aesthetic appearances worsened. In the traditional subjective evaluation [1-3] for the wrinkle appearances of fabrics, the wrinkle grades mainly depended on human visual to judge and identify the wrinkles on the fabric surface by means of comparing with those on replicas. But the results were affected by the differences in visual among individuals and other factors. And furthermore, because there existed some differences on wrinkle shapes, sizes and numbers between the replicas and the fabrics, it sometimes leaded specialists to become in irresolute when they appraised the wrinkles. It is the fact that the irregular and various wrinkles in shape, size or number are intermingled or coexist in the same wrinkled fabric. Recently, some objectively evaluating methods [4-9] had been studied, and the information of the images or the data of profile lines of fabric surface were analyzed to measure their wrinkle appearances. In a part of them, it was proposed to make use of the Fast Fourier Transform (FFT) as an image or space series analysis tool for analyzing the images or space signals to evaluate the wrinkles in this field. FFT was an effective method to analyze the stationary signal, but it was not better to do the non-stationary ones, which actual signals of wrinkles are. It also was proved insufficient due to the non-localized nature of the transform. Moreover, FFT did not provide any
information about the temporal or position variation of a signal. Now wavelet has not only been widely used for signal compression, signal de-noising and image compression, it is but also known as mathematical tools for analyzing time or space series signals and images, such as for detecting a signal with small discontinuities or breakdown points [10,11] Its active application in the field of textile is a recent trend [12]. In the study, it is to be desired that the above problems can be solved by the wavelet analysis. Continuous Wavelet Transform (CWT) and Discrete Wavelet Transform (DWT) are employed to process the wrinkle data of fabric surfaces, to decompose and analyze the constructions and properties of wrinkles, and to extract the main characteristics. Wavelet Transform provides a novel insight and a valid method for analyzing wrinkle properties. The replicas of AATCC-128 method, which have five wrinkle grades, and some fabrics are analyzed in the experiment.
2. Theory and Experimental Methods 2.1 Wavelet Transform
Unlike conventional techniques, wavelet is a relatively new way of analyzing time or space series. A wavelet is a waveform of effectively limited duration that has an average of zero and tends to be irregular and asymmetric. Wavelet analysis is the breaking up of a signal into shifted and scaled versions of the mother wavelet. The mother wavelet is
defined as follows: 1 y-b u ,b (Y) _ ( ) (1) a CWT1131 is expressed by: Wcwr (Y)(a,b) = 1 - J- f (y) (y a b )dy (2) a °
where f(y) is a height function (original signal) of the fabrics surface, parameter a the scale, parameter b the shift. For CWT, the parameters vary in a continuous fashion. Since the signal is recorded on a very fine position form, the signal can be analyzed using CWT. One-dimensional analysis is based on one wavelet functions and one scaling function ' . They decay quickly to zero. The wavelet function /J is determined by the high-pass filter, which also produces the details of the wavelet decomposition. The scaling function 1. is determined by the low-pass filter, and thus is associated with the approximations of the wavelet decomposition. Since Daubechies wavelet [14] db4 is better matched to the signals of wrinkle shapes among the wavelet function family, it is first chosen to using the wavelet analysis in our research. The scaling function c D;4(y) and the wavelet of db4
2/J D;4(Y)of db4 are shown in Figure 1. The smaller the scale factor, the more "compressed" the wavelet; on the contrary, as the scale factor is increased, the wavelet will dilate. The scale is related to the frequency of the signal, and their relation is that low scales correspond to high frequencies and high scales to low ones.
In order to investigate further the wrinkle properties and various wrinkles intermingled, wavelet decomposition is performed to analyze them. When we have discrete function f(m) and the definition of DWT is given by:
W DWT (m)(a , b) _ f (m) p J,k (m) (3) mEZ
where P i k is a discrete
wavelet
defined
as:
/',,k (m) = 2 /2'p (2 ' m -k)
Y'
(4)
where m is the pixel number of profiles along Y -direction, the parameter a, b are defined in such a way that a = 2',
b =2k, j,kEZ.
In wavelet analysis, a wrinkle signal is split into an
approximation and a detail. The approximation is then itself split into a second-level approximation and detail, and so on. In this work, Daubechies wavelet db4 using 5 analysis levels is chosen to use, which is similar to the wrinkle shapes on the fabric surface and is sufficiently regular for this analysis. Wavelet decomposition producers a family of
hierarchically organized decompositions and the level is chosen based on a desired low-pass frequency. At each level n, we build the n-level approximation an and the n-level detail dn1151
S = an+dl+d2+ • • •+dn (5)
The wavelet decomposition can depict valuable information. 2.2 Experimental Methods
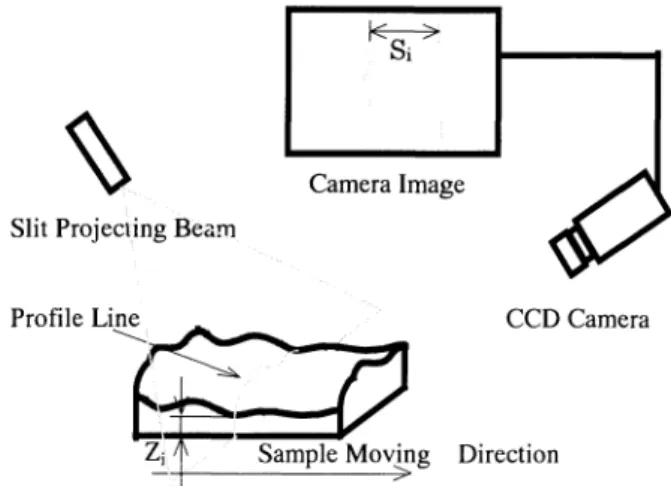
The slit beam projecting technique, combined with the image processing system, is used in this experiment, and three-dimensional images of the wrinkle of fabrics are obtained by the method, and the fabric wrinkles can be evaluated and analyzed objectively. The principal elements in the system include a light projector, a CCD camera, a moving platform, a monitor and a personal computer, in which a capture board is installed. As shown in Figure 2, a profile line is radiated onto the surface of a sample to be tested in a dark room and an image is captured with the CCD camera. Using a spatial resolution of 80 X 361 pixels, corresponding to approximately 25 X 110 mm in actual area, the reflected images are captured at intervals of 2 mm when
Fig. 1 Daubechies scaling function and wavelet
the platform and sample moves along X direction. There are 41 images for every specimen, and they are made up a total tested area 80 X 110 mm(X-direction X Y-direction) in the center of sample. The captured images are binaryzed and thinned at the same time. By comparing the distorted line with the original reference plane, the surface height Z; can be detected. Such, the functions f (y)of surface height values and 3D range images are obtained and wrinkle appearances of surface and wrinkle grades of fabrics are evaluated in the system, that was explained in detail in our former paper~161. 3. Results and Discussions
The typical wrinkle profiles of the replicas are analyzed using CWT. A plot of CWT of the surface profile signals about wrinkle grade 1,3 and 5 among five grades is shown in Figure 3. The top of the figure shows the original signals (s) of wrinkle. The bottom of the figure displays the CWT of the signals, where the horizontal axis represents position along the signal, the vertical axis does scale, and the color at each point does the magnitude of the wavelet coefficient C. The right side color bar shows the reciprocal of the wavelet coefficient amplitude. These coefficient plots resemble a bumpy surface viewed from above. C represents how closely
the wavelet is correlated with this section of the signal. The higher C is, the more the similarity. Notice that the scales a in the coefficients plot (shown as vertical axis labels) runs from 1 to 128. The higher scales correspond to the most "stretched" wavelets. The more stretched the wavelet, the longer the portion of the signal with which it is being compared, and thus the flatter the signal features being measured by the wavelet coefficients. Regions with highest level of white color represent the high absolute values of complex coefficients of wavelet transform, that means the high correlation of chosen wavelet function with the part of analyzed signal.
For wrinkle grade 1, the white areas, which represent peaks in CWT, appear in the three parts: scale, 30-60 position 30-65, 80-95 and scale 30-128, position 0-15. For the grade 2, the light areas appear in the regions: scale 50-85, position 52-67and scale 85-128, poison 93-103. When the wrinkle grade 3 is analyzed, the light domain appears in the region: scale 75-128, position 35-75. The scale of light region for grade 4 becomes a larger one than that for grade 3. The light for grades appears in the area with scale 64-128, position 15-45. Note the appearance of localized natures in Figure 3, and typical ones are indicated with the dashed circles.
Fig.3 Continuous wavelet transform (db4) of surface profiles
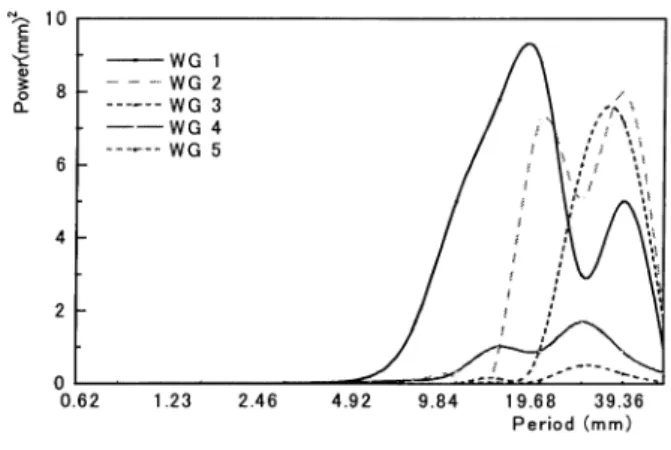
Figure 4 displays the wavelet power spectrums of wrinkle grade 1, 3 and 5 among five grades of replicas, calculated using the Morlet wavelet. For the Morlet, which has several smooth oscillations, the period is well-defined quantity, but for Daubechies, which has irregularly-spaced oscillations, the period has less meaning. It is found that the figures using Morlet indicates clearer information than that using Db4. Black and deep gray colors are indicative of higher degree of power. For wrinkle grade 1, its highest degree powers are centered on two parts: one is on period about 10 mm, position from 35 to 80mm and the other is on period about 20 mm, and position from 0 to 35mm. The highest degree power for wrinkle grade 2 is centered on a broadband whose position is from 0 to 110 but its period increases to about 40mm, and the magnitude is lower than that for wrinkle grade 1. The broadband of power spectrum for wrinkle grade 3 is almost the same as that for grade 2, but its highest power is lower than that for grade 2. The highest powers for grade 4 and 5 also appear on the broadband zone of period: about 40mm, but their powers are far lower than those for grade 1, 2 and 3. The largest power in grade 5 is the lowest only about 0.45 mm2, and it shows there is not entirely any wrinkle or almost smooth in this grade. It is recognized that there are not only wrinkles in grade 1 with both shorter and longer wavelength, but also ones having the highest wave height. There are wrinkles having higher wave height in grade 2, but their wrinkle periods are larger than that in grade 1. The wrinkles in grade 4 and 5 have larger periods and lower degree ones. These are much striking if the plot is displayed in color. The Figure 5 shows a 1-D power spectrum of five wrinkle grades and gives a clearer picture of what's happening with the signal,
A far more realizable investigation of the wrinkles is based on the Discrete Wavelet Transform (DWT) of the signal. At first Daubechies wavelet db4 at level 5, which is matched to the signals of wrinkle shapes and is sufficiently regular for this work, is chosen to implement the analysis with DWT. Wavelet transform of surface profiles of wrinkle grade 1,3, and 5 among five grades is illustrated in Figure 6. S is the original wrinkle signal, an denotes the approximation at level n and do does the detail at level n. The abscissa is the wrinkle position along Y -direction on the fabric surface and the ordinate s the magnitude of s, an or dn. It is found that the wrinkle is a sum of three-part signals: "low" frequency, "medium" frequency, and "high" frequency, which represent the wrinkle with the larger size, smaller
highlighting the periodicity. It is found that as the wrinkle degree increases, the periods on which the pinks of power appear decrease. The wrinkles appear the larger and smaller size, and higher degree ones on the wrinkle grades 1 and 2. The wrinkles appear the larger size and medium degree on the grade3. However, the wrinkles appear the larger size and low degree ones on the wrinkle grades 4 and 5.
Fig. 5 Power spectrum and period
size and the noise, and the periods are larger than 20mm, 7.5-15mm, and less than 3.5mm, respectively. For many signals, the low-frequency content is the most important part. It is what gives the signal its identity. The high-frequent content, on the other hand, imparts flavor or nuance of surface. The first-, second- and third-level details (dl, d2 and d3) have very . small peak values and primarily contain the high frequency part due to noise, varying between -0.1 and 0.1mm, whose period is less than 3.5mm. Therefore, approximation a5, details d4 and d5 are chiefly studied, and details dl, d2 and d3 are left out of below analyses. Details d4, and to an even greater extent, d5 contain small wrinkles ("medium" frequency) on the surface, which coexist with the larger wrinkles. The wrinkles are clearly isolated in approximation a5, from which the higher-frequency information has been filtered. For the wrinkle grade 1, the peak-to-peak magnitudes of details d4 and d5 are 1 and 2mm, respectively, and its amplitude of wrinkle signal (a5) is about 3.5mm with five large size wrinkles. For wrinkle grade 2, the ones of details d4 and d5 are 0.3 and 0.8mm, respectively, and one of a5 is about 1.7mm with four large size wrinkles. For wrinkle grade 3, 4and 5, the ones of details d4 and d5 are 0.1 and 0.3mm, respectively, and smaller than that of wrinkle grade 1. The amplitude of wrinkle grade 3(a5) is larger than that of grade4 and 5, although they all have three large size wrinkles. And the one of grade 4 (a5) is slight larger than that of wrinkle grade 5.
After the wavelet transforms of profile lines on replicas are performed and the high frequencies (dl, d2 and d3) are removed, the decomposed 3D figures of wrinkles can be obtained, and their wrinkle grade 1,3, and '5 among five
grades in the center area (80 X 80 mm) is illustrated in Figure 7. Figure 8 displays their standard deviation of five wrinkle grades and one of their decomposition (as, ds and d4), respectively. Approximation a5 and details d5i d4, same as original wrinkle signal, have good logarithmic functions between their standard deviation and the wrinkle grades. Details d5 and d4 have a larger effect on the wrinkle properties for wrinkle grades 1 and 2, but have a less effect on them for wrinkle grades 3, 4 and 5.
After the wrinkle grades of fabrics, linen, cotton, and polyester, etc., are evaluated with the 3D measurement system, their fabric wrinkles are analyzed using wavelet transform. The decomposition results of wavelet transform and the wavelet power spectrums of three of them are shown in Figure 9, and 10, respectively. In the fabric of wrinkle grade 1.07, there are mostly two larger wrinkles, and the other wrinkles are small ones. The fabric of wrinkle grade 4.32 are similar to grade 5, their sizes appear larger but their degree is the lowest.
Fig.7 3-D surface shapes decomposed with wavelet transform
4. Conclusion
The wavelet transform is a relatively new signal-processing tool that allows us to efficiently analyze the picture and the small details, and is capable of revealing aspects of data that other signal analysis techniques miss. The study using wavelet techniques has provided new insights in the analysis of the wrinkle appearances. With wavelets, following conclusions are obtained:
(1) The plots analyzed with CWT gives a clearer picture of what's happening with the signal, highlighting the periodicity. With the increase of wrinkle degree, the powers also become larger, and the periods on which the peak of the most powers appears decrease.
(2) Wavelets can extract the main characteristics. A wrinkle signal can be decomposed into an approximation an and the details do The wrinkle appearances mainly depend on its approximation a5 In wrinkle grades 1 and 2, they are also affected by the details d4 and d5, but they are hardly influenced by d4 and d5 in the wrinkle grades 3, 4 and 5. However, the details dl, d2 and d3 have very small peak values and primarily contain the high frequency part due to noise and impart flavor or nuance of surface for all grades.
The wavelet transform method settles the bases for quantitative analysis and projections of wrinkle properties of fabrics in the future work.
Fig.9 Wavelet transform of surface profiles of fabrics
Fig.10 Wavelet power spectrum (Morlet) of fabric surface profiles References
[1] C. 0. Bostwick; Tefo, No. 3(1961)
[2] Morooka H.,Niwa M.; Text. Mach. Soc. Japan, 17, 176(1976)
[3] Morooka H.,Niwa M.; Text. Mach. Soc. Japan, 18, 27(1977)
[4] Y.J. Na and B. Pourdeyhim; Text. Res. J., 65, 149(1995)
[5] B.Xu and J.A.Reed; J. Text. Inst.,86, 129(1995) [6] E.H.Kim; Text; Res. J., 69, 860(1999)
[7] T.J.Kang, et al; Text. Res. J., 69, 261(1999)
[8] Nishimatsu T.,Ohta K.; Sen' i Gakkaishi, Japan, 56, 348(2000)
[9]M.Matsudaira,J.Han,M.Yang; J. Text. Eng. Jpn., 48, No.1, 11(2001)
[10] R. Ashino; "Wavelet Analysis", p.131, Kyoritsu Press, Jpn, (2000)
[11] Z.X. Cheng; "Wavelet Algorithms & Applications",XJU Press, China,P.178(2001)
[12] K. Ohta; J.Text. Mach. Soc.Jpn., 53, No.4, 45(2000) [13]K. Arai; "Fundamental Theory on Wavelet Analysis",
P.21, Morikita Press, Jpn (2000)
[14] Charles K. Chui; "Wavelet Applications", p103, TDU Press, Jpn(1997)
[15] K. Arai; "Matlab", p.166, Kyoritsu Press, Jpn (2001) [16] J. Han, M.Z. Yang & M. Matsudaira, J. Text. Eng.