Boston University
OpenBU http://open.bu.edu
Theses & Dissertations Boston University Theses & Dissertations
2014
Isolating post-amplification
genomic DNA for recursive analysis
of low-template DNA samples
https://hdl.handle.net/2144/15347 Boston University
BOSTON UNIVERSITY SCHOOL OF MEDICINE
Thesis
ISOLATING POST-AMPLIFICATION GENOMIC DNA FOR RECURSIVE ANALYSIS OF LOW-TEMPLATE DNA SAMPLES
By
CHELSEA RAE KRAUSE
B.S., University of Wisconsin-Madison, 2012
Submitted in partial fulfillment of the requirements for the degree of
Master of Science 2014
© 2014 by
CHELSEA RAE KRAUSE All rights reserved
Approved by
First Reader
Catherine M. Grgicak, M.S.F.S, Ph.D.
Assistant Professor, Program in Biomedical Forensic Sciences
Second Reader
Erin Forry, M.S.
Quality Manager, Boston Police Department, Crime Laboratory Unit
iv
ACKNOWLEDGEMENTS
First and foremost I would like to express my gratitude to my thesis advisor, Dr. Catherine Grgicak, for providing me the opportunity to work on this project. Without her guidance and support, the completion of this thesis would not have been possible. I would also like to extend my appreciation to my thesis committee members, Erin Forry and Amy Brodeur, for taking the time to read and comment on my work during the revision process and helping to make this project a success.
This project would not be where it is today without the previous work conducted by Jessica Shea and Joseph Iacona. I would like to thank them for their hard work developing the project which created the foundation for which I could extend upon.
Finally, I would like to thank the Boston University School of Medicine program in Biomedical Forensic Sciences for providing me the facilities and resources needed to make this research possible. I would also like to thank the faculty and staff for all of the support and knowledge they have given me throughout my time within the program.
v
ISOLATING POST-AMPLIFICATION GENOMIC DNA FOR RECURSIVE ANALYSIS OF LOW-TEMPLATE DNA SAMPLES
CHELSEA RAE KRAUSE ABSTRACT
Low-template deoxyribonucleic acid (DNA) samples are commonly found within forensic biological evidence. Low amounts of DNA become increasingly difficult to analyze as the allelic peaks become less distinguishable from instrumental noise. Forensic laboratories currently try to increase allele signal intensity through additional polymerase chain reaction (PCR) cycles or enhancing capillary electrophoresis injection times or potentials. Purification of the post-PCR product may also be conducted as PCR reagents can compete with DNA fragments during electrokinetic injection. Though these strategies have proven useful, resulting in a higher signal to noise ratio, low-template samples continue to exhibit allele drop-out due to the stochastic variation induced by the forensic DNA laboratory process. Further complicating analysis is the fact that low-template DNA samples are often exhausted as the full amount is needed for analysis. Thus, PCR can be considered a destructive technique. Since allele drop-out is hypothesized to be the result of 1) insufficient levels of amplicons and 2) sampling effects, it is desirable to obtain the original DNA template after amplification for future analysis. This would minimize the impact of 1) above.
vi
Thus, a novel method which isolates genomic DNA after PCR amplification has been developed. Amplification products were produced using biotinylated primers and cleaned from the solution with streptavidin-coated magnetic beads. Filtration was then used to remove remaining PCR reagents and primers. The result is a recovered sample containing the original genomic DNA. Re-amplification was then performed showing the method is successful.
Although the method is capable of re-amplifying isolated DNA after PCR, there are points within the procedure that need to be optimized. For example, significant amounts of DNA are lost during the cleaning process and there is a high retention of the original amplified product. This study describes the optimization steps taken to reduce DNA loss, specifically through the filtration step. When method optimization is complete, low-template DNA samples could be analyzed recursively without being destroyed during PCR.
vii
TABLE OF CONTENTS
TITLE PAGE i
COPYRIGHT PAGE ii
READER APPROVAL PAGE iii
ACKNOWLEDGEMENTS PAGE iv
ABSTRACT v
TABLE OF CONTENTS vii
LIST OF TABLES x
LIST OF FIGURES xi
LIST OF ABBREVIATIONS xii
1. INTRODUCTION 1
1.1. Analysis of Low-template DNA Samples 1
1.2. Strategies to Improve Low-template DNA Analysis 2
1.3. Implications of Sample Storage on DNA Analysis 5
1.4. Recursive Amplification 7
1.5. Goal of the Study 8
1.6. Importance of Recursive Amplification in Forensic Analysis 9
2. METHODS 10
2.1. Method Description 10
2.1.1. DNA Amplification 10
viii
2.1.3. Amicon® Filtration 11
2.1.4. Dynabead® Elution 12
2.1.5. Re-amplification 12
2.1.6. Agarose Gel Electrophoresis 13
2.1.7. Capillary Electrophoresis 13
2.1.8. Quantitative PCR 14
2.2. Method Optimization 15
2.2.1. Amplification Reproducibility 15
2.2.2. Reducing TPOX Amplicon Retention 17
2.2.3. Reducing Recovered Volume within Amicon® Filtration 18
2.2.4. Amicon® Filtration with Evaporation 18
2.2.5. Effect of LoBind® Tubes with Amicon® Filtration and Evaporation 19
2.3. Method Assessment 20
2.3.1. DNA Loss within Amicon® Filtration 20
2.3.2. Effect of Freezing and Thawing Cycles on DNA Recovery 21 2.3.3. Modeling Recursive Amplification at Multiple DNA Targets 21
3. RESULTS AND DISCUSSION 24
3.1. Method Optimization 24
3.1.1. Amplification Reproducibility 24
3.1.2. Reducing TPOX Amplicon Retention 26
3.1.3. Reducing DNA Loss with Amicon® Filtration and LoBind® Tubes 30
ix
3.2.1. Modeling Recursive Amplification at Multiple DNA Targets 40 3.2.2. Full Method Assessment with Optimizing Modifications 45
4. FUTURE STUDIES 52
5. CONCLUSIONS 54
REFERENCES 56
x
LIST OF TABLES
Table 1: Parameters Used for Modeling the Effect of DNA Loss on
D5S818 Peak Height with Recursive Cleaning and Amplification. 23
Table 2: TPOX Peak Heights (RFU) from the Amplification Reproducibility
Assessment. 24
Table 3: TPOX Peak Height Equivalency Ratios for the Amplification
Reproducibility Assessment. 25
Table 4: DNA Percent Recovery and Recovered Volume with Varying
Amicon® Spin Times. 31
Table 5: Comparing Results from the Fifth Freeze/Thaw Samples and the
Refrigerated Samples to the Initial DNA Concentration. 39
Table 6: Parameters Used for Modeling the Effect of DNA Loss for
Amicon® and LoBind® Tubes. 41
Table 7: Number of Cleanings until D5S818 Peak Height Falls below
200 RFU. 44
Table 8: Peak Heights (RFU) of Amplified TPOX, Re-amplified D5S818,
xi
LIST OF FIGURES
Figure 1: Diagram of Sample Amplification Preparation for Group 1 –
Reaction Mix Reproducibility. 16
Figure 2: Diagram of Sample Amplification Preparation for Group 2 –
Amplification Mix Reproducibility. 16
Figure 3: Diagram of Sample Amplification Preparation for Group 3 –
Sample Amplification Reproducibility. 17
Figure 4: Comparison of TPOX and D5S818 Signal Intensities between
One and Two Dynabead® Cleanings. 27
Figure 5: Effect of Amicon® Spin Time on DNA Recovery (%) and
Recovered Volume (µL). 30
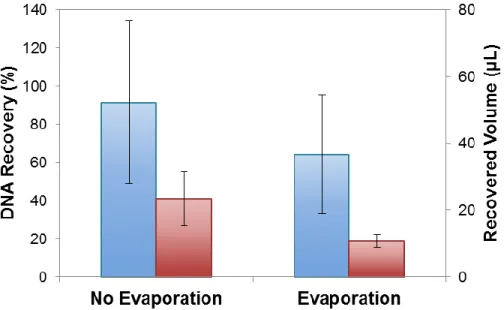
Figure 6: DNA Recovery after Amicon® Filtration with and without
Evaporation. 33
Figure 7: Comparison of DNA Recovery between Amicon® Collection
Tubes and LoBind® Tubes. 35
Figure 8: Effect of Tube Type and Freeze/Thaw Cycle Number on DNA
Concentration (ng/µL). 38
Figure 9: Effect of Number of Cleanings on D5S818 Peak Height (RFU). 42
Figure 10: Effect of Number of Cleanings on D5S818 Peak Height (RFU). 43
xii
LIST OF ABBREVIATIONS
bp Base Pairs
CE Capillary Electrophoresis
DI Deionized
DNA Deoxyribonucleic Acid
dNTP Deoxyribonucleotide Triphosphate
EDTA Ethylenediaminetetraacetic Acid
Hi-Di Highly Deionized
kV Kilovolt MgCl2 Magnesium Chloride µL Microliter µM Micromolar mM Millimolar ng Nanogram nm Nanometer pg Picogram
PCR Polymerase Chain Reaction
qPCR Real-time Polymerase Chain Reaction
RCF Relative Centrifugal Force
RFU Relative Fluorescence Units
xiii
™ Trademark
TE Tris-EDTA
UV Ultraviolet
1 1. INTRODUCTION
1.1. Analysis of Low-template DNA Samples
Low-template deoxyribonucleic acid (DNA) samples are commonly found at crime scenes and can result in DNA profiles which are uninterpretable. Generally, a ‘low-template DNA sample’ refers to a sample containing 100 pg or less of DNA.1 Though it is feasible to obtain a full profile from low-template samples using polymerase chain reaction (PCR), it can be difficult to differentiate true peak signal from instrumentation noise. Analysis of a small quantity of DNA can also lead to heterozygote peak imbalance, large stutter peaks, allelic drop-out, and allelic drop-in.1,2,3,4 The probability of allelic drop-out increases as the template DNA mass is reduced.4 Thus, low-template samples can produce partial profiles, which are often unsuitable for comparison purposes.
The role of analytical thresholds is important when analyzing low-template DNA samples. For optimal profile analysis, allelic peaks must be distinguishable from noise. Selecting an appropriate analytical threshold is complicated by the fact that baseline noise changes with template mass of DNA.5 Commonly used analytical thresholds vary from 30-150 relative fluorescent units (RFU) and are typically set to minimize the false detection of noise.6 Utilizing a high analytical
threshold reduces the risk of falsely identifying noise as signal. However, it also increases the potential for missing peaks that originate from alleles. In contrast, using a threshold that is too low results in an increase in the false detection rate of noise – particularly for samples containing greater than ~0.5 ng of total DNA.5
2
Forensic biological samples often contain DNA from multiple contributors in varying quantities.7 This can cause issues during profile interpretation as major and minor contributors to the sample could be present. Even if the total amount of DNA within the sample is greater than 100 pg, it may be difficult to identify the genotype of a single-minor contributor.
In order to analyze low-template, or trace samples of DNA, the full sample may need to be consumed within one PCR. This makes the sample unavailable for alternative or repeated analysis.1 When the entire evidence stain is utilized, it becomes an ‘exhausted’ sample. Thus, retesting an exhaustive sample with a different amplification kit is impossible. As a result, the likelihood that these samples result in signal that can be used for comparison purposes is low.
1.2. Strategies to Improve Low-template DNA Analysis
The interpretation of low-template DNA profiles, as well as the comparison of such profiles to known DNA standards is complex. Several strategies have been suggested to improve the confidence associated with DNA profile comparisons: consensus profiling, increasing PCR cycle number, altering capillary electrophoresis (CE) injection time and voltage, and purification of post-PCR products.
Consensus profiling includes analyzing a sample multiple times.3 If a peak is observed twice within replicates, it is classified as an allele. This method allows an analyst to distinguish true alleles from noise and artifacts such as allele drop-in.1 However, consensus profiling is a sub-optimal analysis technique
3
because it requires the division of a sample, which may already contain low quantities of template DNA.4 In cases where low-template samples are to be analyzed, consensus profiling may not be feasible.
Another option to improve profile results includes increasing the PCR cycle number. Increasing the number of PCR cycles from 28 to 34 increases the number of amplicons and therefore the sensitivity.2,8,9 This method increases allelic peak heights and makes the profile more complete. However, an increase in the imbalance between heterozygote alleles, as well as the proportion and variance of stutter, also occur.10
Increased CE voltage and extended CE injection time allows for more of the amplified product to be detected. For example, Westen et al. found that STR peak heights increased, on average, six-fold with increased electrokinetic injection settings.11 They also found that higher voltage conditions sharpen the allelic peaks while the longer injection time broadens them. Broadened peaks may exhibit similar peak morphology to dye-blobs, which were also enhanced with increased injection. Thus, additional effort may be needed to differentiate wider allele peaks from the enhanced dye-blob artifacts. With enhanced electrokinetic injection, an increase in the heterozygote peak height imbalance was observed, but increased stutter peaks were rare.11 Increasing PCR cycles and electrokinetic injection parameters both enhance low-template DNA profiles but they are not without their consequences.
4
Purifying post-PCR products is an additional technique utilized to increase STR profile intensity. After amplification, samples can be filtered to remove primers, dNTPs, and salts which otherwise compete with amplicons during the electrokinetic process. The removal of PCR reagents thus helps to improve allele signal intensity. For example, Smith et al. purified post-PCR samples using Microcon-50®, Montage PCR®, and Qiagen MinElute® Kit and found an increase in signal intensity compared to a standard unpurified PCR product.3 Post-PCR purification with the Qiagen MinElute® Kit produced a full STR profile with 78 pg of DNA and this technique resulted in a four-fold increase, on average, in signal intensity compared to unpurified samples. Forster et al. also utilized the Qiagen MinElute® Kit on post-PCR samples and found that purification yielded STR profiles which were similar in quality to those produced from the increased PCR cycle method.8 Purification techniques also concentrate the evidence sample. When a low-template target is present, concentrating the sample may allow for improved allele detection and higher confidence during comparison to a known.
After purification, what remains in the sample are the PCR products and the genomic DNA. Theoretically, this sample could undergo an additional
amplification with new PCR reagents. This process, known herein as ‘re-amplification’, means that an aliquot of the post-PCR product is re-amplified
with additional PCR reagents. Luo et al. examined the feasibility of using the re-amplification method by consecutively amplifying various DNA target lengths. They found that the process of multiple re-amplifications caused problems and
5
produced undesired results.12 The amplification of longer DNA targets was aborted earlier than shorter targets and it was hypothesized that the presence of partial strands of DNA was the cause. Specifically, the presence of amplicons existing in the PCR solution disturbed the polymerase extension process in successive re-amplifications. This in turn resulted in an increase of partial DNA strands as the full DNA target sequence was not successfully copied. The presence of amplicons within the PCR solution would continue to disturb recursive re-amplifications. Alternatively, amplicons created from the first amplification would also serve as a template with subsequent amplifications. Copies of the original amplified product would increase at a greater rate than the new amplicons creating peak height discrepancies during analysis.13
1.3. Implications of Sample Storage on DNA Analysis
Ensuring that low-template DNA samples are properly stored is important to enhance obtainable information. A forensic DNA sample may need to be re-examined, so it is vital to be able to retrieve the sample without compromised integrity.14 Many laboratories use polypropylene tubes for DNA analysis and storage because of their strength, low price, and resistance to solvents.15 Polypropylene is hydrophobic, which should minimize any interaction with a charged molecule such as DNA.15,16 Though these tubes are designed to prevent DNA loss, previous studies have suggested that significant levels of DNA adsorb to the tube walls, resulting in a reduction of recoverable sample.
6
Various mechanisms of adsorption to polypropylene tube walls have been suggested. This interaction could be due to surface tension forces which causes the adsorption.17 Alternatively, the DNA could be binding to a minor component within the polypropylene plastic.15 Studies have suggested as much as 75% of
DNA fragments, within highly ionic conditions, bound to polypropylene tubes within one hour while incubated at 37˚C.15 Other sources of ‘DNA loss’ may also play a role. For example, Davis et al. suggested that loss may be due to DNA degradation resulting from temperature fluctuations.18 They analyzed the degradation of short DNA fragments subjected to multiple freeze/thaw cycles and found that after eight cycles, only 55% of the strands were intact.
In an effort to minimize DNA loss, a reduction in DNA adsorption to the tube wall has been the focus of some manufacturers. As a result, manufacturers now offer products with low-retention capabilities. For example, Eppendorf® offers LoBind® tubes (Eppendorf®, Hamburg, Germany) which are made with the highest purity of polypropylene.19,20,21 Eppendorf® claims that using LoBind® tubes recovers 99.9% of DNA fragments under standard pH and temperature conditions and 99% of DNA fragments under high salt concentrations and incubation.22 Belotserkovskii et al. tested low-retention polypropylene tubes against standard polypropylene tubes and the effect they have on DNA denaturation. Radioactive double-stranded DNA fragments were incubated at 37˚C in various types of polypropylene tubes and the samples were analyzed after gel electrophoresis.17 The results indicated that the highest level of
7
denatured DNA was observed in the standard polypropylene tubes compared to low levels of denaturation within the low-retention polypropylene tubes. The study concluded that the standard polypropylene surface somehow induced DNA denaturation, although the mechanism is unknown. Low-retention or LoBind®
polypropylene tubes minimize the interaction between DNA and the tube surface. Implementing low-retention tubes into DNA analysis may prevent any unforeseen DNA loss and maximize DNA signal.
1.4. Recursive Amplification
Previous studies demonstrated that re-amplification of an aliquot of amplified work-product leads to suboptimal results. Thus, it is desirable to isolate the genomic DNA in order to re-amplify it without interference. A novel method capable of isolating genomic DNA from the amplicons and PCR components has been developed.23 This process allows for successful re-amplification of the
original genomic DNA sample without re-extracting from the evidentiary item. This provides an opportunity for limited samples to be analyzed multiple times with varying analysis kits or altered PCR parameters.
To remove amplicons from the PCR product, this project utilized Dynabeads® M-270 Streptavidin (Life Technologies, Carlsbad, CA). These magnetic beads have a layer of covalently bound streptavidin on the surface which captures biotin.24 Thus, if the primers utilized during forensic PCR processing are functionalized with biotin, then the amplicons can be sequestered by the beads from the genomic DNA. From a process perspective, a DNA
8
sample that has been amplified with the biotinylated primers is added to the streptavidin-coated beads where the streptavidin bind with the biotin. With the use of a magnet, the beads retract double stranded amplicons from the supernatant. As a result, the genomic DNA is retained within the supernatant and is available for further cleaning.
The second cleaning step involved within this process utilized Amicon® Ultra 50K Centrifugal Filter Devices (Millipore, Billeria, MA). As the sample passes through the filter, PCR components such as primers, dNTPs, and Taq Polymerase, are removed while DNA greater than 80 base pairs remains within the filter membrane.25 The DNA is then eluted and can be used for re-amplification directly. This two-step cleaning process isolates the DNA from the PCR products, regenerating it for future analysis.
1.5. Goal of the Study
The goal of this study is to continue to optimize the recursive cleaning and amplification method. Previous research has shown success with the overall method.23,26 Though the re-amplification process has resulted in successful recursive amplifications, previous results show there is a significant amount of DNA lost through the cleaning steps. This is attributed to both the bead and the filtration steps. During the bead clean-up step, it is hypothesized that the biotinylated primers anneal to the genomic DNA and pull the template out of solution. The DNA is also possibly adhering to the filter membrane and is not fully eluted. A significant retention of amplicons from the original amplification
9
has been exhibited. Previous research has shown there is approximately 27% TPOX amplicon retention left in the solution after the bead clean-up step.26 Prior work further elucidates that the TPOX peak observed after re-amplification is due to retained amplicons, rather than leftover primers from the first amplification reaction. Therefore, the retained TPOX peak can be attributed to incomplete TPOX amplicon removal by the beads. In response to the aforementioned issues, this study focused on reducing the DNA loss during the Amicon® filtration step. Impacts of modifying the filtration step were studied by evaluating the allelic peak heights within the recursive amplifications.
1.6. Importance of Recursive Amplification in Forensic Analysis
The purpose of this project is to continue the development of a method to isolate original genomic DNA after it has undergone PCR amplification. Sequestering the original sample from the PCR components would provide the forensic analyst the opportunity to analyze samples recursively without the need to re-extract DNA from evidentiary samples. If successfully developed, recursive amplification would have a significant impact on criminal justice practice as many samples obtained from crime scenes contain low numbers of cells and may be exhausted during analysis. With this process, samples which otherwise could have only undergone a single analysis could be examined with multiple kits or varied PCR parameters and concentrations.
10 2. METHODS
2.1. Method Description
The method design and process development was established previously and a detailed description is available elsewhere.23,26
2.1.1. DNA Amplification
DNA amplification was performed using AmpliTaq Gold® DNA Polymerase kit reagents (Life Technologies, Carlsbad, CA) and the concentrations used were optimized experimentally.23 Each amplification contained 200 µM dNTPs, 2.25 mM MgCl2, 0.5 µM forward and reverse primers, and 0.025 U/µL AmpliTaq
Gold® DNA Polymerase. The TPOX locus was chosen for method development
with forward TPOX primers functionalized with biotin on the 5’ end and ROX fluorophores on the 5’ end of the reverse primers. The PCR cycle conditions were 95˚C for 10 minutes, 32 cycles of 94˚C for 1 minute, 58˚C for 1 minute, and 72˚C for 1 minute, followed by a 90 minute interval at 60˚C, and then held at 15˚C. This method design included three groups designated set A, B, and C, with each group containing three replicate samples and one negative control. Each sample was amplified using the aforementioned reagent concentrations and 2 ng of K562 DNA (Promega, Madison, WI). No DNA was added to the negative control in each set.
11
2.1.2. Dynabead® Cleanup
Once amplification was complete, set A was stored at -20˚C for future analysis while sets B and C were cleaned using Dynabeads® M-270 Streptavidin magnetic beads to remove the TPOX amplicons from the sample. The beads were prepared following the manufacturer’s recommended protocol and the binding and washing buffer utilized was made according to the manufacturer’s instructions.24 For each sample being cleaned, 20 µL of beads at a concentration of 6 x 10⁵ beads/µL were prepared within a microcentrifuge tube. The amplified samples from sets B and C were added to the beads, vortexed, and incubated at room temperature for 15 minutes while gently being swirled. The microcentrifuge tubes were then placed on a magnet for 3 minutes to separate the beads from the supernatant.
2.1.3. Amicon® Filtration
The samples were further processed using Amicon® Ultra-0.5 50K filtration units following the manual’s instructions.25 The centrifugation speeds were modified as per recommendations set forth by Iacona26 and Garvin et al.27 This step filtered out the remaining PCR reagents such as primers, dNTPs, etc., to theoretically leave only genomic DNA within the sample. The TE buffer was first added to the Amicon® filter, which was placed inside a collection tube. The supernatant present in the microcentrifuge tube after the beads were removed from solution was then added to the Amicon® Ultra-0.5 filter. The samples were centrifuged at 4,000 rcf for 50 minutes with the flow through discarded
12
afterwards. DI water was added to the filter and the samples were again centrifuged at 4,000 rcf for 50 minutes. This wash step was added to remove any excess TE buffer. The samples were collected by inverting the filter into a clean collection tube and centrifuged at 1,000 rcf for 2 minutes. The recovered sample volume was measured using a pipette and stored in a PCR reaction tube.
2.1.4. Dynabead® Elution
Dynabead® elution was conducted to collect the TPOX amplicons that were removed by the bead cleaning process. After the supernatant was transferred for the Amicon® filtration step, the beads remaining in the microcentrifuge tube for sets B and C were washed according to the manufacturer’s guidelines.24 The TE Buffer and Hi-Di formamide were added to the beads. The samples were placed on the heat block at 90˚C for 10 minutes and then on the magnet for 2 minutes to separate the beads and the supernatant. The heating step broke the biotin-streptavidin bond resulting in the TPOX amplicons being released into the supernatant which was collected and stored until further testing.
2.1.5. Re-amplification
After the Dynabead® and Amicon® steps, set B was stored for later analysis while set C was re-amplified at the D5S818 locus. The D5S818 primers were functionalized at the 5’ end with biotin on the forward primers and ROX fluorophores on the reverse primers. The same reagents were used as the
13
original amplification with concentrations previously optimized experimentally.23 Each amplification contained 200 µM dNTPs, 2mM MgCl2, 0.6 µM forward and
reverse primers, and 0.025 U/µL AmpliTaq Gold® DNA Polymerase. No DNA was added to the reaction but rather the DNA isolated within set C after the cleaning process served as the template for re-amplification. The samples were amplified following the same PCR cycling parameters as previously mentioned.
2.1.6. Agarose Gel Electrophoresis
The amplified samples from set A and the re-amplified samples from set C were analyzed with agarose gel electrophoresis stained with GelStar® Nucleic Acid Gel Stain (Lonza Inc, Walkersville, MD). Along with the samples, a 100 base pair DNA ladder (Promega, Madison, WI) was run on the gel and served as a size reference. The TPOX amplicon band was expected to be ~230 base pairs and the D5S818 amplicon band ~130 base pairs. The DNA bands were detected using an ultra violet light box and photographed with a Canon PowerShot A630 camera accompanied with a UV filter lens. Images were analyzed using an image processing software; ImageJ.28 With this software, each band’s signal intensity could be measured and compared.
2.1.7. Capillary Electrophoresis
As an alternative to gel electrophoresis, capillary electrophoresis was used to obtain more accurate signal and sizing measurements. The samples from sets A and C were prepared for capillary electrophoresis by adding 1 µL of
14
the amplified work-product along with 9 µL of a Hi-Di formamide (8.3 µL/sample) and GeneScan™-600 LIZ® Size Standard (0.7 µL/sample) (Life Technologies, Carlsbad, CA) mixture to the appropriate wells of a 96 well-plate. The plate was heated for 3 minutes at 95˚C and then immediately cooled at -20˚C for 3 minutes. Fragment analysis was performed using the 3130 Genetic Analyzer (Life Technologies, Carlsbad, CA) using a 5-second injection time at 3 kV. GeneMarker® HID (Softgenetics, State College, PA) software was used to analyze the results using an analytical threshold of 50 RFU.
2.1.8. Quantitative PCR
Set B was analyzed for DNA recovery after the cleaning process with quantitative PCR (qPCR) using the 7500 Real-Time PCR system (Life Technologies, Carlsbad, CA) and the Quantifiler® Human kit (Life Technologies, Carlsbad, CA). The genomic DNA stock used for the original amplification was also quantified. DNA percent recovery was calculated by multiplying the DNA concentration results from qPCR and the sample volume measured after the cleaning process. This was divided by the DNA mass used in the original amplification (determined by the DNA stock qPCR results) and multiplied by 100% to calculate DNA percent recovery. The following equation illustrates this calculation:
15 2.2. Method Optimization
2.2.1. Amplification Reproducibility
Commercial STR human identification kits are not utilized for amplification within this method process. Therefore, the variability associated with preparing an amplification reaction with biotinylated TPOX primers needed to be assessed. The amplification reagents were from the AmpliTaq Gold® DNA Polymerase kit (Life Technologies, Carlsbad, CA) which contained AmpliTaq Gold® DNA Polymerase, Gold Buffer, and MgCl2 solution. For the purposes of this
reproducibility study, several terms were coined:
Reaction mix = Gold Buffer, MgCl2, dNTPs, and DI water combined.
Amplification mix = reaction mix, forward and reverse TPOX primers, and Taq combined.
Sample amplification = amplification mix with 2 ng DNA added.
All of the reagents used within these various mixes follow the concentrations previously described for amplification in Section 2.1.1. This experiment was divided into three groups to analyze the variation that can occur within the different steps of preparing an amplification reaction.
Group 1 – Reaction Mix Reproducibility. Five separate reaction mixes
were created. Each one was used to make a separate amplification mix
16
Figure 1: Diagram of Sample Amplification Preparation for Group 1 – Reaction Mix Reproducibility.
Group 2 – Amplification Mix Reproducibility. One reaction mix was created and used to make five amplification mixes. One sample amplification was made from each amplification mix.
Figure 2: Diagram of Sample Amplification Preparation for Group 2 –
Amplification Mix Reproducibility.
Reaction Mixes Amplification Mixes Sample Amplifications Reaction Mix Amplification Mixes Sample Amplifications
17
Group 3 – Sample Amplification Reproducibility. One reaction mix was created and used to make one amplification mix. Five sample amplifications were made from this one amplification mix.
Figure 3: Diagram of Sample Amplification Preparation for Group 3 – Sample Amplification Reproducibility.
Once all of the sample amplifications were created, they were amplified following the PCR parameters described previously. They were all analyzed using the capillary electrophoresis settings previously described.
2.2.2. Reducing TPOX Amplicon Retention
To reduce the amount of TPOX amplicons retained in the supernatant after the bead cleaning procedure, a second bead cleaning was implemented. Two sets of four replicates were amplified with TPOX primers and 2 ng of DNA using reagent concentrations and cycle parameters previously described. One set was cleaned with beads and Amicon® filtration as previously described. After the second set underwent one bead cleaning, the supernatant was added to a
Reaction Mix
Amplification Mix
18
second set of prepared beads, cleaned following the same procedure, and then filtered with Amicon®. Both sets were re-amplified with D5S818 primers and then analyzed with gel electrophoresis. The signal intensities for the amplicon bands were determined with the ImageJ software.
2.2.3. Reducing Recovered Volume within Amicon® Filtration
Previously published experimentation with the Amicon® filtration process found a spin speed of 4,000 rcf resulted in higher DNA recovery than 14,000 rcf, which is recommended by the manufacture. 25,26,27 The lower spin speed also
increases the volume of the recovered sample from the filter (~20 µL). This volume is too large for the entire sample to be re-amplified and therefore needed to be reduced. It was hypothesized that a longer spin time before the sample recovery step would decrease the recovered volume. In order to assess this, 2 ng of DNA along with TE buffer was centrifuged in the Amicon® filter at
4,000 rcf for each of the following time intervals: 50, 80, 110, 140, and 170 minutes. Each time interval had three replicates. The samples were
recovered and measured as previously mentioned and analyzed with qPCR. The DNA percent recoveries were calculated for each of the five time intervals following Equation 1.
2.2.4. Amicon® Filtration with Evaporation
In order to reduce the recovered sample volume after Amicon® filtration, an evaporation step was implemented. Two sets of four replicates with
19
approximately 2 ng of DNA underwent Amicon® filtration as previously described in Section 2.1.3. Once the samples were recovered in the collection tubes, one set of samples was placed on the heat block at 70˚C for 20 minutes with the caps open. No heat was applied to the other set as it was used as a comparison group. Both sets were vortexed and spun before the volumes were measured. The samples were analyzed with qPCR and the DNA percent recoveries were calculated for each set utilizing Equation 1.
2.2.5. Effect of LoBind® Tubes with Amicon® Filtration and Evaporation
To test the efficacy of tube type with DNA recovery, LoBind® tubes were implemented into the Amicon® filtration and evaporation process. This method was divided into two sections: first, evaporation only and second, Amicon® filtration with evaporation. The first section involved adding 2 ng of DNA and 20 µL of DI water to Amicon® collection tubes and LoBind® tubes. The tubes
were then placed on the heat block at 70˚C for 20 minutes with the caps open. The samples were vortexed and spun followed by the volume being measured. The second section involved DNA being filtered as described previously in Section 2.1.3., but these samples were eluted into either Amicon® collection tubes or LoBind® tubes. Both sets of tubes underwent the same evaporation procedure as the first section. All of the samples from both sections were analyzed using qPCR and the DNA percent recovery was calculated with Equation 1.
20
The LoBind® tubes used within this experiment were too small for the inverted Amicon® filter apparatus to be placed inside. A Dremel rotary tool (Dremel, Racine, WI)29 with a grinding stone attachment was used to carve the inside of the tube approximately 0.5 inches down from the top. Once the inside diameter of the tubes was filed down to the appropriate size, the tubes were washed with DI water and dried with a sterile cotton swab.
2.3. Method Assessment
2.3.1. DNA Loss within Amicon® Filtration
To assess the loss of DNA within the Amicon® filtration process, four replicates containing 2 ng of DNA and TE buffer were filtered at 4,000 rcf for 50 minutes. The samples were recovered by inverting the filter into a clean collection tube and centrifuged at 1,000 rcf for 2 minutes. Both the flow through from the initial spin and the filter membranes were saved. The membranes were cut from the filter apparatus with a scalpel and cut into smaller pieces. Approximately ¼ of the Amicon® filter was added to an amplification reaction containing TPOX primers and reagent concentrations as previously described. An aliquot of the flow through was taken to be amplified with TPOX primers as well. After both the membrane and flow through were amplified, the samples were analyzed using capillary electrophoresis.
21
2.3.2. Effect of Freezing and Thawing Cycles on DNA Recovery
Six sets of tubes were created, each with four Amicon® collection tubes and four LoBind® tubes. In each tube, 20 µL of ~0.5 ng/µL was added. Sets 1-5 were placed in the freezer at -20˚C and set 6 was placed in the refrigerator at 4˚C. Sets 1-5 underwent cycles of freezing and thawing corresponding to their set number (set 1 – one freeze/thaw cycle, set 2 – two freeze/thaw cycles, etc.). Set 6 was stored in the refrigerator for 5 days. All samples were analyzed with qPCR after their respected freeze/thaw cycle or after the fifth day in the refrigerator.
2.3.3. Modeling Recursive Amplification at Multiple DNA Targets
Dynamic modeling is an effective and efficient tool that can be used to analyze complex processes. A model outlining the method described herein was previously created in STELLA® version 9.1.4 (ISEE Systems, Lebanon, NH).26
This model simulates the full process of genomic DNA amplified with TPOX primers, cleaned with Dynabeads® and Amicon®, and re-amplified with D5S818 primers. The input parameters that could be modified by the user were Input DNA (in ng), TPOX Amplicons Bound to Beads which represents the amount (in percent) of the amplified work-product that is removed by the beads, Primers on Beads and Filtered TPOX Primers which represents the amount (in percent) of unincorporated primers that are removed by either the bead step or the Amicon® filtration step, and DNA Loss on Beads and DNA Loss on Amicon® which represents the amount (in percent) of genomic DNA that is either bound to the
22
beads or lost in the filtration step and thus, not recovered. After re-amplification, the model converts the number of TPOX and D5S818 amplicons into a capillary electrophoresis peak height in RFU. The PCR efficiency for both the amplification and re-amplification was modeled as a normal distribution represented by (NORMAL(0.96,0.096)) – (1.94714x10⁻¹³ x Available_DNA) which is based on previous work in the laboratory.26 With this equation, the PCR efficiency decreases at a rate dependent on the number of amplicons (Available_DNA) produced from the previous cycle.
For the purposes of this project, the model was used to simulate recursive cleaning and amplification of genomic DNA. The settings for the simulations in this study had all of the TPOX amplicons from the initial amplification cleaned by the beads and the excess TPOX primers removed by the Amicon® filter. Therefore, no TPOX amplicons were retained after the cleaning process. Also, no DNA was removed by the beads but rather the only DNA loss was due to the Amicon® filtration process. In other words, TPOX Bound to Beads was set to 100%, Primers on Beads was set to 0%, Filtered TPOX Primers was set to 100%, and DNA Loss on Beads was set to 0%. Table 1 shows the varying parameter settings of Input DNA and DNA Loss on Amicon®.
23
Table 1: Parameters Used for Modeling the Effect of DNA Loss on D5S818 Peak Height with Recursive Cleaning and Amplification.
Input DNA (ng) DNA Loss on Amicon®
0.5 0%, 13%, 19%, 47%, 61%, 100%
0.25 0%, 13%, 19%, 47%, 61%, 100%
0.125 0%, 13%, 19%, 47%, 61%, 100%
0.07 0%, 13%, 19%, 47%, 61%, 100%
The percent values in Table 1, which were determined through laboratory experimentation, correspond to the amount of DNA lost with each recursive cleaning process and is discussed in Section 3.2.1. within this document. Ten recursive amplifications were simulated for each initial DNA input mass by taking the amount of DNA that would have been recovered after one cleaning and inputting that value for the next simulation. Each set of recursive amplifications at the varying DNA masses and loss percentages were simulated five times. The effects of these variables were measured by the output D5S818 peak height after re-amplification.
24 3. RESULTS AND DISCUSSION
3.1. Method Optimization
3.1.1. Amplification Reproducibility
The capillary electrophoresis results from the three reproducibility groups were assessed using peak height equivalency comparisons. The alleles for K562 DNA at the TPOX locus are 8 and 9 and therefore the peak heights for each allele were analyzed separately. Table 2 shows the peak heights of the TPOX 8 and 9 alleles for all amplifications.
Table 2: TPOX Peak Heights (RFU) from the Amplification Reproducibility Assessment.
Reaction Mix Amplification Mix Sample Amplification
Replicate Number
Peak Height (RFU) Peak Height (RFU) Peak Height (RFU)
8 9 8 9 8 9 1 1027 1613 1271 2100 1441 2357 2 1591 3290 1714 3165 1788 3000 3 1831 3543 1873 3227 1404 2478 4 2032 2773 1983 3353 2269 3888 5 1513 2914 1807 3349 1516 3029
Peak height equivalencies were calculated by dividing each of the sample RFUs by the highest RFU value within that respective group. For example, the peak height equivalencies for allele 8 in Group 1 – Reaction Mix (Table 2) were 1027/2032=0.51, 1591/2032=0.78, 1831/2032=0.90, 1513/2032=0.74 for replicates 1, 2, 3, and 5, respectively. Replicate 4 was excluded from the analysis as it would result in a peak height equivalency of 1. The same analysis
25
was performed for each allele within all three groups. The ratios were averaged and the results are shown in Table 3. Table 3 also exhibits the minimum and maximum peak height equivalencies obtained. Ratios closer to 1 show a high level of signal reproducibility between amplifications and therefore are taken to be an indicator of the reproducibility of the process.
Table 3: TPOX Peak Height Equivalency Ratios for the Amplification Reproducibility Assessment.
Average Equivalency Ratios Allele 8 (min-max) Allele 9 (min-max)
Group 1 – Reaction Mix 0.74 (0.51-0.90) 0.75 (0.46-0.93)
Group 2 – Amplification Mix 0.84 (0.64-0.95) 0.88 (0.63-0.99) Group 3 – Sample Amplification 0.68 (0.62-0.79) 0.70 (0.61-0.78)
The values in Table 3 show that Group 2 – Amplification Mix had the highest equivalency values for both the 8 and 9 alleles with 0.84 and 0.88, respectively. These values are closer to 1, compared to the equivalency ratio results from Groups 1 and 3, suggesting this group is more reproducible, but the ratios between groups are not statistically significantly different. Thus, the peak height variation observed was similar within all three groups. Because reproducibility differences were not observed between groups, whichever way the amplification reaction is prepared will not make a significant impact on peak height variation. For the purposes of this method, reaction mixes, which included Gold Buffer, MgCl2, dNTPs, and DI water, were created for both TPOX
26
amplification and D5S818 re-amplification and used for all subsequent experiments. It is also important to note the variation seen within the RFU values after the cleaning and re-amplification process is not solely due to the cleaning method but with the amplification process itself.
3.1.2. Reducing TPOX Amplicon Retention
A preliminary assessment was conducted to determine whether the number of TPOX amplicons retained within the sample after the bead cleaning process could be reduced. It is important that the TPOX amplicons are removed as they would interfere with any downstream recursive amplifications and profile interpretations. To assess if more TPOX amplicons could be removed, samples were cleaned with an additional set of beads to increase the opportunity for the streptavidin-biotin interaction to take place.
27
Figure 4 shows the signal intensity results from samples amplified with TPOX primers, cleaned with either one or two sets of beads, filtered with Amicon®, and then re-amplified with D5S818 primers. The left side of Figure 4 shows one bead cleaning and the right side shows samples cleaned twice with
One Bead Cleaning Two Bead Cleanings
Ladder 1 2 3 4 Ladder 1 2 3 4 A bp 500 300 200 100 B
Figure 4: Comparison of TPOX and D5S818 Signal Intensities between One and Two Dynabead® Cleanings. A) Image of samples on agarose gel after re-amplification. B) Graph representing the signal intensities analyzed through ImageJ. ( ) TPOX signal intensities. ( ) D5S818 signal intensities.
28
the streptavidin coated beads. The samples cleaned once with beads show a significant amount of retained TPOX amplicons with signals from half to over double the intensity of the D5S818 amplicon signal. The results indicate that one bead cleaning does not sufficiently remove the TPOX amplicons. When these results are compared with the samples cleaned twice with beads, shown on the right of Figure 4, there is a reduction in intensity of the TPOX band. However, samples 2, 3, and 4 show there is still presence of TPOX amplicons within the sample. Exposing the sample to an additional bead cleaning did increase the amount of streptavidin-biotin interactions but it was not enough to completely remove all of the TPOX amplicons.
More importantly, Figure 4 shows that the samples cleaned twice with beads exhibit a reduction in the D5S818 signal. No signal was observed in three out of the four samples. This suggests that the second bead cleaning is removing additional genomic DNA from the sample. With more genomic DNA removed by the beads, there is less template DNA used in the second recursive amplification and thus a decrease in D5S818 amplicon signal.
The process of an additional bead cleaning does reduce the amount of TPOX amplicons but also causes an increase in DNA loss. Therefore, a two-step bead cleaning process is not a viable solution to decrease the amplicon retention. There could be myriad reasons the genomic DNA is lost during processing. It is hypothesized that one of these reasons is that biotinylated
29
primers anneal to the genomic DNA and this complex is pulled out of solution by the beads.
Previous research developed a dynamic model describing the melting temperatures of the streptavidin-biotin bond, biotinylated primers annealed to genomic DNA, and double stranded amplicons.23 The purpose of the model was to find a temperature that would maximize denaturation of the primers annealed to genomic DNA while minimizing the disassociation of both the amplicons and the streptavidin-biotin bond, as all of melting temperatures of these complexes are different. If a post-amplification sample was incubated at such a temperature, it would decrease the amount of genomic DNA pulled out of solution by the beads as the biotinylated primers would be denatured from the DNA. The results found that a temperature between 85˚C and 95˚C would melt only the primers and genomic DNA without disturbing the amplicons or biotin bond. However, empirical results suggest the streptavidin-biotin bond is sensitive to harsh conditions. Incubation at 90˚C for 2 minutes may dissociate a significant portion of the biotinylated amplicons from the streptavidin.24 Because this bond may not be able to withstand the temperatures needed to disassociate the primers from the genomic DNA, as outlined by the model results, utilizing melting temperatures may not decrease the loss of genomic DNA to the bead cleaning process.
30
3.1.3. Reducing DNA Loss with Amicon® Filtration and LoBind® Tubes
Although previous research found a lower centrifugation spin speed with Amicon® filtration did improve DNA recovery, it also increased the recovered volume to ~20 µL. For re-amplification of the entire sample, a recovered volume of 11 µL or less is considered optimal. Utilizing the full amount of low-template DNA extract would ensure that the maximal peak detection is occurring for the given process. Therefore, in an effort to decrease the volume recovered during filtration, spin times were increased from 50 minutes to 170 minutes in 30 minute intervals. Each spin speed was tested in triplicate.
Figure 5: Effect of Amicon® Spin Time on DNA Recovery (%) and Recovered Volume (µL). ( ) Spin Time (minutes) versus DNA Recovery (%). ( ) Spin Time (minutes) versus Recovered Volume (µL). Error bars represent ± two standard deviations.
31
Table 4: DNA Percent Recovery and Recovered Volume with Varying Amicon® Spin Times.
Amicon® Filtration Spin
Time (minutes) Average DNA Percent Recovery ± 2SD Average Recovered Volume (µL) ± 2SD
50 86 ± 31% 20 ± 4
80 88 ± 39% 20 ± 8
110 86 ± 43% 18 ± 2
140 63 ± 16% 17 ± 1
170 50 ± 9% 17 ± 0
Figure 5 and Table 4 show that as the spin time is increased using the 4,000 rcf spin speed, the average recovered volume stays relatively the same. There is a slight decrease in average recovered volume from 20 µL for the 50 minute spin to 17 µL for the 140 and 170 minute spins. This is not a large enough decrease for the purposes of re-amplification. In addition, there is a noticeable 36% average decrease in DNA percent recovery between 50 minutes and 170 minutes, which may be the result of the increase in the amount of time the sample is in contact with the filter.25 When the filter membrane and flow through were analyzed as described in Section 2.3.1., no DNA was detected. It should be noted that the absence of DNA signal after amplification is not substantive evidence to suggest DNA is absent from the membrane or the flow through. Any DNA adsorbed to the membrane within the amplification reaction would need to be capable of amplifying and any DNA within the flow through may have been too dilute to detect. Further, the amplification of DNA which is adsorbed on the filter membrane requires that solid state amplification is successful and that there is not a significant level of steric hindrance. Thus, the
32
absence of detectable amplified DNA does not prove the absence of DNA on the membrane; however, positive detection of DNA would have proven DNA was present on the membrane. The pore size of the Amicon® filter membrane used within this method is small enough to prevent genomic DNA from passing through. Though the specific mechanism that explains why DNA recovery decreases with increasing spin times is yet unknown, the longer spin time decreased DNA recovery and did not decrease the recovered volume. Therefore, the spin time of 50 minutes at 4,000 rcf remained within the overall protocol.
Because the longer spin time with Amicon® filtration did not reduce the recovered volume, an evaporation step was implemented to reduce the sample below 11 µL for re-amplification. After the filtration process, the samples were placed on the heat block at 70˚C for 20 minutes. The caps were left open to allow the liquid to evaporate.
33
Figure 6 shows when evaporation was added after filtration, the recovered volume did decrease from an average of 24 µL to 11µL. This volume is acceptable for re-amplification but evaporation also caused an average DNA recovery decrease of 27%. It was hypothesized that DNA adsorbed to the side of the Amicon® collection tube as the heat was applied and the volume decreased. The collection tubes are made of polypropylene and although this hydrophobic material should not interact with a charged DNA molecule, literature has suggested adsorption does occur.15,17 It has been suggested that DNA is either binding to the polypropylene or a minor component within the plastic.
Interestingly, the evaporation step resulted in a decrease in DNA recovery, suggesting that the heat either increases the adsorption rate of reaction, or as Figure 6: DNA Recovery after Amicon® Filtration with and without Evaporation.
( ) DNA Recovery (%) with and without evaporation. ( ) Recovered Volume (µL) with and without evaporation. Error bars represent ± two standard deviations.
34
evaporation occurs, DNA is reaching critical mass and adsorbing in high density layers onto the surface of the plastic. The phenomenon of critical mass deposition onto solid state surfaces has been observed with glycoproteins and mica surfaces.30 Younes-Metzler et al. studied the surface patterning of antifreeze glycoproteins as a drop of concentrated solution was dried on mica inside a closed desicator at room temperature. They reported that as evaporation occurred, patterns of periodic lines of single proteins remained on the surface. The frequency and density of the lines increased with a more concentrated sample. This pattern formation could also be occurring inside the Amicon® collection tube as heat is applied. Regardless of the mechanism of DNA loss, the Amicon® collection tubes, made of polypropylene, seem unsuitable for reducing the sample volume with evaporation due to this interaction.
Because the interaction between DNA and the polypropylene surface reduces sample recovery, manufactures now provide low-retention tubes which reduce this interaction. LoBind® tubes were then studied for purposes of optimizing the method as it is claimed that these tubes provide 99.9% DNA recovery under standard conditions.22 These tubes are also made of polypropylene but are manufactured with specially developed technology and ultrapure materials.20 There is no coating within the tube but the purity of the polypropylene decreases DNA loss due to adsorption. Because the LoBind® tubes are designed to prevent DNA adsorption, they were tested against the Amicon® collection tubes for the filtration and evaporation process. They were
35
compared for DNA recovery with evaporation alone and with evaporation and filtration combined.
Figure 7 shows the DNA percent recoveries for both Amicon® collection tubes and LoBind® tubes for the filtration and evaporation experiment. The left side of the graph shows the DNA recoveries for evaporation alone while the right side shows the recoveries for filtration and evaporation. When examining the data for evaporation alone, Amicon® collection tubes had an average of 75% DNA recovery while the LoBind® tubes displayed 109% average DNA recovery. Thus, the design of the LoBind® tubes helped prevent DNA adsorption within the evaporation step and performed better than the Amicon® collection tubes.
The right side of Figure 7 shows better performance from the LoBind® tubes when the filtration step was added. The Amicon® collection tubes resulted Figure 7: Comparison of DNA Recovery between Amicon® Collection Tubes and LoBind® Tubes. ( ) Amicon® Collection Tubes. ( ) LoBind® Tubes. Error bars represent ± two standard deviations.
36
in an average of 39% DNA recovery compared to the average 87% DNA recovered from the LoBind® tubes. There is a higher variation within the data when the filtration and evaporation steps are combined. This could be attributed to the interaction between the DNA and filter membrane and the adsorptive losses discussed previously. There is also variation associated with DNA recovery and tube adsorption. Gaillard et al. studied the percentage of DNA adsorption within various types of tubes. They tested this by incubating 1 ng of radioactively labeled DNA in high ionic strength solutions at 37˚C for extended periods of time in polypropylene, polyethylene, and polyallomer tubes.15 After incubation, the solution was removed from each tube and the radioactivity adsorbed to the tube was counted. They found that DNA recovery varied between 5 and 95% in one type of polypropylene tube which was also similarly observed in the polyethylene tubes. Minimal DNA adsorption was seen with the polyallomer tubes and the low-binding tubes they tested. The percentage of DNA adsorption to plastic tubes varies between tube type and also within certain types of polypropylene tubes.
Overall, utilizing LoBind® tubes for evaporation is important. The evaporation step is needed to reduce the volume of the sample for re-amplification and this cannot be carried out within the Amicon® collection tubes. Both types of tubes tested within this study are made of polypropylene but the methods by which the tubes are manufactured have a significant impact on DNA recovery. The process of carving the tubes is also a necessary step as the
37
Amicon® filter does not fit in the currently available LoBind® tubes. When working with low-template samples, utilization of low-retention tubes is imperative as the stochastic nature of DNA loss is suspected to play a significant role in allele drop-out, which in turn has a significant effect on DNA interpretation and human identification.31 If recursive amplification is to be used, recovering and evaporating the sample in a LoBind® tube after filtration is appropriate and may be deemed necessary. Because LoBind® tubes outperformed the Amicon® collection tubes, they were implemented into the overall protocol for the sample recovery spin of 1,000 rcf for 2 minutes.
Because the application of heat demonstrated a difference between the two different tube types, it was decided to assess if freezing and thawing cycles would also result in decreased DNA recovery, either in general or between tube types. Previous literature has suggested that samples undergoing multiple freeze/thaw cycles, as well as those stored as liquid extracts in the refrigerator, resulted in decreased DNA sample recovery.32 To test this, aliquots of approximately 0.5 ng/µL DNA samples were placed in both Amicon® collection tubes and LoBind® tubes. These tubes underwent multiple freeze/thaw cycles or were placed in the refrigerator for five days.
38
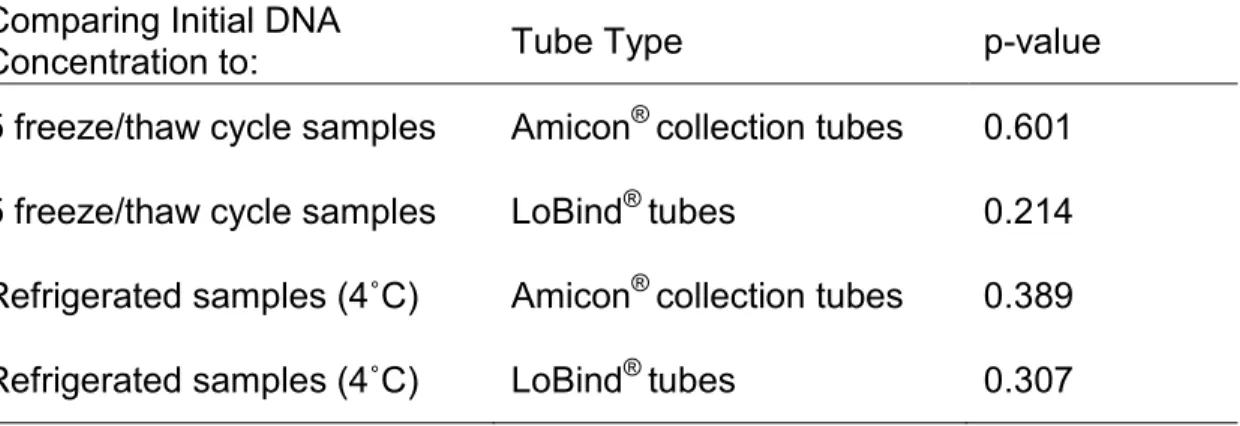
Figure 8 displays the results from qPCR for both Amicon®collection tubes and LoBind® tubes after undergoing varied number of freeze/thaw cycles. The initial DNA concentration used for experimental set-up was also quantified and was 0.41 ng/µL, which is represented by the dashed line in Figure 8. Two-tailed unpaired t-tests were performed between the two tube types within each set. No significant difference was observed between Amicon® collection tubes and LoBind® tubes at each freeze/thaw cycle or within the refrigerated samples. Within each tube type, results from the fifth freeze/thaw cycle and the refrigerated samples were compared to the initial DNA concentration using a two-tailed unpaired t-test. Table 5 displays the p-value results from these comparisons.
Figure 8: Effect of Tube Type and Freeze/Thaw Cycle Number on DNA Concentration (ng/µL). ( ) Amicon® Collection Tubes. ( ) LoBind® Tubes. Error bars represent ± two standard deviations. 4˚C represents the samples placed in the refrigerator for five days. The dashed line represents the DNA concentration (0.41 ng/µL) utilized in experimental set-up.
39
Table 5: Comparing Results from the Fifth Freeze/Thaw Samples and the Refrigerated Samples to the Initial DNA Concentration.
Comparing Initial DNA
Concentration to: Tube Type p-value
5 freeze/thaw cycle samples Amicon® collection tubes 0.601
5 freeze/thaw cycle samples LoBind® tubes 0.214
Refrigerated samples (4˚C) Amicon® collection tubes 0.389
Refrigerated samples (4˚C) LoBind® tubes 0.307
The comparisons displayed in Table 5, when using a critical p-value of 0.05, are not statistically significantly different. These results indicate that there was no significant difference in DNA concentration between the initial experimental set-up and after five freeze/thaw cycles or after storage in the refrigerator for five days. With these results, it cannot be concluded that continued freeze/thaw cycles or refrigeration storage will reduce DNA recovery.
As discussed previously, Davis et al. found DNA degradation after multiple freeze/thaw cycles.18 Short DNA fragments in DI water were placed in centrifuge tubes and subjected to repeated freezing at 0˚C and thawing at room temperature. They found that after eight freeze/thaw cycles, only 55% of the strands were intact. In contrast, Ross et al. studied the effects of freeze/thaw cycles on genomic DNA degradation and subsequent profile results.33 Extracted DNA stored in TE buffer was frozen with dry ice and thawed at 37˚C and the DNA yield was determined through absorbance at 260 nm. They found that after
40
forty freeze/thaw cycles the DNA did not seem to be affected and there was no decrease in the number of bands observed with Southern blot analysis. This suggests that though the overall quantity of DNA may not change with temperature cycling, the quality of the DNA is affected. The effects of freeze/thaw cycles on the stability of the double stranded helical structure were studied and it was found that the structure does not break down.34
With regard to this recursive method, freezing and thawing the sample after it has been recovered from the Amicon® filter is not expected to cause a reduction in DNA recovery. Also, if a cleaned sample is stored in the refrigerator during the analysis process, the DNA recovery should not decrease. For low-template samples, for which this method would be used, this is desired. Thus, if a sample is to undergo multiple recursive amplifications, minimal DNA loss during storage is the expectation.
3.2. Method Assessment
3.2.1. Modeling Recursive Amplification at Multiple DNA Targets
Dynamic modeling was used to simulate the impact of DNA loss within the Amicon® filtration and evaporation process on recursive cleaning and amplification. The DNA loss used within the model parameters came from the laboratory results displayed in Figure 7 in Section 3.1.3. The values used represent the average, the upper second standard deviation value, and the lower second standard deviation value for both Amicon® collection tubes and LoBind®
41
tubes within the filtration and evaporation experiment. Table 6 outlines these values.
Table 6: Parameters Used for Modeling the Effect of DNA Loss for Amicon® and LoBind® Tubes.
DNA % Loss per Cleaning
+2SD Average - 2SD
Amicon® Collection Tubes 19% 61% 100%
LoBind® Tubes 0% 13% 47%
These values essentially represent the best, worst, and average outcomes for recursive amplifications with the lowest DNA loss per cleaning being ideal. The varied values of DNA loss (Table 6) were used for the initial DNA masses of 0.5, 0.25, 0.125, and 0.07 ng. Graphs were generated (Figures 9 and 10) from the model simulations showing the effect of the number of sample cleanings on the D5S818 RFU signal. The data points for the simulations ran for the various
Input DNA and DNA Loss on Amicon® values are displayed by the unfilled shapes and the average of the simulation values are shown with the filled shapes. The results of the simulations only take into account the DNA loss due to the filtration and evaporation steps and do not include loss from the beads. Thus, the following graphs do not describe the results that would be seen if the full cleaning process was used, but they assess the impact plastic wear and the filtration process would have on final DNA signal results.
42 A B B C D
Figure 9: Effect of Number of Cleanings on D5S818 Peak Height (RFU). A) Amicon® Collection Tubes, 0.5 ng initial DNA mass. B) LoBind® Tubes, 0.5 ng initial DNA mass. C) Amicon® Collection Tubes, 0.25 ng initial DNA mass. D) LoBind® Tubes, 0.25 ng initial DNA mass. ( ) +2SD DNA loss. ( ) Average DNA loss. ( ) -2SD DNA loss.