ELECTRICAL ENGINEERING
A demand response modeling for residential
consumers in smart grid environment using game
theory based energy scheduling algorithm
S. Sofana Reka
*, V. Ramesh
School of Electrical Engineering, VIT University, Vellore, India
Received 28 July 2015; revised 10 December 2015; accepted 12 December 2015 Available online 5 January 2016
KEYWORDS Smart grid; Demand response; PAR; Game theory; Tariff
Abstract In this paper, demand response modeling scheme is proposed for residential consumers using game theory algorithm as Generalized Tit for Tat (GTFT) Dominant Game based Energy Scheduler. The methodology is established as a work flow domain model between the utility and the user considering the smart grid framework. It exhibits an algorithm which schedules load usage by creating several possible tariffs for consumers such that demand is never raised. This can be done both individually and among multiple users of a community. The uniqueness behind the demand response proposed is that, the tariff is calculated for all hours and the load during the peak hours which can be rescheduled is shifted based on the Peak Average Ratio. To enable the vitality of the work simulation results of a general case of three domestic consumers are modeled extended to a comparative performance and evaluation with other algorithms and inference is analyzed.
Ó2015 Faculty of Engineering, Ain Shams University. Production and hosting by Elsevier B.V. This is an open access article under the CC BY-NC-ND license (http://creativecommons.org/licenses/by-nc-nd/4.0/).
1. Introduction
In today’s world, the power sector is facing many difficulties due to growing consumption, aging of infrastructure and rising costs. Smart grids promise the energy producers and con-sumers for a reliable and efficient power system. To impose
this idea into real time, several aspects need to be imposed such as proper communication system between consumers and util-ity providers and efficient energy management to control the system in proper working condition. Metering and billing have to be carried out astutely, as the consumers may be charged for their non-linear load usage. Residential consumers may end up with new tariffs where they will be charged for different types of power usage. Hereafter consumers have to be tech savvy for being economic and environmental friendly. This aspect leads to the concept of Demand Response (DR)[1–3]to play its key role in electricity markets. Demand side management (DSM) refers to programs implemented by utility companies to con-trol the energy consumption at the consumer side[1–3]. The requirements between the energy provider and the customer are coordinated by the Demand Response (DR) strategy [2–6]. The strategy emboldens the customer to reduce the
* Corresponding author at: School of Electrical Engineering, VIT University, Vellore 632014, Tamil Nadu, India. Tel.: +91 9585285991. E-mail addresses:[email protected](S. Sofana Reka),vramesh@ vit.ac.in(V. Ramesh).
Peer review under responsibility of Ain Shams University.
Production and hosting by Elsevier
Ain Shams Engineering Journal (2016)7, 835–845
Ain Shams University
Ain Shams Engineering Journal
www.elsevier.com/locate/asej
www.sciencedirect.com
http://dx.doi.org/10.1016/j.asej.2015.12.004
2090-4479Ó2015 Faculty of Engineering, Ain Shams University. Production and hosting by Elsevier B.V. This is an open access article under the CC BY-NC-ND license (http://creativecommons.org/licenses/by-nc-nd/4.0/).
peak-demand in response to the incentives. By incorporating DSM techniques at the distribution end of the power system the gap between supply and demand can also be reduced. The major objective of DSM is to encourage customer to participate in schemes to reduce peak demand and shifting the load. One such mechanism is DR, in which the system allows end users to alter their load pattern to reduce the overall peak of the system.
A complete survey on demand response in smart grid with exhaustive analysis of mathematical problems is resolved for future extensions of DR using hierarchy game[2], and coupled constraint game is elucidated. For future aspects, complete analysis and structure of DR schemes start from policies, pro-grams initiated, potential benefits, control devices for demand response, and smart technologies for the scheme. The commu-nication technologies, different monitoring systems, and han-dling loads in a smarter approach are explained in a nutshell [3,6,7]. The future aspects of the DR are potentially explained by the methods of tracking with advanced control theory with new controllers and optimization methods are elaborated. In recent years, the effective emphasis on game theory approaches on DSM techniques for energy scheduling in residential users had been modeled in different strategies [9–15] with respect to solutions done by heuristic optimization[22]and linear pro-gramming techniques [23]. Hitherto, various approaches of game theory approaches on demand side management are ana-lyzed and modeled depicting the major concern of utility user interaction, customer benefits and effective energy scheduling development for reduction of cost. Noncooperative game model considering the channel impairments by developing dual optimality conditions is proposed in[8]. It exhibits differ-ent objective functions among the users and the utility by assuming a DSM game. In paper [9] the author formulates energy scheduling problem for residential consumers using coupled constraint game. In this the solution is handled by two cases by temporally coupled constraint. An evolutionary non cooperative game for the users and utility is observed with different constraints of power in a two level game[10]which is analyzed as multiple time constraints are not considered. User comfort in DR is modeled in[11]as a simple approach with a game based on modified regret matching procedure and bor-rows with the users for reducing the energy bill. A mathemat-ical optimization technique and game theoretic approach are analyzed by the concept of incentive based management pre-sented in [12,13] both for centralized and decentralized schemes. Interaction among the users is formulated in[14]as a repeated game chain in order to solve the issue of discomfort with a game strategy of incentive compatible obtain joint com-fort and billing cost minimization. In the proposed games [15,16]authors deal with aggregate game handling to improve the behavior of selfish consumers using proximal point algo-rithm[15] and cheat proof analysis[16]. In [18] Stackelberg game is approached in order to reduce total in convinces cre-ated in consumers achieving load curtailment. Different strate-gies using game theory approaches and other programming analysis have been analyzed in the past literature exhibiting new strategy for the way of minimizing cost for the consumers and maximizing the peak to average ratio (PAR) for the utility. The strategy used in the past literature exhibits all the versatil-ity of cost minimization, considering tariff schemes, comfort of users and also maximizing PAR. Thoroughly analyzing and understanding the past literature, the authors proposed a novel
concept of indulging a situation of DR congestion case with a strategy of reducing cost and maximizing profit. There is a possibility of the DR scheme to go in vain. This strategy is used by incorporating a new algorithm for exhibiting the real-ization to minimize cost and maximize profit among the users and utility.
The motivation behind using game theory approach on demand response modeling is the understanding of communi-cation between two sources of utility and user. Generalized Tit for Tat (GTFT) based method can reduce the cost between dif-ferent users which effectively adjourns the case of DR conges-tion. Tit for tat is traditionally defined as a game played between two players. As in for many players and for highly interact able environment, a better strategy is required. On this effect it is reasonable to model the scheduling by incorporating a cooperative game. In the proposed work the authors handle GTFT mechanism to model the energy scheduling problem in DR modeling. The main objective is to minimize cost and max-imize PAR of the utility.
The main contributions of the model are as follows: A generalized tit for tat based cooperative energy
schedul-ing game is proposed in a smart grid environment. A very simple and feasible solution is obtained by handling
the cost reduction and PAR maximization overall. Extensive simulations are carried out by developing this
algorithm in hold with the strategy of win stay lose shift for the consideration parameter of managing DR congestion.
The past literature has invoked different algorithm approaches considering the cost, comfort and PAR. The condition of DR congestion is not handled. However devel-oping a DR scheme is necessary in a smart grid environ-ment for energy savings. But the necessity of holding the scheme is successfully evaluated in this algorithm using mainly the strategy done by the consumers.
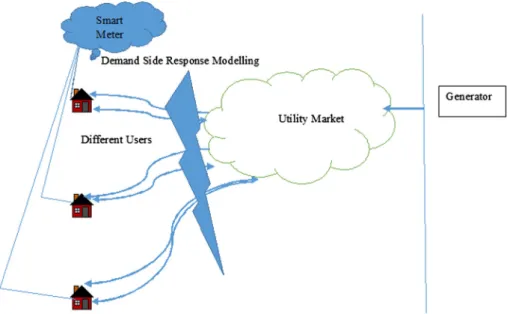
Fig. 1 exhibits the hand in hand gesture of information technology and electrical scenario in the present technological generation. This enables the utility and the users to actively engage in these DR programs. In this paper a new methodol-ogy is proposed between the utility provider and the user using game theory decision making strategy. The main objective is to develop a DSM using a game theory algorithm providing dif-ferent optimum pricing schemes for each user under the utility provider. The algorithm depends basically on each user decid-ing on their own winndecid-ing strategy and secondarily on all other participant individual decisions. Furthermore, in order to reduce demand, the utility company will announce the demand period. Hence users will avoid using loads at peak time using DR programs. Consider a situation where electricity is cheap at 10:00 am. Most customers will switch on their appliances at this time thus increasing the demand and thereby defeating the purpose of DR program. Simulation results with MATLAB and computational simulation domain show the effectiveness of the decision making scheme by the consumers with utility provider and work dynamically for different anal-ysis of user profile.
The outline of this paper is structured as follows. Section2 explains the background of game theory and the proposed methodology. The flowchart and implementation steps of methodology with problem statement with mathematical
model are presented in Section3. Simulated results and evalu-ation of performance comparison are given in Section4.
2. Game theory – demand response modeling
Game theory is a strategic decision making tool of situations involving a number of players aspiring for different purposes. Mostly, it is the study of mathematical models of conflict and cooperation between intelligent rational decision-makers [2,17]. It is a formal analytical method with strategic decision making imbibed with a set of mathematical models empower-ing the study of complex interactions among independent rational players [19,20,15]. In the literature [12–16]the game theory decision making strategy proposed portrays energy scheduling with cost reduction using different player’s strategy with the utility. In game theory, the players of the game are the main invaders to make decisions, and they are involved to par-ticipate in a game for the achievement of getting maximum benefit in a suitable action. So the main elements in a game are players, information, strategy and payoff functions. In our smart grid environment, the task of competition is a game played among ‘N’ consumers considered as players. So the basic elements considered are the player setN: the set of all consumers/users.
In the strategy of Tit for Tat wherein it is a game among the players who attain the final Nash equilibrium wherein if both cooperates there is a success in the game and they receive a payoff which is an extended version of Prisoners dilemma. As such in this cooperation rather exhibits as an option if the game is repeated. Later, the strategy of Generalized Tit for Tat (GTFT) is among players for instinct when both play-ers cooperate, if one defects the other cooperates with a prob-ability. Moreover among the players, it is an evolution of forgiveness as the win stay, lose shift. This concept is used in the algorithm of DSM model as such the players are the consumers and hold different payoffs by developing a utility function. The strategy is depending upon the move they play as the tariff generated or the reward they obtain. The
motivation of using this game in this concept is that the con-sumers play among a network between the users and they try to cooperate best among the other consumers by scheduling the load. The utility target of minimizing the PAR and the user to minimize the cost. If among the players, who reach the first target wins the game whereas the other shifts the game.Fig. 2 shows the pictorial representation of game strategy.
The game theory strategy is analyzed under the assumption that each player cares only about himself. GTFT is a strategy of win stay and lose shift as mentioned in[24–27], used as a multiplayer domain. In the proposed game, users are players and the strategy is the usage of appliances and scheduling them according to climatic conditions and user preference by defin-ing the energy scheduldefin-ing vector. Optimal performance in terms of energy cost minimization is achieved by this GTFT scheduling game. The proposed game model simultaneously manages the appliance’s schedule calculated for all hours and shifts the load during peak hours based on the PAR value. If the value is less the cost will be less and hence the user will obviously try to use the shiftable appliances at that time. And further shifting of loads to non-peak hours considerably leads Figure 1 Demand side management perspective in the present electrical scenario.
Tif for Tat GTFT
Always cooperate Always defect
Win stay Lose shift
to DR congestion. This algorithm handles the former case. For optimal scheduling of appliances, the game is subdivided into two parts which has been clearly explained in Section 3. Fig. 3 explains typically the DR congestion happening in non peak hours.
3. System model
The expected change in houses after complete implementation of smart grid and smart meters at the consuming side includes communication and embedded control. Using these two avail-able technologies, applying the approach of generalized tit for tat, game theory concept will ensure that the above stated problem is reduced considerably. It can also be applied to very large scale consumers since the technique is versatile. Consider a situation that involves a utility company and several residen-tial consumers. The utility company first estimates the electric-ity demand for the next hours and sets the price for different hours. Then, the utility company advertises these prices to the customers over the supporting digital communication net-work. Then, each user optimizes its energy consumption by adopting the best scheduling for its appliances based on this received price information from the utility company.
This proposed technique uses the game theory based algorithm which will provide different optimum pricing for each user under a utility. The algorithm is based on Non-Cooperative game where one’s decision depends primar-ily on his strategy and secondarprimar-ily on all other participant’s individual decisions. The control flow of the complete method-ology with flowchart has been described as in Fig. 4. The methodology is based on dominance game played by the user. It is divided into two categories. The first part includes the util-ity side tariff generation. The second part is based on the demand developed by the entire unit of consumers; the utility generates various tariffs for different hours in one day. This is given as a day ahead schedule to the user. The user shall modify distribution toward the hour where the tariff is low. Their next day ahead schedule will be updated with more number of hours consisting minimum rate and vice versa. The Proposed methodology as in demand response modeling incorporates the strategy assuming the players as consumers and the scheduling of shift able and non-shiftable appliances in a domestic consumer. The analysis is shown in Table. 1 and corresponding calculations have been done with three users and further it is simulated fornusers.
The steps involved in the algorithm were given as follows:
Step 1: Get appliances’ schedule for H hours. For each
appliancea2A, an energy consumption scheduling vector is defined as
Xn;a¼ ½x1
n;a. . .x H
n;a ð1Þ
Step 2:Compute the load of the usernas
Figure 3 Consumption accumulation at non peak hours. Demand time info from
the supply
Intimation from Utility
Initialise the algorithm (Game theory)
Randomly choose users
Inform Users
Update
Initialise the algorithm (Game theory)
Choose loads to reschedule
Any change
Mark, Update and choose next user Start Start End End No Yes Yes No UTILITY USER Any changes Yes No
Figure 4 Flowchart of the model exhibiting the general work flow between the utility and the user incorporating game theory algorithm.
Table 1 Random load power generated in per unit value.
Domestic users Hour 1 Hour 2 Hour 3 Hour 4
User 1 0.7094 0.6797 0.119 0.3404
User 2 0.7547 0.6551 0.4984 0.5853
Loadhn¼X a2An
xhn;ah2H ð2Þ
whereH= overall load of each hour of a day i.e., 24.
Step 3:Determine the minimum load usage of the
individ-ual house.
Step 4:Schedule the appliances array in a matrix form with
a strategySiwhere each row ofSiisxn;aconsidering the user domain and same strategy is analyzed to three houses and stored as winning strategy Ws, as the process can be extended to multi users.
Step 5:Add load profile for small unit of houses. Sample up
to 10 houses and extendable to n number of houses are calculated.
Step 6:Determine the time for which the value of the load
profile which gives minimum power usage.
Step 7: Reschedule the appliances vector Eq. (1) to the
determined minimum usage hour.
Step 8: The obtained vector is stored as user’s strategy.
Step 9:Compare the vector with winning strategy, which
exists as in final Nash equilibrium stage. The final utility payoff function set asui with the different strategies held by the consumers asSiand set of n number of them exhibit-ing an inequality function for all players and strictly follow-ing their strategy profile.
uiðsi;s!iÞ>uiðsi;s!iÞ;8si2Si ð3Þ
Step 10:In accordance with that the new winning strategy
is updated with the obtained vector. If the latter dominates and the process continues with the procedure involved in the utility and the user flow. Thus by arranging the demand hours and load in ascending order for individual consumers and updating the appliance array based on minimum hours array.
Finally individual tariff for each consumer is evaluated cre-ating a winning strategy of win stay and lose shift.
3.1. Mathematical model – formulation of game
To analyze the proposed model, the customers participate in the energy scheduling game at each round with the process of achieving the final winning strategy. A set of reactive strate-gies are obtained by GTFT depending upon the behavior of each player which depends on their previous move. The strat-egy of scheduling the appliances is formulated by the proposed game. The players schedule the appliances following the game strategy and obtain utility payoff with reducing cost so they repeat the move. The player fails to follow the rule of reducing the cost, lose the game and shift the move in another round with the concept of win stay and lose shift. The stages are fol-lowed with cooperation and defend. The clear mathematical model is explained to obtain the winning strategy with the tit for tat game. A cost effective energy consumption scheduling is done by the process of minimizing the cost with respect to all the residential appliances in the system. The game analysis for strategy is explained in the following model:
Game¼ ½No of usersn;ðSn iÞ;ðuiðs1;s2. . .snÞÞ ð4Þ min 8n2N XN n¼1 XH h Cn tfðhÞ ð5Þ
which is the mathematical model of GTFT in the process of developing a cost efficient model with holding different con-straints. To characterize the selection process, the residential users inhibit the behavior of choosing a utility companyjto obtain power for every slot. The users follow their strategy to behave independently. As the number of consumers under each utility provider is considered asN, the analytical deriva-tions of obtaining Nash equilibrium of the game are derived using the GTFT general strategy for the target of minimizing the cost. From the strategySthere exists a winning strategy Wswhich converges at the Nash equilibrium stage to maximize the individual payoff function. The strategy in GTFT game follows that at each round, the consumer(player) actions depend on the winning load profile with a probabilitypi. There can be considered different reactive strategies at every roundti which does not have any effects on the incentives obtained in other roundtiþ1.
The strategySiis followed by each playern2Nin the game as such for everytiþ1P1 andhðti1Þ 2Hwith the following observation of behavior of game:
Siðhðti1ÞÞðciÞ ¼1 ifpiðti1Þ ¼1 orti¼1
Siðhðti1ÞÞðciÞ ¼Si ifpi¼0
ð6Þ The strategy actions of each user depend on the probability state of cooperating, defending and not obtaining the incentive (without rewards) asbi;ci;di. After each round of the proposed game every user evaluates the probability depending upon the strategy to cooperate. If the scheduling strategy attempted by the consumer does not tend to minimize the cost, the player moves to next round without retaliating.
S¼ s1 s2 s3 bi ci di b0 c0 d0 b1 c1 d1 b2 c2 d2 0 B B B @ 1 C C C A ð7Þ S3¼Y 3 i¼0 ððbi;ci;diÞjðbiþciþdi¼1ÞÞ
fset of 33 probability among users;si2Sig ð8Þ 3.1.1. Constraints
With respect to each individual PAR asRi ind
Ri ind¼ HmaxðlhÞ X H h¼1 XN n¼1 lhn ! , No of userN 0 B B B B @ 1 C C C C A ð9Þ Ri indPEi½h !Ws½h ¼0 Ri ind6Ei½h !Ws½h ¼1 ; bi;ci;diP0
whereEiindicates the per unit value of individual load profile of the consumer. Based on the winning strategy matrix shifta-ble appliances are scheduled in the particular users home. Load scheduling followed by each user depends on the strategy game applied for shifting the appliances which exhibits the total DR of the game. Depending on scheduling for shiftable and nonshiftable appliances constraints are derived. If shifta-ble appliances such as washing machine which follows cycle pattern and cannot be interrupted, it is denoted as gn¼1
and nonshiftable asgn¼2. To model the performance using this game set a maximum delay is obtained as in Eq.(11): Demand Response½h ¼Shiftable appliances½h
þNonshiftable appliances½h Dgn max ¼g ng fixed ð10Þ fðhÞ ¼Dgn max Pn j¼1Sj k W½h þ Xtþ1 t¼0 SjðhÞ " # ð11Þ Askindicates the total number of hours a particular user is winning the strategy.
3.1.2. Existence of Nash equilibrium
In the continuous process with repeated game slots, Nash equi-librium convergence is obtained from all the players (users). For instance let the strategy obtained from three users consid-ered uðs1;s2;s3Þ and the total strategy obtained as S of the entire game (repeated process) till an convergence of inequality is obtained as shown in Eq.(3). The final model of the game is given for payoff function in Eq.(12):
uiðsÞ ¼pi 1ci bici þmin 8n2N XN n¼1 XH h Cn tfðhÞ ð12Þ in which the payoff functionui:si!Rrepresents payoff func-tion of winning strategy of the user by gaining the maximum profit for them.si is the strategy actions adapted by the users at every round in the game, ands!i is the strategy adapted by all other users except the current user. The entire model exhi-bits the new game concept to obtain the best strategy and thereby the winning strategy is updated by the convergence of Nash equilibrium.
The implementation of algorithm in two step analysis is explained clearly by considering three users as an example pre-sented as follows:
Maximum demand of the users considered for the initial algorithm is set as for three users.Ca indicates the maxi-mum demand of three users.
Peak Average Ratio for the particular user and particular hour.
Total demandLfor the particular hour (adding 3 customer values for that particular hour). Finding here a Total demand (three users, 4 h).
Maximum demand value Lmax and arranging the load in ascending order and also arranging the demand hours in ascending order.
Finding PAR for load profileL which is the load profile obtained by adding load of three customers.
Finding tariff for different customers and PAR for individ-ual consumers can be obtained.
As an example based on the new PAR obtained, it is com-pared with the load for that particular hour and cost is given based on that value. Based on comparison, one of the values from cost matrix is chosen, first case if demand is 0.06 less than PAR value then cost is 0.15% for the particular hour andCnis the cost matrix for three customers considered for com-putational simulation.
Algorithm for Appliance Scheduling is explained as follows:
i. Appliance array for each house,h¼8, total no. of hrs load can be shiftable.Pd¼200,Pd is a power demand considered inpuvalue.
ii. Based on the appliances, first we need to calculate total no of appliances whose load can be shifted, then total load which can be shifted, no of houses it can be separated.
iii. In the considered case, load of 200 unit per hour is done, as 8 h shift of load.
iv. The array obtained gives the random shifting of load for 8 h as in a random array generated with ones and zeroes, once indicates the shifted hour, so for each customer 8 h are chosen randomly.
v. Updating the appliance array based on minimum hours array depending on the strategy obtained from the game slot and the new appliance array is obtained by adding shiftable hrs to minimum array found earlier so that shiftable appliances can be used at minimum demand hrs.
vi. To obtain total tariff for each consumer and finding winning strategy for individual consumer.
vii. Arranging the demand hours in ascending order for individual customers and updating the appliance array based on minimum hrs for individual customers. On the final step obtaining individual tariff for individual customers.
4. Results and inference
The versatility of the proposed novel approach of Demand side response modeling for domestic consumers has been explained with mathematical calculations for a study of 3 users and scheduling 15 appliances per hour basis. The time is calcu-lated based on the tariff on IEX standard [28]which can be extended to multiple consumers under utility providers. Case analysis is made for a typical working day in an apartment, also tariff ranges have been estimated and energy consumed is analyzed.
The load profile for different users in a locality is simulated which is given inTable 1.
The load profile calculated is shown inFig. 5for three users and their power demand. Assume the number of users under a utility is N. For every user neN, the calculations for PAR required for the preliminary step in the proposed algorithm are stated from[13].
Total load of the day is given as
Lh¼
X
n2N
lhn ð13Þ
The daily peak and average load are calculated as
Lpeak¼max h2HLh ð14Þ Lavg¼ 1 H X h2H Lh ð15Þ
PAR¼Lpeak
Lavg
¼HPmaxh2HLh h2HLh
ð16Þ For example, three random users with four hours of ran-dom calculated load profile are generated using MATLAB with Gambit software. Then day-ahead schedule is created by the utility. The following graph shows different load profile for different home users. The generated values are
Lpeak¼1:7401 kW Lavg¼1:4910 kW PAR¼0:3890
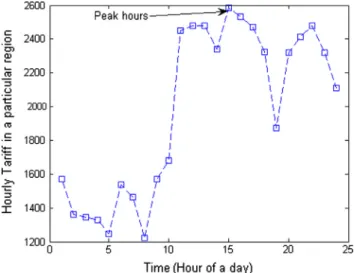
Table 2shows the calculated tariff by the utility for three users. The data presented inTable 3consider as array in the proposed novel algorithm for reduction in cost and shifting the loads based on the PAR value. The case of a two bedroom house used for scheduling of shiftable and non shiftable appli-ances for a day is calculated by user preference in considera-tion with a normal working day in a middle class family. Fig. 6shows the typical Tariff in a region according to IEX [28]considered.
The above value and graph are the tariff generated by the utility according to the load profile of the individual users (three users). The second step involves the strategy taken by the user in a dominant way. According to dominance equilib-rium of the game theory, the dominant strategy is generated as per the equation. At first the user’s strategy is stored as the scheduling vector and the pay-off of the respective schedule is calculated. Then the winning strategy is found and it is com-pared against other strategies repeatedly. The winning strategy is found from normal schedule using the game theory algo-rithm. Tables 4and5represent DR scheme before the game theory’s dominant strategy and latter represents after the algo-rithm is done. The graph inferred also exhibits the cost is min-imal for different users. Currently inTable 4the strategy is not used and the cost is imbalanced among hours whereas as the
algorithm implemented, issues of DR congestion are consid-ered on which the cost is reduced with linear power usage and balance without disturbing the comfort of the users.
It can be seen that the winning strategy gives a distributed load profile minimizing demand and cost will also be reduced for highly paid users. Further, the performance of GTFT strat-egy is evaluated in terms of energy consumption reduction in par comparison with the energy consumption algorithm [29] and the performance is evaluated with the optimized DSM technique which is a conventional method of Game Theory Energy Scheduler (GTES). The number of consumers can be varied from 3 to 200 users. Each customer has to be connected to the utility market through a smart meter and 15 appliances are taken into consideration for scheduling. The developed algorithm is simulated in MATLAB 13b by using 2.4 GHz INTEL i3 processor personal computer with 2.0 GB RAM and later to compare the running time it is checked from 3 to 50 users. Performance of the proposed method is compared to other two existing methods. The results explicate the run-ning time of the first method as a rapid increase while in con-duction of the other game theory methods with a large set of users. InFig. 7the iterations needed for the considered method and the proposed method have been evaluated and plotted. Here the performance and evaluation are carried out com-pared with GTFT in a smart grid environment.
Fig. 7clearly demonstrates the change in number of itera-tions in Energy consumption game with the other two algo-rithms and is a steep increase with number of users and also there is a total increase in average time with the consumers in comparison with the present algorithm. And further it improvises the solution by optimization for each user. The extended evaluation preambles this method is more scalable for large set of users. Thereby on computational analysis made by the proposed method with the other conventional ones, the running time is comparatively decreased. It also exhibits as the consumers increase, and there is a vitality of the method and can hence validate faster. Fig. 8 clearly indicates the system running time for the ten users.
Fig. 9exhibits the system convergence of PAR and price of the utility market for GTFT method with a scenario of 150 users. In this system PAR changes from 1.6 to 0.6 for the list of users. In addition to that, the energy consumption is also varied and considerably reduced. It further depicts that PAR getting converged fast at every round of the algorithm. Only after certain rounds it sets to some convergence point at 0.6 and gets stabilized. So it reaches the final Nash equilibrium in game theory stage at this point for every consumer and also it is done as these users find their own optimal schedule. As in both the users and utility market can be benefited from the proposed algorithm.
The new installation of power plants is reduced by energy savings as the distribution and transmission capacity is consid-erably reduced in power companies. The price function curve exhibits a more marginable reduction of their energy bill of the customers, on their own way of deduction of the load schedule. Hitherto, if the number of consumers is increasing, their ratio between the iterations and users can be decreased a little. This can be ended more profoundly that the proposed method approaches on high convergence speeds and they per-form well with large number of consumers. The two main issues in demand response modeling are achieving reduction of cost for the users and minimizing PAR which increases in
0 0.2 0.4 0.6 0.8 1 1 2 3 4 Generated Pow e r (pu) Time (Hours) User 1 User 2 User 3
Figure 5 Load profile graph of users.
Table 2 Tariff by the utility in (Rs.) of three users.
Domestic users Hour 1 Hour 2 Hour 3 Hour 4
User 1 100 100 43 43
User 2 100 100 43 62
PAR moves on to imbalance in a load shape in the energy con-sumption on per day basis and also developing energy aware consumption patterns in a successful manner.
The performance of GTFT method is evaluated by a two step top down centralized game. The observation verifies that the price parameter involved in the approach converges
Table 3 Scheduling of appliances followed by one of the users, considered for the algorithm (locality: 2 bedroom house – 2 4 h schedule). Ho urs 1–2 2–3 3–4 4–5 5–6 6–7 7–8 8–9 9–10 10–11 11–12 12–1 3 13–1 4 14–1 5 15–16 16–17 17–1 8 18–1 9 19–2 0 20–21 21–22 22–2 3 23–2 4 Refrig erato r (1) Power in wat ts 380 380 380 380 380 380 380 380 380 380 380 380 380 380 380 380 380 380 380 380 380 380 380 TV (1) 70 70 70 70 70 70 70 70 70 70 70 70 70 70 70 70 70 70 70 70 70 70 0 W ashing mach ine (1) 00000 0 1200 600 0 0 0 0 0 0 0 0 0 0 0 0 0 0 0 Iron box (1) 00000 1000 0 0 0 0 0 0 0 0 0 0 0 0 0 0 0 0 0 Lig hting (4 ) 000003 63 6 2 1 6 1 4 4 7 2 3 6 7 2 7 2 3 6 3 6 3 6 7 2 1 4 4 1 4 4 1 4 4 1 4 4 0 0 C eiling fan (3) 225 225 225 225 225 225 225 150 150 150 150 150 150 150 150 150 150 225 225 0 0 0 225 M icrowave oven (1) 00000 0 7 5 0 00 0 0 7 5 0 0 0 0 0 0 7 5 0 0 0 0 0 0 Perso nal compu ter (1) 99999 9 999 9 9 0 0 0 0 0 0 0 0 5 0 5 0 5 0 0 A C (1 ) 00000 0 000 0 1100 1100 0 0 0 0 0 0 0 1100 1100 1100 0 W ater heater (1) 0000 5 0 0 5 0 0 000 0 5 0 0 0 0 0 0 0 0 5 0 0 0 0 0 0 0 W ater pump (1) 00000 1000 0 0 0 0 0 0 0 0 0 0 0 1000 0 0 0 0 0 M ixer grin ders (1) 00000 4 5 0 000 0 0 0 0 0 0 0 0 4 5 0 0 0 0 0 0
Figure 6 Typical tariff in a region according to IEX [8] considered.
Table 4 Without game theory dominant strategy.
Without game theory Hour 1 Hour 2 Hour 3 Hour 4 Total cost (Rs)
User 1 0 100 0 43 143
User 2 0 100 0 75 175
User 3 0 43 0 43 86
Table 5 With game theory winning strategy win stay and lose shift.
With game theory Hour 1 Hour 2 Hour 3 Hour 4 Total cost (Rs)
User 1 0 0 43 43 86
User 2 0 100 62 75 237
User 3 0 43 0 43 86
appropriately faster both on the user and on the supplier side as shown in Fig. 10. They converge at equilibrium and the condition of demand response congestion is also validated here. This approach implies more convergence speed. Thereby the good approach can be understood not only by shifting the energy consumption but also adjusting the consumption of energy accurately at regular intervals of time during different hours without DR congestion to make a successful scheme.
Fig. 11represents the load curve of one user implemented by the proposed algorithm as such the proposed one is a compar-ative analysis with the other algorithm. It clearly explains that the consumers considered for analysis from 3 to 200 users. It shows without the proposed model from the change in time along the day. It exhibits from the load curve analysis that for user 1 in the first iteration, the demand power from the
morning hours around 10 am is used more and there is a bal-ance in demand of power compared without the use of strategy. Figs. 12and13represent the set of users implemented with the DR strategy and without DR model with respect to load scheduling developed on daily basis. It portrays from the results of computational simulation and user 1 to user 3 the DR con-gestion issue is managed as when the load scheduling is shifted Figure 8 System running time by considering users.
Figure 9 Convergence of PAR.
Figure 10 Convergence of the price.
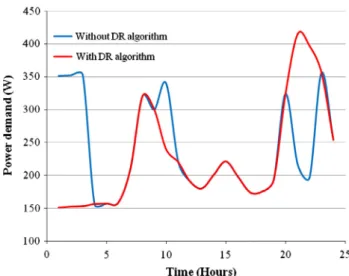
Figure 11 Load curves for user 1 implementing with and without DR algorithm. 100 150 200 250 300 350 400 450 500 0 5 10 15 20 25 Po wer D e ma nd (W) Time (Hours) With DR algorithm User 1 User 2 User 3
Figure 12 Analysis of users profile with DR strategy.
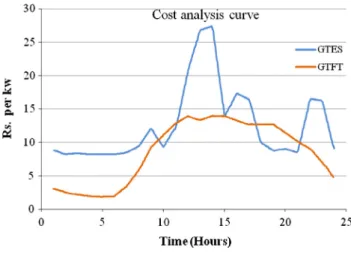
from non-peak hours to peak hours, there is some congestion among them. As such in the proposed one, it is being managed and distributed along the entire full day basis. And as implementing this way the non-peak hours tariff is balanced without any increase in bill so the cost of users is balanced the entire day and this strategy has expected a proven success. Fig. 14shows the results compared with the method, and the cost of the one user is reduced considerably in the peak hours. Compared to the other methods, the curve is more of a linear one, where the method is a nonlinear curve. Cost curve indi-cates that the consumer need not to pay extensively for using power during peak hour times as it is balanced and the cost is considerably decreased in this method.
5. Conclusion
In this proposed work, a new methodology has been adapted creating a working model between the user and the utility for reduction of the tariff using the analysis of PAR in every cus-tomer interaction and also considering the change in peak load hours by scheduling the appliances using game theory strategy among the users. Thereby the new demand response algorithm works for multi users in a locality, demonstrating its dynamic behavior. The results have been analyzed using a particular set of consumers as case study and the work is more established by evaluating the results with conventional methods. This strategy portrays the reduction of cost, mini-mizes PAR and proves its dynamic nature by considering DR congestion case. The work can be extended in a different approach by introducing the same algorithm in different soft computing techniques with the addition of renewable energy sources. Thereby a complete DSM toolbox for home area management can be developed using the present day tech-niques such as Big data computation and Cloud Computing techniques.
References
[1]Vardakas John S, Zorba Nizar, Verikoukis Christos V. A survey on demand response programs in smart grids: pricing methods
and optimization algorithms. Commun Surv Tutorials, IEEE 2015;17(1):152–78.
[2] Deng Ruilong et al. A survey on demand response in smart grids: mathematical models and approaches. IEEE Trans Industr Inf 2015;3(11):570–82.
[3] Siano Pierluigi. Demand response and smart grids—a survey. Renew Sustain Energy Rev 2014;30:461–78.
[4] Hamilton K, Gulhar N. Taking demand response to the next level. IEEE Power Energy Mag 2010;8(3):60–5.
[5] Gelazanskas Linas, Gamage Kelum AA. Demand side manage-ment in smart grid: a review and proposals for future direction. Sustain Cities Soc 2014;11:22–30.
[6] Palensky Peter, Dietrich Dietmar. Demand side management: demand response, intelligent energy systems, and smart loads. Indust Inf, IEEE Trans 2011;7(3):381–8.
[7] Pipattanasomporn M, Kuzlu M, Rahman S. Demand response implementation in a home area network: a conceptual hardware architecture. In: Proc. innovative smart grid technologies; 2012. p. 1–8.
[8] Belhaiza Slim, Baroudi Uthman. A game theoretic model for smart grids demand management. Smart Grid, IEEE Trans 2015;6 (3):1386–93.
[9] Deng Ruilong et al. Residential energy consumption scheduling: a coupled-constraint game approach. Smart Grid, IEEE Trans 2014;5(3):1340–50.
[10] Chai Bo et al. Demand response management with multiple utility companies: a two-level game approach. Smart Grid, IEEE Trans 2014;5(2):722–31.
[11] Yaagoubi Naouar, Mouftah Hussein T. User-aware game theo-retic approach for demand management. Smart Grid, IEEE Trans 2015;6(2):716–25.
[12] Yan C, Sabrina WL, Feng H, et al. Incentive compatible demand response games for distributed load prediction in smart grids. APSIPA Trans Signal Inf Process 2014;3:1–13.
[13] Mohsenian-Rad A-H, Wong VWS, Jatskevich J, Schober R, Leon-Garcia A. Autonomous demand-side management based on game-theoretic energy consumption scheduling for the future smart grid. IEEE Trans Smart Grid 2010;1(3): 320–31.
[14] Song Linqi, Xiao Yuanzhang, van der Schaar Mihaela. Demand side management in smart grids using a repeated game framework. Selected Areas Commun, IEEE J 2014;32(7): 1412–24.
[15] Chen He et al. Autonomous demand side management based on energy consumption scheduling and instantaneous load billing: an aggregative game approach. Smart Grid, IEEE Trans 2014;5(4): 1744–54.
[16] Yan Chen, Lin WS, Feng Han, Yu-Han Y, Safar Z, Liu KJR. A cheat-proof game theoretic demand response scheme for smart grids. In: IEEE international conference on communications (ICC); 2012. p. 3362–6.
[17] Shengrong Bu, Richard Yu F. A game-theoretical scheme in the smart grid with demand side management: towards a smart cyber-physical power infrastructure. IEEE Trans Emerg Topics Comput 2013;1(1):22–32.
[18] Nekouei Ehsan, Alpcan Tansu, Chattopadhyay Deb. Game-theoretic frameworks for demand response in electricity markets. Smart Grid, IEEE Trans 2015;6(2):748–58.
[19] Yang Peng, Tang Gongguo, Nehorai Arye. A game-theoretic approach for optimal time-of-use electricity pricing. Power Syst, IEEE Trans 2013;28(2):884–92.
[20] Saad W, Zhu Han, Poor HV, Basar T. Game-theoretic methods for the smart grid: an overview of microgrid systems, demand-side management, and smart grid communications. IEEE Signal Process Mag 2012;29(5):86–105.
[22]Logenthiran, Thillainathan, Srinivasan Dipti, Tan ZS. Demand side management in smart grid using heuristic optimization. IEEE Trans Smart Grid 2012;3(3):1244–52.
[23] Ziming Zhu, Jie T, Lambotharan S, Woon HC, Zhong F. An integer linear programming based optimization for home demand-side management in smart grid. Innovative smart grid technolo-gies (ISGT), IEEE PES; 2012.
[24] Rainer B. Tit-for-tat-like conditional strategies–a generalization for arbitrary large groups. Working paper; 2006.
[25] Guowei Wu, Zichuan Xu, Qiufen Xia, Jiankang R. GTFTTS: a generalized tit-for-tat based corporative game for temperature-aware task scheduling in multi-core systems. IEEE third interna-tional symposium on parallel architectures, algorithms and programming (PAAP); 2010. p. 81–8.
[26]Imhof Lorens A, Drew F, Martin AN. Tit-for-tat or win-stay, lose-shift? J Theor Biol 2007;247(3):574–80.
[27]Nowak Martin, Karl S. A strategy of win-stay, lose-shift that outperforms tit-for-tat in the Prisoner’s Dilemma game. Nature 1993;364(6432):56–8.
[28]http://www.iexindia.com/.
[29]Zubair Md Fadlullah, Minh Duong, Keto Nei, Stojmenovic Ivan. GTES: an optimized game-theoretic demand-side man-agement scheme for smart grid. Syst J, IEEE 2014;8(2): 588–97.
Sofana Reka S.completed her BE (Electrical and Electronics Engineering) from Vellore Institute of Technology (formerly Vellore Engineering College), Vellore, and her M. Tech. from SASTRA University, Thanjavur, India. She is currently pursuing her PhD at VIT University in School of Electrical Engi-neering. Areas of interest are Power Systems and Soft computing Techniques.
Ramesh V. Completed his B.E. (Hons) in Mechanical Engineering from Birla Institute of Technology & Science (Pilani) in 1983, AMIE (Electrical Engineering) in 1992, M.E. (Power Systems Engineering) from Thiagara-jar College of Engineering, Madurai-Kamaraj University in 1994 and completed his doctor-ate studies. He is with VIT University Vellore currently as a Professor with the School of Electrical Engineering. He has a total experi-ence of 20 years in teaching and research after spending about 7 years in the industry.

![Fig. 6 shows the typical Tariff in a region according to IEX [28] considered.](https://thumb-us.123doks.com/thumbv2/123dok_us/10220819.2925940/7.892.76.420.1016.1095/fig-shows-typical-tariff-region-according-iex-considered.webp)