Katja rost/Bruno S. Frey*
Q
uantitative
and
Q
ualitative
R
ankings
of
s
cholaRs
**
abstRact
in a former article we started to argue that publication and citation rankings of indi-vidual scholars do not effectively measure research quality, which should in fact be the essence of evaluation (Frey and rost (2010)). For the field of economics we show that an alternative ranking based on membership on academic editorial boards of profes-sional journals is randomly correlated with citation and publication rankings of these scholars. in this article we go a step further by hypothesizing a systematic, inverted
u-shaped relationship between quantitative and qualitative rankings. By relying on a longitudinal data set of management scholars who are part of the international top-community in organization science the findings support this multi-tasking effect. While a certain amount of publications indeed reflects aspects of research quality, it also sug-gests that maximizing publications ignores other essential aspects of research quality that are doubtlessly hard to measure. it follows that if career decisions are only based on high scores in publication rankings the result will be not only haphazard but may be even counterproductive for science.
Jel-classification: h43, l15, O38.
Keywords: evaluations; rankings; research Quality; Scholars; universities.
* Katja Rost, University of Mannheim, Economic and Organizational Sociology, Parkring 47, D-68159 Mannhe-im, Germany, Phone: +49 621 181 39 42, Fax: +49 621 181 19 83. Bruno S. Frey, University of Zurich, Insti-tute for Empirical Research in Economics, Winterthurerstrasse 30, CH-8006 Zurich, Switzerland, Phone: +41 44 634 37 31, Fax: +41 44 634 35 99, and CREMA – Center for Research in Economics, Management and the Arts, Switzerland.
** �he authors are grateful for the helpful comments �y three reviewers of the s�r, �y two editors of the s�r and �y�he authors are grateful for the helpful comments �y three reviewers of the s�r, �y two editors of the s�r and �y Margit Osterloh. We further thank all peers who discussed with us the advantages and disadvantages of scholar rankings, in particular Christine Benesch, Axel Dreher, Reiner Eichen�erger, �homas Ehrmann, Axel Franzen, Jetta Frost, Martin Gasse�ner, Fa�ian Hom�erg, Emil Inauen, Alfred Kieser, Christopher Lettl, Roger Luethi, Simon Lüchinger, William McKinley, Andreas Scherer, Alois Stutzer, Gerhard Speck�acher, �ill �alaulicar, An-toinette Wei�el.
1 intRoduction
Rankings in terms of the num�er of pu�lications and citations are a popular method of examining and mapping the intellectual impact of scientists, projects, journals, disciplines, faculties, universities and nations �Gar��eld�Gar��eld�1979); Borgman�1990); Moed�2005); Judge et al.�2007); Meho�2007); Cronin and Meho�2008); Fa�el et al.�2008); Handels�latt �2009)). Rankings are commonly used worldwide for policymaking, to monitor scienti��c developments, and to serve as a �asis for promotions, tenure, hiring, salary, and grants decisions �Cronin�1996); White and McCain�1998); Small�1999); Warner�2000); Borgman and Furner�2002); Weingart�2005)).
In a former article we started to argue that rankings are quantitative; they indicate the position, or rather the signi��cance, of a scholar, university, or country relative to others �Frey, Rost �2010)). It is however quality that should �e considered the essence of scienti��c research rankings �e.g., Johnes�1988)); society does not �ene��t from how many pu�lica-tions have �een authored, and how many citapu�lica-tions have �een accumulated. What should matter is the advancement of new insights and their value �Adler and Harzing �2009)), i.e., whether the research is useful, satis��es stated or implied needs, is free of de��ciencies, and meets more general social requirements �see, e.g., Reedijk�1998); Nightingale and Scott�2007)).
In order to demonstrate that quantitative rankings measure research quality only to a limited extent we compared rankings, which are �ased on pu�lications and citations, with rankings, which are �ased on mem�ership in the scienti��c �oards of academic journals �Frey and Rost �2010)). Editor �oard rankings consider the reputation and recognition of scholars among their peers. Scholarly reputation depends on a great many factors, �ut the qualitative aspect is certainly central. �We note that quantitative and qualitative rankings are not strictly separa�le as �oth contain elements of the other. The distinction is made solely for clarity). A major result of this study is that quantitative and qualitative rankings of individual scholars are randomly correlated with each other. The same conclusion does, however, not hold for more aggregated levels of analysis, in particular for the comparison of countries.
In this article we therefore concentrate on individual scholars and analyse the relation-ship �etween quantitative and qualitative rankings in more detail. In our theory we rely on the multi-tasking and the creativity literature in order to hypothesize that �oth rank-ings are inverted u-shaped related to each other. In order to test this relationship we collect suita�le data on management scholars. In contrast to our ��rst empirical study, the sample compares scholars of one su�-community and not of many su�-communities ensuring similar pu�lication, citation and editor mem�ership ha�its. This community has an extraordinary high international reputation securing that the dataset is representative 1 Efforts have �een made to include quality aspects in rankings, for example �y counting only those pu�lications and citations that appear in scientific journals of “accepta�le” quality or �y considering “impact” factors that con-sider the ranking of a journal in which a pu�lication or citation appears. Nevertheless, the resulting rankings take the quality aspects of research activity into account only to a limited extent.
for the elite. We predict the relationship �etween quantitative and qualitative rankings �y controlling for a diverse set of indicators and �y running ro�ustness test, e.g. �y using corrected measurements of pu�lication records which are sometimes suggested to over-come the pro�lems of current rankings.
A signi��cant result of our empirical study is that quantitative and qualitativerankings are not linearly related to each other. Instead, the num�er of pu�lications shows an inverted u-shaped relation to scholars who are selected as �oard mem�ers. This suggests that persons who score high in pu�lication rankings will score only modestly in our alternative ranking. For this reason, high scores in pu�lication rankings should not�ecome the onlygoal of research evaluation. Pu�lication rankings ignore features that are difficult to measure �Holmström and Milgrom�1991)). In the long run they may �e even counterproductive �y crowding-out scholar contri�utions which are hard to measure �ut still important for research quality. We do not claim that the ranking �ased on editorial �oard mem�ership that we develop here is a �etter ranking method. However, we do argue that pu�lication rankings disregard other, important scholarly contri�utions.
The paper is organized as follows. Section 2 gives a short overview of the rankings currently in use, �ased on pu�lications and citations, and identi��es their shortcomings. We discuss how, and to what extent, quality is captured �y an alternative de��nition of scienti��c worth, mem�ership on editorial �oards. Both su�-sections are a short repeti-tion of our ��rst article on rankings. Following, we develop the hypothesis to �e tested in this study: quantitative and qualitative rankings are expected to �e inverted u-shaped related to each other. In Section 3 we present the empirical results for our sample of 5,794 researchers who pu�lished their research in at least one of 11 international top journals of the management and organization research community in the period from 1997-2007. In 2009, 1,316 scholars held at least one editor, co-editor, or �oard position in these journals. In Section 4 we argue that due to the su�stantial insta�ility of scienti��c rankings, more care should �e taken when using rankings for decision-making, in particular when making decisions a�out the careers of individual scholars. We present four alternatives to quantita-tive rankings and shortly point out some advantages and disadvantages.
2 cuRRent scientific Rankings 2.1 Quantitative Rankings
Evaluating scientific quality is notoriously difficult �Cherchye and Vanden �2005)). Ideally, esta�lished experts in the field should scrutinize the pu�lished scientific results. However, in practice, committees comprised of mem�ers with general competence, rather than specialists often evaluate primary research data. In the past, these com-mittees used peer review and other expert judgments until claims were made that ex-pert judgments could �e �iased, and therefore could �e inferior to seemingly o�jective measures, such as the num�er of pu�lications and citations �Horro�in �1990); Moxham
and Anderson �1992)). �oday, these committees tend to use secondary criteria, so it is hardly surprising that the prevalent ranking principle for evaluating research focuses on quantity, which appears to �e an o�jective indicator directly related to pu�lished sci-ence �Adler, Ewing, and �aylor �2008))..
Such �i�liometric indicators have several advantages. First, the data are easily availa�le, for example, from pu�lication lists or other data sources such as the We� of Science. Second, �i�liometric counts seem to �e o�jective indicators. Third, �i�liometric indicators facili-tate the comparison �etween a large num�er of candidates or institutions.
Bi�liometric indicators have, however, also disadvantages. Disadvantages in particular arise due to the effort to capture a qualitative aspect in the current rankings. First, most rankings ignore pu�lications such as �ooks, general pu�lic notices, hand�ooks, and other collections of articles, as well as anything pu�lished in a non-refereed journal �Johnes �1988); Reedijk�1998); Donovan and Butler�2007); Adler and Harzing�2009)). Second, pu�lications in refereed journals are categorized according to the prominence of the journal measured �y impact factors. However, journal impact factors ignore the fact that the citation rates of an article determine the impact factor of a journal, �ut that the reverse is not true �Seglen�1997))5. Third, the o�scure weighting of journals according to their prominence often coincides with a remarka�le incompleteness of the data�ase �Adler and Harzing�2009); Al�ers�2009)). It is hardly surprising that the ranking posi-tions of scholars depend on the precise execution of the rankings �Coupé�2003); Meho and Rogers�2008)).
In order to overcome these limitations it has �een suggested to consider citation records �e.g., Nederhof and van Raan�1993)). The underlying assumption is that citations show that the individual, the journal, the institute, or the country cited has performed work that is rele-vant to current research frontiers and is useful to those attempting to extend those frontiers �Diamond�1986)). However, to the extent that citations inadequately account for scienti��c quality, the corresponding rankings distort the informative function they claim to provide. The use of citations as an indicator of scienti��c quality reveals six major shortcomings: 2 �he opinions of experts may indeed �e influenced �y su�jective elements, narrow-mindedness, and limited cog-�he opinions of experts may indeed �e influenced �y su�jective elements, narrow-mindedness, and limited
cog-nitive horizons. �hese shortcomings may result in conflicts of interest, unawareness of quality, or even a negative �ias against young scientists or newcomers to a particular field.
3 Rig�y and Edler �2005) analyzed the degree to which the �i�liometric information of 169 research groups inRig�y and Edler �2005) analyzed the degree to which the �i�liometric information of 169 research groups in economics, econometrics, and �usiness administration relates to the assessment results of three evaluation com-mittees. More than half of the variation in the overall quality judgments of the committees can �e predicted �y using a handful of �i�liometric varia�les, nota�ly the num�er of pu�lications in top-ranked and international refereed journals, the num�er of international proceedings, and the num�er of Dutch journal articles. 4 Many journal rankings according to citations have �een undertaken �e.g., Lie�owitz and PalmerMany journal rankings according to citations have �een undertaken �e.g., Lie�owitz and Palmer�1984);
Dia-mond�1989); La�and and Piette�1994); Cheng, Holsapple, and Lee�1995); Hennig-�hurau, Welsh, and Schrader�2004); Paul�2004); Som�atsompop, Markpin, and Premkamolnetr �2004); Podsakoff et al.�2005); Handels�latt�2009); Schrader and Hennig-�hurau�2009)).
5 Seglen �1994) shows that 15�� of the articles account for 50�� of the impact factor of a journal. Other researchSeglen �1994) shows that 15�� of the articles account for 50�� of the impact factor of a journal. Other researchOther research notes that many top articles are pu�lished in lower-ranked journals, and many average articles are pu�lished inthat many top articles are pu�lished in lower-ranked journals, and many average articles are pu�lished in higher-ranked journals �Singh, Haddad, and Chow�2007); Adler and Harzing�2009)).
First, citations do not consider whether a scholar’s contri�ution is valua�le and furthers the course of scienti��c knowledge, is neutral, or hinders scienti��c progress.
Second, scholars are human �eings and follow fashiona�le trends or herding �ehavior �Banerjee�1992); Bikhchandani et al. �1992); Chamley and Gale�1994)). This “Matthew Effect” in science �Merton�1968)) leads to the emergence of “star” papers and authors whose only claim to fame is that they are famous, �ut few people actu-ally know or care a�out how the stars got to �e famous �Bara��si and Al�ert�Bara��si and Al�ert�1999); Bonitz, Bruckner, and Scharnhorst �1999); Faria �2005); Baccini and Bara�esinitz, Bruckner, and Scharnhorst �1999); Faria �2005); Baccini and Bara�esid Bara�esi �2008)).
Third, the fact that a particular work has �een cited does not mean that it has �een read �Donovan�2006)).
Fourth, citation counts do not indicate quality independent of the “contested” knowl-edge �Beed and Beed�1996))0.
Fifth, it is widely accepted as a �est practice in the �i�liometric community that it is prefera�le not to apply pu�lication and citation measures to individuals, �ut instead to use higher levels of aggregation, in particular, to universities or countries �van Raan �2003)).
6 �he latter happens if the scholar promotes an unproductive or even unsound approach, theory, method, or re-sult. If qualitative aspects were taken seriously, unproductive citations would �e given a zero rating and counter-productive citations would weigh negatively.
7 We see this influence when scholars quote papers simply �ecause they have previously �een cited �y other re-searchers. Simkin and Roychowdhury �2005; 2006; 2007) show that the pro�a�ility of a scholar �eing cited is affected �y the num�er of citations he or she already has.
8 In the case of cele�rities, the “Matthew Effect” is of little relevance, since their main o�jective is to entertain. However, in science, where a commitment to the search for knowledge and understanding is so important, such citations should �e put into a different category; they should not count as positive contri�utions.
9 Although no scholar would �e foolish enough to pu�licly admit that he or she cited articles without having read them, there is now empirical evidence that this lacuna does occur to a significant extent. Evidence that an aca-demic has not read the cited article can �e found in the identical misprints that appear repeatedly in citations. Such misprints are most likely to occur when authors copy reference lists contained in others’ papers. Based on a statistical analysis, Simkin and Roychowdhury �2005) conclude that a�out 70�� to 90�� of scientific citations are copied from the lists of references used in other papers. �his result does not automatically imply that all ci-tations copied from reference lists are not read, �ut it is an indication that some papers cited have not �een read �y those who are citing them.
10 In competitive disciplines, such as management or other social sciences, different citation counts indicate which author, article, or journal em�races the dominant theory most completely and which does not �Lee�2006)). Many scholars assume that articles that em�race unfamiliar reasoning and arguments have unimportant content. �herefore, these articles are rarely cited. �hus, differences in citation rankings often reflect the su�jective or ideo-logical rejection of the theory used rather than the quality or importance of the research to the discipline. Conse-quently, in departments or universities where tenure, promotions, salaries, and department funding are affected �y citation rankings, controversial findings, which are mostly pu�lished in less prestigious journals, are penalized �Coats�1971); Bell and Seater�1978); Bräuninger and Haucap�2003); Lee�2006)). �herefore, evaluations that rely on citation counts crowd out the crucially important innovative research in the social sciences. Such evalua-tions encourage a detrimental homogeneity in science, as has �een shown for �usiness schools �Gioia and Corleyencourage a detrimental homogeneity in science, as has �een shown for �usiness schools �Gioia and Corley �2002)).
11 Bi�liometric scientists argue that although these indicators may make sense in the natural and life sciences, such indicators are pro�lematic in the social and �ehavioral sciences where journals play a lesser role as primary com-munication channels. Many research fields are locally oriented, and older studies are more dominant �van Raan �2003)). n n n n n
Sixth, the list of shortcomings could easily �e extended to include the different cita-tion ha�its of authors in different ��elds and su���elds, the selectivity of citacita-tions �y authors �e.g., easily availa�le papers are cited more often), unintended spelling errors �y authors in citation lists, mistakes in counting and classifying citations and accred-iting them to journals and authors, and the inclusion of self-citations �especially �y determining the journal impact factor).
In fact, these restrictions are often ignored �see, for example, the ranking attempts of German �usiness scholars or economists �y Bommer and Ursprung�1998); Handels�latt �2006; 2007); Fa�el, Hein, and Hofmeister�2008); Handels�latt�2009)). The �ene��t of such proceedings is dou�tful and may negatively affect the quality of the social sciences. Because of all the shortcomings that are involved in using citations as relia�le indicators of scienti��c quality, there is good reason to consider alternative approaches.
2.2 Qualitative Rankings
A defining characteristic of any science is that its participants consider themselves mem�ers of a community of scholars �Lee�2006)). �hus, for scientists to �e em�ed-ded in a research community is a quality indicator of research. It ensures that the scien-tists and their research meet research standards accepted �y their scientific community, for example, �y utilizing proven research techniques. Professional scientific journals are the pu�lication outlets for different research communities. In this respect, the editorial �oards constitute the true experts in the research community, and �eing appointed an editorial �oard mem�er is not only a great honor, �ut is also indicator of scientific qual-ity �Kaufman�1984)).
�he �oard fulfils two different functions: First, it assists the editors in choosing the most suita�le articles for the respective scientific field. Second, it reflects the individual’s stand-ing in the profession as evaluated �y his or her peers. However, when �oard mem�ers con-tri�ute to editorial decisions and even when they are mainly, or only, honorary mem�ers,
12 Some editors freely admit that they encourage authors to cite as many pu�lications in their journal as possi�le inSome editors freely admit that they encourage authors to cite as many pu�lications in their journal as possi�le in order to raise their impact factor �Garfield�1997)).
13 Even though the Handels�latt Ranking is more accepted in economics, it has spread rapidly in the field of �usi-Even though the Handels�latt Ranking is more accepted in economics, it has spread rapidly in the field of �usi-ness administration and has �ecome accepted. For example, some German �usi�usi-ness scholars documented their ranking position on their homepages, faculties pu�lished their rankings in newspapers, or appointments com-mittees nowadays use the Handels�latt Ranking to compare the pu�lication lists of applicants in the field of �usi-ness administration.
14 Scientific knowledge is not some immuta�le o�jective stock that grows quantitatively; rather, it is falli�le, his-torically contingent, it can �e challenged, and it can change unpredicta�ly and qualitatively. �his competition is especially true for the social sciences. What constitutes scientific knowledge depends on the approval �y the sci-entific community
the choice of mem�ers should �e �ased on quality5. A �chief) editor wants to have schol-ars at hand who can help him or her make the �est possi�le decisions; a less reputa�le in-dividual or a person lacking expert knowledge is of little use. At the same time, �ecause the scholars represented on �oards have excellent professional reputations, mem�ership on �oards can �e a reasona�le approximation of the quality of an academic as judged �y his or her peers. Gi��ons and Fish ��1991)) take it as a matter of course: “Certainly, the more editorial �oards an �scholar) is on, the more prestigious the �scholar).”
However, we note that using editorial �oard positions as a quality indicator also has disadvantages. First, it clearly favors esta�lished scholars. But using the num�er of pu�-lications and citations has the same disadvantage. Second, only a small fraction of all scholars are mem�ers of editorial �oards. �his fact distorts the results �ecause it in-cludes only the �est scientists. However, management scholars in many countries have their own journals. Within these journals, the countrywide experts in a field are mem-�ers of editorial �oards. Although our research relies mainly on scholars who enjoy an international reputation, research evaluation could also include journals that originate in a specific country, e.g., in Austria, Germany and Switzerland, we have sbr/ZfbF, Die Betriebswirtschaft, Die Management Revue, Das Journal für Betriebswirtschaft, Die Un-ternehmung, Zeitschrift für Betriebswirtschaft, Zeitschrift Führung und Organisation, or Review of Managerial Science. �hird, some scholars may �e elected to an editorial �oard simply �ecause they are well known, regardless of the fact that they are no longer pro-ductive. Although this argument may �e true, it would �e wrong to conclude that these scholars have no research quality.
2.3 Relationbetween Quantitativeand Qualitative Rankings
Measured �y quantitative rankings, the pu�lication record of a scholar can �e ��ut does not necessarily need to �e) positively correlated with his or her engagement in multiple other tasks �Frey�2010)). In addition to doing research and having their research favor-a�ly pu�lished, the main tasks of scholars are teaching, supporting young scholars, informing and advising the pu�lic, participating in university administration, or reading and reviewing the work of other scholars. Thus, for the following reasons it is likely that there is a negative correlation �etween pu�lishing and the previously mentioned tasks:
First, �ecause of time and effort constraints, few scholars are a�le to perform these tasks sufficiently well and still fully engage in the arduous task of pu�lishing research papers.
15 For example, honorary mem�ers are often chosen to signal the orientation of the review �e.g., whether its empha-sis is on theoretical or empirical work). More importantly, journals want to profit from the reputation of honor-ary �oard mem�ers �Kaufman�1984)). �he more distinguished these mem�ers are within their discipline and community, the higher is the journal’s reputation, �ecause renowned scholars do not join the �oards of poor-quality journals. �Were they to do so, their own reputation would decline.)
16 �his procedure has �een put forward in the past and undertaken for small, distinct sets of journals �y Kaufman�his procedure has �een put forward in the past and undertaken for small, distinct sets of journals �y Kaufman ��1984)) for finance faculties, Kurtz and Boone �1988) for marketing faculties, and Gi��ons �1990) for statistics faculties.
Second, a pu�lishing record is easy to measure, �ut performance on the other tasks is not. The multiple-task effect �Holmström and Milgrom�1991); Prendergast�1999)) suggests that academics mainly engage in pu�lishing efforts and ignore the other tasks.
Third, the distri�ution of talent among those scholars who are a�le to pu�lish in the highest-ranked journals and those who are not, is likely to overlap. It follows that the worst scholars whose papers appear in top pu�lications are less capa�le of excelling in the other tasks �they are the so-called ‘‘lemons’’) than are the �est scholars who are not pu�lished in A-level pu�lications.
Fourth, writing articles for A-level journals is a highly specialized activity �Star�uck �2009)). Scientists who perform well in the specialized activity of writing articles for A-level journals may perform only modestly in the other six tasks.
Thus, we expect that the position of a scholar in quantitative rankings, i.e., his or her num�er of pu�lications, is not strictly related linearly to his or her position in our quali-tative rankings, i.e., using editorial �oard positions as a quality indicator. We argue that up to a point, the position of a scholar in quantitative rankings is only linearly related to his or her position in qualitative rankings. Beyond this point, there is less �ene��t realized from a higher num�er of pu�lications, and it may constrain the position of a scholar in qualitative rankings �Frey�2007)). In theory, u-shaped relations are common for innova-tive or creainnova-tive activities in which there is the possi�ility of multiple outcomes �Perry-Smith and Shalley�2003)).
On the one hand, editorial �oard mem�ers may need a minimum num�er of pu�lications. Scholars who are a�le to continuously pu�lish their research in reputa�le journals not only show a high level of research motivation, �ut also talent �Cole�1992)). Having such scholars on the editorial �oard signals research quality and thus improves the num�er and quality of su�missions to a journal. Second, effort and expert knowledge are important to ful��ll the tasks within editorial �oards, e.g., to distinguish �etween good and excellent research, to identify errors, to evaluate the trustworthiness of research, or to responsi�ly ful��ll assignments within short time periods.
On the other hand, a scholar who may represent an excellent choice as editorial �oard mem�er might not have a large num�er of pu�lications. Being visi�le as a possi�le edito-rial �oard mem�er requires additional task investments, all of which reduce the time for pu�lishing. In theory, this effect has �een la�eled multitasking effect. For complex pro�lems consisting of multiple tasks, such as research, it means that people can or will concentrate only on certain tasks and will neglect everything else �Holmström and Milgrom�1991)). 17 Multiple tasking effects can also affect pu�lication strategies �Adler and Harzing�2009); Osterloh and Frey
�2009)). �o receive high scores in pu�lication and citation rankings may �ecome an academic’s goal, rather than to examine and determine how and why the conducted research may �e important. �here are many examples for these tactics, such as the “slicing strategy” �Butler�2003)), i.e. the maximization of pu�lications �y divid-ing research into small pu�lisha�le units; the “academic prostitution” strategy �Frey�2003)), i.e., the voluntary distortion of research results; the inclusion of wasteful citations; the adding of famous, al�eit imaginary, co-au-thors that ena�le a junior researcher to survive review processes; or the “mediocrity” strategy �Osterloh and Frey �2009)), i.e., the decision to conduct uncreative, orthodox research to please the average referee and thus to in-crease the likelihood of pu�lication.
n
n
First, scholars who are visi�le as possi�le editorial �oard mem�ers must �e good reviewers. Being a good reviewer can �e positively correlated with the num�er of pu�lications. Reviewing involves spending valua�le time on the work of other scholars and wide reading. Reviewing and reading reduces the time for writing and pu�lishing. According to the multitasking theory, it seems likely that many scholars may �e quietly productive in either reviewing or pu�lishing, �ut only few scholars will �e active in �oth areas. Second, to motivate the research community to su�mit their pu�lications, scholars who are possi�le editorial �oard mem�ers should �e associated with outstanding research content.
Outstanding research might �e positively correlated with the num�er of pu�lications. Producing meaningful and innovative research content is often slower than producing rigorous �ut less meaningful, “standard” research content. Further, the acceptance of inno-vative research is far from certain �Dasgupta and David�1994); Nelson�2004)). Again, it seems likely that only few researchers are a�le to produce highly innovative research and simultaneous maximize the num�er of their pu�lications. Editorial �oards may �e more interested in innovative research and less interested in the num�er of pu�lications. Third, although �oth the arguments cited a�ove assume that scholars who are invited to �e editorial mem�ers do not maximize their num�er of pu�lications, it is also possi�le that scholars with a large pu�lication record are nevertheless asked to participate in editorial �oards, �ut are less willing to engage in this task. Being a mem�er of an editorial �oard entails constraints on time and effort. There is less time for pu�lishing, and some scholars may prefer to pu�lish instead of serving on editorial �oards.
Thus, it seems plausi�le to assume that the relation �etween a scholar’s position in the quantitative and qualitative rankings has a curvilinear shape. While a minimum of pu�li-cations may �e important to guarantee the recognition of a scholar as a possi�le editorial �oard mem�er, too many pu�lications may reflect a lack of investment in multiple other tasks, which are also essentially important for editorial �oard mem�ers. This leads to the hypothesis that we test empirically:
Hypothesis 1: As measured in our qualitative ranking, the publication record of individual scholars, as measured in quantitative rankings, shows an inverted U-shaped relation to the probability of being selected as an editorial board member.
3 compaRisonbetween Quantitativeand Qualitative Rankings 3.1 sample
�o analyze the systematic nonlinear relation �etween quantitative and qualitative rankings, we use a sample of journals that are considered to enjoy an excellent international reputa-tion within the ��eld of management andorganization. This sample is representative for researchers who pu�lish papers on dominant theories within this research community. We expect similar effects for other sciences, and for lower-ranked journals. However, we note
that our sample does not provide a comprehensive overview of all research communities within the organization management community. In particular, we exclude heterodox research communities that em�race contested knowledge �Lee�2008)).
�o determine the �oundaries of our sample of journals, we proceed in three steps. First,of journals, we proceed in three steps. First, we proceed in three steps. First, to include only one and not several citation and pu�lication ha�its we draw on personal experience which journals are read and considered as possi�le pu�lication outlets �y scholars of the organization management community. We exclude ancillary journals that are strongly related to other fields, e.g., to psychology, innovation management, accounting, finance, marketing etc.
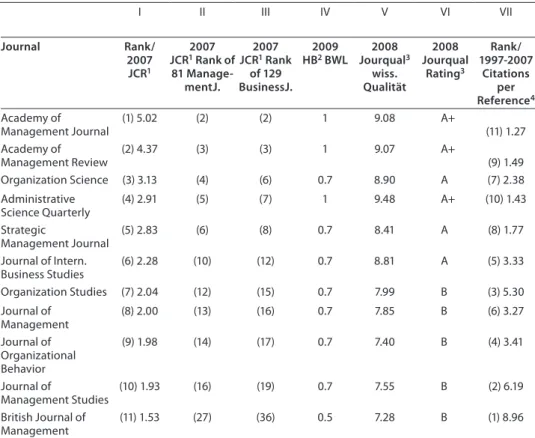
Second, to �ypass the o�scure weighting of articles �y impact factors, we validate the impact homogeneity of our sample �y using different journal rankings. Table 1 presents the various ranking positions of the journals we use. Columns II and III indicate that the journals maintain top-level positions when we consider only management and �usi-ness journals of the ISI we� of knowledge18. Column I shows that all journals have high journal impact factors reaching from 1.5 up to ��ve. Columns IV, V, and VI show that all pu�lication outlets are classi��ed as A+, A, or B journals within the several rankings. Column VII contains our measurement of journal impact. It measures how often an article is cited, correcting for the num�er of references and thus for su�-community size. More references increase the likelihood of citations, which should �e taken into account. According to this measure, particularly those journals that are lower ranked in the former standard proceedings have a higher impact within their su�discipline.
We collect data on all articles and reviews pu�lished in the journals selected within the time period 1997-2007. We exclude �ook reviews, editorial material and proceedings. We also exclude pu�lications for the years 2008/2009 for two reasons. First, �ecause we measure editorial �oard mem�ership in the year 2009. �he time lag ensures that our rankings exclude authors who started to pu�lish their research in 2008/2009, and who thus had no chance of �eing considered a possi�le �oard candidate. Second, �e-cause we use the average num�er of yearly citations and the journal impact factor as control measures. On average, articles get the most citations within two years after they are pu�lished �Garfield�1979)). �his information helps us to standardize citation rates. �o identify several articles �y one scholar and his or her editorial �oard mem�ership, we check the data �y using the institutions and countries of scholars with misleading names or initials of first names.
18 �he missing ranking positions are shared �y marketing and finance journals, i.e., �y different research commu-�he missing ranking positions are shared �y marketing and finance journals, i.e., �y different research commu-nities.
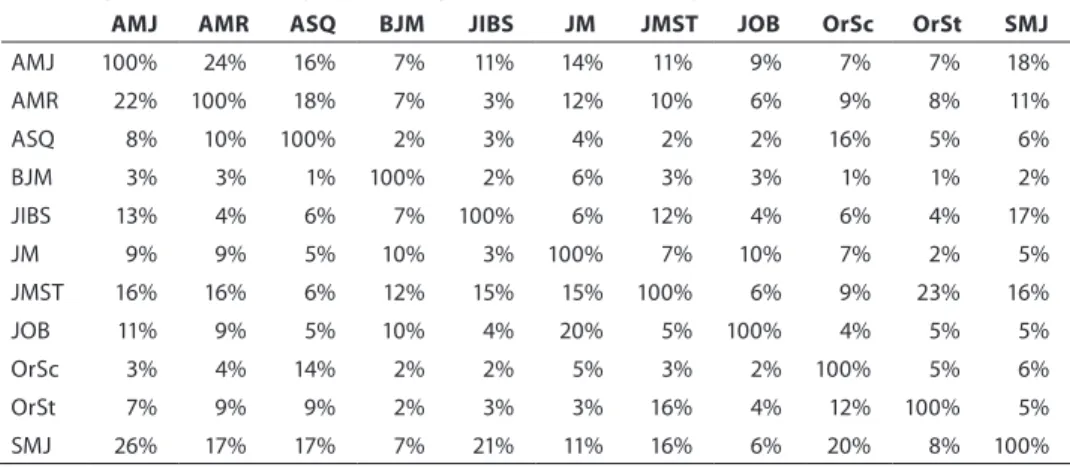
19 We further cross-validated the community-aspect �y analyzing journal relatedness. First, we evaluated the per-We further cross-validated the community-aspect �y analyzing journal relatedness. First, we evaluated the per-centage of citations �etween the journals �information availa�le in ISI we� of knowledge). �he results su�stan-tiated that the included journals often refer to each other indicating one community. Second, we examined how often authors have articles in two or more of the included journals. �he findings validated that many scholars indeed pu�lish in several journals of our sample. �hird, we examined how often scholars are editor �oard mem-�ers in two or more of the included journals. �he findings validated that the included journals are related to each other �y cross-editorship.
Table 1: Top-Journals of the management and organization research community i ii iii iV V Vi Vii Journal Rank/ 2007 JCR1 2007 JCR1 Rank of 81 Manage-mentJ. 2007 JCR1 Rank of 129 BusinessJ. 2009 HB2 BWL Jourqual2008 3 wiss. Qualität 2008 Jourqual Rating3 Rank/ 1997-2007 Citations per Reference4 academy of Management Journal (1) 5.02 (2) (2) 1 9.08 a+ (11) 1.27 academy of Management review (2) 4.37 (3) (3) 1 9.07 a+ (9) 1.49 Organization Science (3) 3.13 (4) (6) 0.7 8.90 a (7) 2.38 administrative Science Quarterly (4) 2.91 (5) (7) 1 9.48 a+ (10) 1.43 Strategic Management Journal (5) 2.83 (6) (8) 0.7 8.41 a (8) 1.77 Journal of intern. Business Studies (6) 2.28 (10) (12) 0.7 8.81 a (5) 3.33 Organization Studies (7) 2.04 (12) (15) 0.7 7.99 B (3) 5.30 Journal of Management (8) 2.00 (13) (16) 0.7 7.85 B (6) 3.27 Journal of Organizational Behavior (9) 1.98 (14) (17) 0.7 7.40 B (4) 3.41 Journal of Management Studies (10) 1.93 (16) (19) 0.7 7.55 B (2) 6.19 British Journal of Management (11) 1.53 (27) (36) 0.5 7.28 B (1) 8.96 legend:
1 Journal citation report (Jcr) of the iSi Web of Knowledge (the thomson corporation (2008)). Jcr indicates how often an article gets cited within the first two years after publishing.
2 handelsblatt (hB) ranking BWl (handelsblatt (2009)). Journals scores reach from one to zero. higher valueJournals scores reach from one to zero. higher value indicates higher journal impact. Journal scores are obtained from a combination of journal citation reports and reputation rankings.
3 Official journal ranking of the VhB (hennig-thurau, Welsh, and Schrader (hennig-thurau, Welsh, and Schrader (2004)). higher values indicate. higher values indicate higher journal impact. We obtain journal scores from survey data and intend to capture quality aspects. 4 Self-constructed measurement: Journal impact = ∑references per article/∑citations per article. Sample:
T = 1997-2007, N = 5,794 authors with 5,509 articles..
3.2 dependent vaRiable
Editorial board membership. In May 2009 we consulted the home page of each journal in our sample and collected the names of scholars who were serving as editors, co-editors, or �oard mem�ers at that time. �here are two possi�le definitions of edito-rial �oard mem�ership. �he �roadest possi�le definition includes all positions, i.e., edi-tor, co-ediedi-tor, and �oard mem�er. In our initial sample 1,316 persons held at least one
editor, co-editor, or �oard position; 16.4�� individuals had more than one position. We construct a varia�le Editor Board Membership for 2009, identifying the num�er of edi-tor, co-editor or �oard mem�er positions of a person. In the second definition, �oard definition includes only �oard mem�er positions. In our initial sample 1,181 persons held at least one �oard position; 15.3�� had more than one position. We construct a varia�le Board Membership, which indicates the num�er of �oard mem�er positions of a person in 2009.
We find that 465 scholars, all �oard mem�ers, had not pu�lished an article in any of the journals selected during the last ten years. �his finding is a first indication of the accuracy of our hypothesis, suggesting that the pu�lication record of scholars does not inevita�ly reflect his or her a�ility to perform well as an editorial �oard mem�er. How-ever, the finding could reflect the need for appropriate representation, e.g., for the rep-resentation of different countries. We exclude these scholars without pu�lications from our statistical analysis �ecause it is possi�le that the empirical findings are driven �y lazy scholars sitting in editorial �oards0. For the regression analysis our measurements of Editor Board Membership examine 851 active editors, co-editors, or �oard mem�ers, and for Board Membership 716 active �oard mem�ers.
3.3 independent vaRiable
Publication record. For each author we count all articles pu�lished in the selected journals. We adjust for tenure effects, since experienced scholars have a higher pro�-a�ility of �eing a �oard mem�er. For each scholar we calculate the yearly num�er of articles pu�lished �eginning with the year of his or her first pu�lication. For example, if a scholar pu�lished his or her first article in the year 2000, we average the num�er of articles over eight years. �he year of entry into the research community is a �etter adjustment for tenure effects compared with age. Age does not account for the effective time a scholar is part of the community. In particular, U.S. scholars often start their research careers after they have careers in the industry.
3.4 ContRol vaRiables
We also include several control varia�les that may affect editorial �oard mem�ership, and which are related to the pu�lication record of a scholar �ut do not necessarily re-flect quality aspects.
Co-authorship. We consider the average num�er of co-authors per article. For each scholar we use the sum of co-authors over all articles and divide it �y the num�er of arti-cles. Scholars with a higher num�er of co-authors may increase the num�er of pu�lished articles due to economies of scale. Further, they may have a higher direct influence within their research community and thus a higher likelihood of �ecoming a �oard mem�er. 20 However, the empirical findings are compara�le if we include editors without pu�lications.However, the empirical findings are compara�le if we include editors without pu�lications.
Citations. We measure the average num�er of citations per article for every author. �he index is a proxy of scholars’ visi�ility, for example, due to conducting high-quality research, pu�lishing dominant theories, �eing the target of herding �ehaviour, or en-gaging in citation networks �Moed et al.�Moed et al.�1985)). Authors who have high visi�ility may. Authors who have high visi�ility may increase their pu�lication record and their likelihood of �ecoming a �oard mem�er. We adjust the num�er of citations �y the age of each pu�lication.
Citations =
Ʃ
Ʃ
_________________ Citations per Article Age of publication ___________________Ʃ
Articles (1)Journal Impact. We also use �he �homson Corporation �2008) index to control for the average journal impact factor per article. �his index measures the likelihood of �oard mem�ership due to reputation effects. Authors who pu�lish in highly visi�le journals may gain higher visi�ility themselves.
Entry Year. Even though we adjust the pu�lication record for tenure effects, we also control for entry year, i.e., the year of the first pu�lication. Esta�lished scholars have a higher pro�a�ility that an academic will �ecome an editorial �oard mem�er. Authors can demonstrate a continuous pu�lication history and could have accumulated a higher stock of expert knowledge. �hey may also have higher social capital. Because of their expert knowledge, experience, and social capital, such scholars may have a higher yearly pu�lication record.
Pages. We measure the average num�er of pages per article. Longer articles may �e an indication for more essential research �Hofmeister and Ursprung�2008)) and thus increase the pro�a�ility of pu�lishing or �ecoming an editorial �oard mem�er. How-ever, the length of an article may not necessarily reflect quality aspects. It could alsonecessarily reflect quality aspects. It could also reflect different research streams �e.g., theoretical research). Both issues may affect an academic’s pu�lication record and editorial �oard mem�ership.
3.5 independent vaRiablefoR Robustness test
Corrected Research Output. We test the ro�ustness of our results �y applying a ad- ad-justed indicator for research evaluation as suggested �y Hofmeister and Ursprung �2008). Instead of counting the num�er of A+ articles, this output measurement cap-tures quality and effort aspects. �he index multiplies the num�er of pages with the journal impact factor and corrects for the num�er of co-authors. Hofmeister and Urs-prung ��2008)) suggest applying this index within the Handels�latt-Ranking&. 21 Currently, the following formula is applied:Currently, the following formula is applied:
�he formula corrects for the num�er of co-authors, �ut not in a linear way. For example, in a journal with the �he formula corrects for the num�er of co-authors, �ut not in a linear way. For example, in a journal with the impact “1” an article without co-authors o�tains the value “1”, with one co-author the value “.67” and with two co-authors the value “.5”.
Corrected Research Output =
Ʃ
Ʃ
______________________________Pages per Article * Journal Impact per Article Co-authors per Article ________________________________
publication tenure (2)
3.6 analysis
We use Poisson regression analysis to predict the dependent count varia�les Editor Board Membership and Board Membership and include the linear and quadratic term of pu�lication record. �he distri�utions of the independent varia�les publication record, co-authorship, citations, and pages are extremely skewed and may corrupt the regression results due to outliers. We transform these varia�les �y taking the logarithm.
Log (E(Editor Board Membership |xi=a+b1(log Publication record) (3) + b2(log Publication record2) + b3(log Co-authorship)
+ b4(log Citations) + b5(log Pages) + b6(Journal Impact) + b7(Entry Year)
We apply three ro�ustness checks. First, we run separate regression models for each entry year. Second, for one of the most important journals, we run a regression model that includes former editorial �oard mem�ers. �hird, we test if our results hold for the corrected measure of research output.
4 empiRical Results 4.1 desCRiptive findings
Table 2 presents the results of a ranking of scholars according to the num�er of editorial �oards on which they serve. The ta�le shows every scholar who holds three or more Editor Board Membership positions. The ta�le compares their positions with the position of those scholars in two pu�lication rankings. �o o�tain pu�lication positions, we rank all scholars of our sample according to their yearly pu�lication record and corrected research output in our sample. The results show that among the 48 scholars holding three or more edito-rial �oard positions, only three would �e ranked among the 100 most successful scholars in a ranking according to pu�lication record. The ta�le further shows that if they were ranked according to corrected research output, then only three of these authors would �e ranked among the 100 most successful scholars. Figure 1 illustrates how an editorial 23 Of course we could argue that all pu�lications of these scholars should �e included, not just their pu�licationsOf course we could argue that all pu�lications of these scholars should �e included, not just their pu�lications in the 11 journals. However, all rankings are restricted to this list of journals and only articles pu�lished in these journals were counted. In contrast to many rankings, we did not select our journal list randomly, �ut �y means of community aspects.
Table 2: Editorial Boards according to Individual Scholars
Scholar name Number of ��itor Boar���itor Boar� Membership Positions (e�itor, co-e�itor or
boar� member)
Number of ��itor��itor Positions (e�itor, co-e�itor)e�itor, co-e�itor)
Publication Recor� (Ranking PositionRanking Position accor�ing to PublicationPublication
Recor�)
Correcte� ResearchResearch Output (Ranking (Ranking Position accor�ing to
Correcte� ResearchResearch Output) cannella, aa 6 0 0.97 (82) 38.35 (131) reuer, JJ 5 2 0.93 (93) 31.07 (213) Floyd, SW 5 2 0.73 (213) 16.83 (792) inkpen, a 5 0 0.69 (488) 24.89 (381) hodgkinson, gP 5 0 0.69 (488) 6.2 (2463) lepak, d 5 1 0.44 (1188) 10.72 (1466) hitt, Ma 4 0 1.29 (18) 49.07 (73) lounsbury, M 4 2 0.76 (183) 49.65 (72) cornelissen, JP 4 2 0.69 (488) 34.67 (160) Kostova, t 4 0 0.64 (798) 29.24 (249) henisz, WJ 4 2 0.63 (809) 27.61 (302) ashkanasy, nM 4 2 0.63 (809) 12.79 (1205) Foss, nJ 4 0 0.51 (1010) 17.19 (766) Bartunek, JM 4 0 0.49 (1091) 16.48 (817) Jarzabkowski, P 4 0 0.34 (2021) 15 (949) Maitlis, S 3 0 0.88 (124) 73.14 (20) george, JM 3 0 0.88 (124) 26.68 (330) dobrev, Sd 3 0 0.76 (183) 41.76 (105) Birkinshaw, J 3 0 0.75 (189) 22.93 (444) greenwood, r 3 0 0.74 (198) 30.73 (215) hoskisson, re 3 2 0.74 (198) 24.1 (394) Filatotchev, i 3 0 0.74 (198) 16.01 (868) Mcnamara, gM 3 0 0.7 (219) 20.7 (539) Shen, W 3 0 0.69 (488) 28.97 (256) certo, St 3 0 0.69 (488) 19.01 (645) takeuchi, r 3 0 0.69 (488) 16.05 (852) chang, SJ 3 2 0.64 (798) 28.99 (255) roth, K 3 1 0.64 (798) 26.01 (356) Brass, dJ 3 0 0.64 (798) 19.85 (582) Bansal, P 3 0 0.63 (809) 29.49 (247) Makino, S 3 0 0.61 (832) 16.41 (820) delios, a 3 2 0.61 (832) 2.36 (4180) Balogun, J 3 0 0.59 (854) 23.53 (415) ethiraj, SK 3 0 0.56 (893) 30.4 (220) george, g 3 0 0.56 (893) 21.72 (494) Swaminathan, a 3 2 0.53 (957) 24.67 (385) tallman, SB 3 2 0.53 (957) 11.5 (1363) Baker, t 3 0 0.51 (1010) 21 (524) anand, J 3 0 0.49 (1091) 13.75 (1089) Jensen, M 3 0 0.47 (1119) 40.92 (111) Sorge, a 3 1 0.47 (1119) 14.91 (956) durand, r 3 0 0.45 (1162) 17.78 (729) delbridge, r 3 0 0.44 (1188) 6.01 (2535) Suddaby, r 3 0 0.41 (1542) 22.68 (455) chattopadhyay, P 3 0 0.37 (1870) 14.5 (1012) Sparrowe, rt 3 0 0.37 (1870) 12.71 (1207) Seidl, d 3 0 0.34 (2021) 12.62 (1216) robson, M 3 1 0 (5635) 0 (5387)
�oard mem�ership ranking is related to a ranking according to the pu�lication record of an author. The results show that many scholars listed in a pu�lication ranking in the fore-most ranks would not even �e listed in a quality ranking, while many academics listed in a �oard mem�ership ranking in the foremost ranks would �e listed in a quantity ranking in the lowest ranks. The results con��rm that a ranking of individual scholars depends heavily on the type of ranking used and thus con��rm the results of our ��rst study on this topic �Frey and Rost �2010)).
Figure 1: Ranking Comparison of Individual Scholars according to Publication Record and Editorial Board Membership
Number of Board Membership P ositions 7 6 5 4 3 2 1 0 0 1 2 3 4
Number of Articles per year
4.2 statistiCal findings
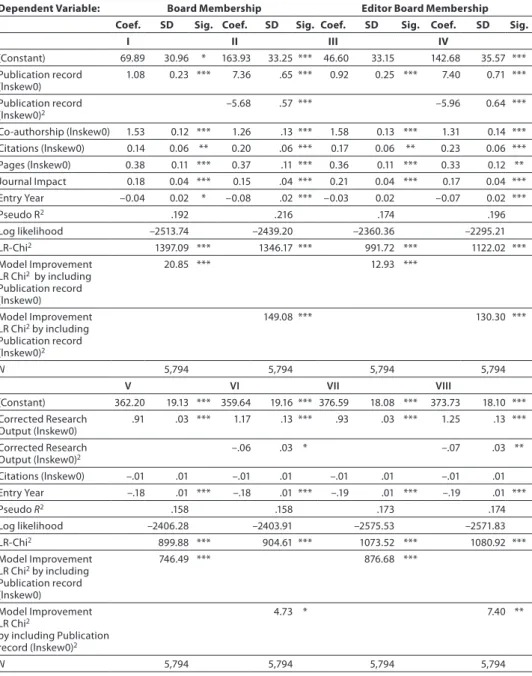
Table 3 shows the results of the Poisson regression analysis for Editor Board Membership
and Board Mem�ership.
Linear model. In the linear model, an academic’s the pu�lication record shows a strong positive effect on the num�er of �oard mem�ership positions �see Columns I and III). �he explanatory power of the model significantly improves if we include the linear term of pu�lication record. �Model Improvement for editor �oard mem�ership:Model Improvement for editor �oard mem�ership:: 20.85***, Model Improvement for �oard mem�ership: 12.93***.) �he results show thatModel Improvement for �oard mem�ership: 12.93***.) �he results show that: 12.93***.) �he results show that in general, scholars with more pu�lications have a higher pro�a�ility of �eing selected as a �oard mem�er.
Quadratic model. Columns II and IV report the results when we also include the quadratic terms of pu�lication record. Compared with the linear model, the explana-tory power signi��cantly improves if we include the quadratic term �Model Improvement for editor �oard mem�ership: 149.08***, Model Improvement for �oard mem�ership:
Table 3: Determinants of Board and Editor Board Membership
Dependent Variable: Board Membership Editor Board Membership
Coef. SD Sig. Coef. SD Sig. Coef. SD Sig. Coef. SD Sig.
I II III IV (constant) 69.89 30.96 * 163.93 33.25 *** 46.60 33.15 142.68 35.57 *** Publication record (lnskew0) 1.08 0.23 *** 7.36 .65 *** 0.92 0.25 *** 7.40 0.71 *** Publication record (lnskew0)2 –5.68 .57 *** –5.96 0.64 *** co-authorship (lnskew0) 1.53 0.12 *** 1.26 .13 *** 1.58 0.13 *** 1.31 0.14 *** citations (lnskew0) 0.14 0.06 ** 0.20 .06 *** 0.17 0.06 ** 0.23 0.06 *** Pages (lnskew0) 0.38 0.11 *** 0.37 .11 *** 0.36 0.11 *** 0.33 0.12 ** Journal impact 0.18 0.04 *** 0.15 .04 *** 0.21 0.04 *** 0.17 0.04 *** entry year –0.04 0.02 * –0.08 .02 *** –0.03 0.02 –0.07 0.02 *** Pseudo r2 .192 .216 .174 .196 log likelihood –2513.74 –2439.20 –2360.36 –2295.21 lr-chi2 1397.09 *** 1346.17 *** 991.72 *** 1122.02 *** Model improvement lr chi2 by including Publication record (lnskew0) 20.85 *** 12.93 *** Model improvement lr chi2 by including Publication record (lnskew0)2 149.08 *** 130.30 *** N 5,794 5,794 5,794 5,794 V VI VII VIII (constant) 362.20 19.13 *** 359.64 19.16 *** 376.59 18.08 *** 373.73 18.10 *** corrected research Output (lnskew0) .91 .03 *** 1.17 .13 *** .93 .03 *** 1.25 .13 *** corrected research Output (lnskew0)2 –.06 .03 * –.07 .03 ** citations (lnskew0) –.01 .01 –.01 .01 –.01 .01 –.01 .01 entry year –.18 .01 *** –.18 .01 *** –.19 .01 *** –.19 .01 *** Pseudo R2 .158 .158 .173 .174 log likelihood –2406.28 –2403.91 –2575.53 –2571.83 lr-chi2 899.88 *** 904.61 *** 1073.52 *** 1080.92 *** Model improvement lr chi2 by including Publication record (lnskew0) 746.49 *** 876.68 *** Model improvement lr chi2 by including Publication record (lnskew0)2 4.73 * 7.40 ** N 5,794 5,794 5,794 5,794 legend: Poisson regression, † p < 0.10, * p < 0.05, ** p < 0.01, *** p < 0.001.
lnskew0 indicates the zero-skewness logarithm of a variables, i.e., the variable is added with the constant “1” so that the logarithm can be also taken from values of zero.
130.30***). When we compare the CH2 statistisc, which indicate the improvement of the explanatory power of a statistical model, �etween the linear and quadratic models, we see that a model that includes the quadratic model is signi��cantly �etter a�le to explain the appointment of scholars in editorial �oards. Thus, even if the overall effect of the pu�lica-tion record on �oard mem�ership is positive, the link �etween the measure of quantitative rankings and the measure of qualitative rankings is not strictly linear.
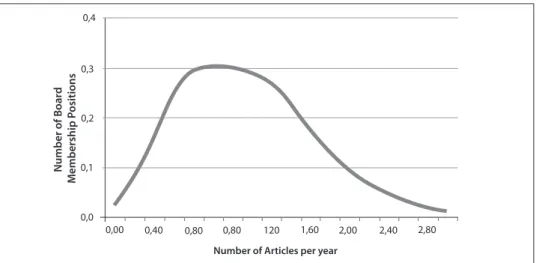
Figure 2: Predicted Relation between Publication Record and Board Membership
Number of Board Membership P ositions 0,4 0,3 0,2 0,1 0,0 0,00 0,40 0,80 0,80 120 1,60 2,00 2,40 2,80
Number of Articles per year
Figure 2 shows the predicted curve shape for the example of �oard mem�ership �results of Table 3, Column II). The results support our hypothesis �y showing that the pu�lica-tion record of an academic shows an inverse, U-shaped relapu�lica-tion to his or her num�er of editorial �oard mem�ership positions. According to the results, authors with a yearly pu�lication record of around 0.8 articles have the highest chance of �eing elected to a �oard mem�ership. But �oth a lower and a higher pu�lication record decreases this pro�a�ility. This ��nding shows that journals are indeed interested in appointing �oard mem�ers who show a continuous pu�lication history, �ut they are not interested in having �oard mem�ers who have a very large num�er of pu�lications.
4.3 Robustness CheCk
We perform three ro�ustness checks to validate our results.
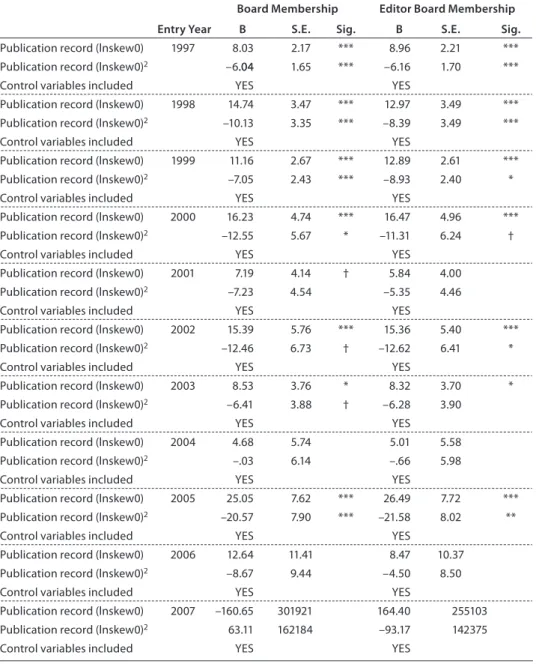
First, we analyze the data to see if the curvilinear relation is driven �y tenure effects. Even if we control for the year of ��rst pu�lication, it is possi�le that even experienced scholars will show a medium or low pu�lication record. Therefore, we divide the sample into su�groups �y using the varia�le entry year and run separate regressions for groups of
authors who start to pu�lish within the same year. The results show that the curvilinear effect of the pu�lication record is ro�ust and signi��cant. The effects get weaker for scholars with very short community tenure.
Second, we analyze the data to see if the inclusion of former �oard mem�ers would change the results. Since many journals rotate their editorial �oards, it may �e the case that researchers are no longer mem�ers of the �oard �ut are still well respected. Including these scholars could change our results. We select the Academy of Management Journal �AMJ) �ecause it had recently changed its editorial �oard. We predict the mem�ership in the current and/or former AMJ �oard �y including the data for all authors who had pu�lished at least one AMJ article �etween 1997 and 2007. Including these individuals does not change our general ��ndings of a curvilinear effect of pu�lication record on �oard mem�ership5. We also validate the ��ndings on the AMJ �oard �y excluding all academics who have already served as a �oard mem�er �ut who were not serving on the �oard in 2009. The ��ndings also show a signi��cant curvilinear effect.
Third, proponents of quantitative rankings often argue that if they are correctly admin-istered, rankings measure every aspect of research quality. For example, Hofmeister and Ursprung ��2008)) suggest that the quality and effort aspects of research are �etter captured if output indicators multiply the num�er of pages per article �y the journal impact factor of an article and also correct for the num�er of co-authors. We count the index for every scholar in our sample. Table 3 shows the results.
In the linear model the results again show that academics with a higher research output have more �oard mem�er positions �Columns V and VII). Columns VI and VIII report the results when we also include the quadratic terms of research output. The negative and signi��cant quadratic terms again support that the corrected research output of a scholar also shows an inverse, U-shaped relation to his or her num�er of �oard mem�ership posi-tions. However, compared to the linear model, the additional explanatory power of the quadratic model is lower, as we can see in Table 3. It indicates that the corrected research output of a scholar may �e a �etter measurement of research quality than simple pu�lica-tion counts. But even the corrected measure of quantitative rankings and the measure of qualitative rankings is not strictly linear. The results thus su�stantiate that quantitative and qualitative rankings do not show the same results with respect to the position of scholar within �oth rankings.
We also perform ro�ustness checks �y calculating research output with a formula that, instead of using the journal impact factor, values an A+ level pu�lication at nine, a A- level pu�lication at three, and a B-level pu�lication at one. �We measure journal quality according to the Jourqual 2008.) These results are compara�le to the results in Table 3. We note that we are not a�le to overcome possi�le endogeneity pro�lems. It seems plau-si�le that the election of an academic to editorial �oards may increase his or her pu�-24 �he results are availa�le on request from the authors.�he results are availa�le on request from the authors.
lication output. However, this �ias should �e small, �ecause the u-shaped relation �e-tween pu�lication output and editorial �oard mem�ership suggests that editorial �oard mem�ers do not have a maximum of pu�lications.
5 discussionand conclusion
We argue that quantitative rankings, e.g., pu�lication or citation measures, capture only some aspects of scienti��c research quality �see also Frey and Rost �2010)). For that reason, we have developed an alternative ranking system that is �ased on mem�ership on academic editorial �oards of professional journals. This qualitative ranking considers the reputation and recognition of scholars among their peers, and recognizes their contri�utions to the research community in terms of reading and reviewing the work of others.
In this article we compared the results of quantitative and qualitative rankings of indi-vidual scholars in a more systematic way. �he empirical results indicate that the posi-tion of a scholar in qualitative rankings, i.e., using the selecposi-tion in editorial �oards as a quality indicator, is not strictly related linearly �ut instead shows an inverted U- shape to his/her position in quantitative rankings, i.e., his/her num�er of �A+) pu�lications. Especially for scholars who score high in pu�lication rankings, our study suggests that rankings �ased on the quantity of pu�lications are incompati�le with rankings �ased on mem�ership on editorial �oards. �his finding suggests that the two indexes do not measure the same phenomenon. Science needs �oth types of scholars; those who are productive in terms of pu�lishing and those who are productive in terms of running journals. For that reason, research evaluations should consider multiple criteria rather than just pu�lication or citation counts.
This conclusion is in line with prior research. Henrekson and Waldenstrom ��2007)) rank every full professor in economics in Sweden using seven esta�lished measures of research performance. Their analysis shows that the ranking can vary greatly across measures and that depending on the measure used, the distri�ution of total research output is valued very differently. This ��nding is also validated �y other authors �Coupé�2003); Donovan and Butler�2007); Lo et al.�2008)) who suggest that research quality can only �e captured through multiple indicators. This result is in line with �i�liometric research that warns against using pu�lications and citations as the only measure for capturing the research effort of individuals, especially individuals in the social sciences �van Raan�2003)). For the career decisions of individual scholars, �i�liometric rankings should �e used with utmost care. “Crude rankings … cannot �e helpful to the policy maker” �Johnes�1988)). Funding agencies and other decision makers who must evaluate the research efforts of indi-vidual researchers or of the whole university sector should go �eyond applying standard quantitative measures of research performance to the social sciences �Katz�1999); Luwel et al.�1999); Council for the Humanities Arts and Social Sciences�2005)). Research quality is diverse, uncertain, and multidimensional. It is highly questiona�le that there exists just one, true indicator of research quality that captures the efforts of scientists within all research communities to the same extent. In some communities, for example,
only empirical research constitutes good research, while in other communities it is more important to pose a novel research question or to contri�ute an original theory. For this reason, indicators that capture research quality are not only multidimensional, �ut also highly dependent on the speci��c research community.
But what are the alternatives for research evaluation? One way to solve the multiple-tasking pro�lem would �e to measure all the aspects that are important for an academic career: teaching, supporting younger scholars, connecting to the pu�lic, and participating in academic administration or editorial �oard mem�ership �Frey�2010)). However, attempting to measure all important aspects would lead to an enormous amount of evalu-ation, and scholars would invaria�ly ��nd ways to ‘�eat the system’.
A different option would �e to return to approved methods, i.e., to an overall evalua-tion of �young) scholars �ased on the intuievalua-tion and knowledge of seasoned scholars �Frey �2010)). There are various ways to select such persons. An attractive option would �e to elect them �y a vote among the mem�ers of the respective professional organization. Doing so would ensure that the peers making up the so-called ‘‘Repu�lic of Science’’ would remain in control. The academics selected �y such a procedure would �e under the scrutiny of the profession as a whole and would lose their reputation among their peers if they pushed unfounded personal interests. The scholars who were chosen would have an incentive to decide as o�jectively as possi�le while maintaining an un�iased perspective. This option offers the mem�ers of professional organizations more competence and control compared to the system prevailing today, and helps them to ��ght the unilateral tendency of young scholars to put their whole effort into pu�lishing A-level articles while neglecting other tasks. Nevertheless, such a procedure is viewed as ‘‘unscienti��c,’’ as it is not �ased on the allegedly o�jective calculation of pu�lications in A-level journals. But such a view is too simple. According to recent psychological research, ‘‘gut feelings’’ are often superior to in-depth analyses �Gladwell�2005); Gigerenzer�2007)). Indeed, many esta�lished scholars proceed intuitively when they exchange their views a�out younger scholars. What matters to them is that they feel good a�out a young scholar, and not whether someone has pu�lished an article in a particular A-level journal. Using the gut feelings of seasoned scholars has, of course, disadvantages. There is certainly the danger of promoting an ‘‘old �oys’ network,’’ thus giving young scholars an incentive to pander to the seasoned scholars. Personality and friendship may matter more than research excellence �ecause gut feelings are to some extent influenced �y such perceptions. On the other hand, these alleged disadvantages should not �e overrated. It is important to remem�er that the present system, which focuses on A-level journal pu�lications, is also influenced �y personal relationships and preferences, as well as �y sel��sh interests. It has, for instance, �ecome common practice to a�undantly and positively cite possi�le referees to raise the chance of acceptance. Even more importantly, scholars in dire need of having their articles pu�lished feel that they must follow the referees’ ‘‘advice’’ even if those directives differ from their own insights and views. This �ehavior has �een called ‘‘academic prostitution’’ �Frey�2003)).
A third possi�ility is to restrict pu�lication rankings to the early years of a scienti��c career �Osterloh and Frey�2008; 2010)). Scientists must ��rst learn the tools of the trade and must show that they are a�le to use them well. Thereafter, scholars should �e a�le to proceed
as they see ��t for themselves. This restriction allows them to then exhi�it their inherent motivation in scienti��c research for at least the remaining part of their careers. An o�vious disadvantage of the restriction of pu�lication rankings to the early years of a scienti��c career is that scholars in later stages of their careers are not su�jected to any external monitoring and may no longer engage in research. This may well �e the case, �ut an academic system could �e designed to ena�le the �est rather than to prevent the worst.
Yet another possi�ility would �e to more openly shape several levels of scientific careers �Frey�2010)). In particular, there should �e careers at universities and research insti-tutes for which it is sufficient to have pu�lished in one or a few of the hundreds of gen-eral and specialized journals, or to have �een pu�lished in the �ooks and internet pu�li-cations, or to have participated in current pu�lic de�ates. Such a policy would produce a �roader portfolio in the management profession with respect to type of contri�ution, content, techniques, and universities. �hrough the present focus on A-level pu�lica-tions, diversity – a crucial requirement to guarantee originality - is indeed threatened as �Osterloh and Frey�2008)).
Each of these �and possi�ly other) options has �oth its advantages and disadvantages, all of which must �e carefully considered. �his article does not promulgate any of the options discussed. However, we do want to call attention to the major shortcomings of quantitative rankings: Pu�lication or citation rankings ignore important scholarly con-tri�utions, e.g., the investment in multiple and/or difficult tasks, which are important for research. �hus, in the long run, quantitative research rankings may crowd out such contri�utions, worsening, instead of improving, research quality.
appendix
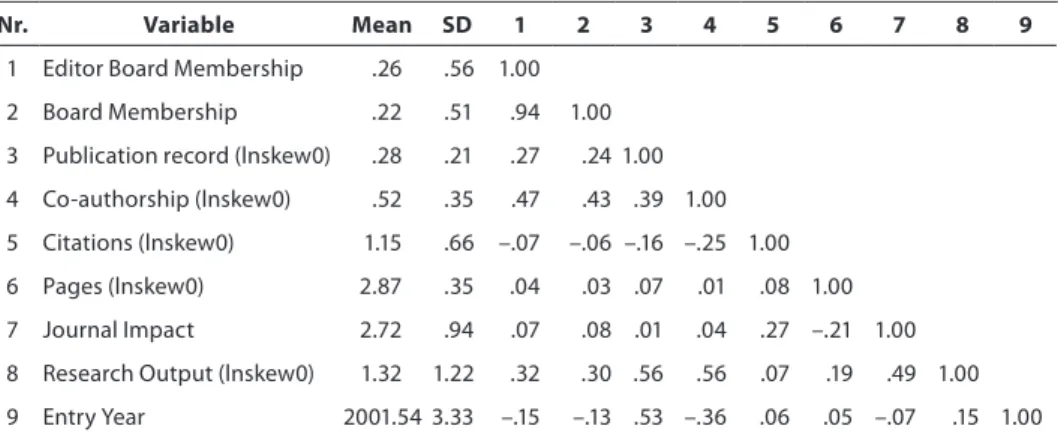
Table A1: Descriptive statistics and bivariate correlations
Nr. Variable Mean SD 1 2 3 4 5 6 7 8 9
1 editor Board Membership .26 .56 1.00
2 Board Membership .22 .51 .94 1.00
3 Publication record (lnskew0) .28 .21 .27 .24 1.00 4 co-authorship (lnskew0) .52 .35 .47 .43 .39 1.00 5 citations (lnskew0) 1.15 .66 –.07 –.06 –.16 –.25 1.00
6 Pages (lnskew0) 2.87 .35 .04 .03 .07 .01 .08 1.00
7 Journal impact 2.72 .94 .07 .08 .01 .04 .27 –.21 1.00
8 research Output (lnskew0) 1.32 1.22 .32 .30 .56 .56 .07 .19 .49 1.00
9 entry year 2001.54 3.33 –.15 –.13 .53 –.36 .06 .05 –.07 .15 1.00
legend: N = 5794
lnskew0 indicates the zero-skewness logarithm of a variables, i.e., the variable is added with the constant one so that the logarithm can be also taken from values of zero.