2018
The flipped classroom with tutor support: an experience in a level one
The flipped classroom with tutor support: an experience in a level one
statistics unit
statistics unit
Ramzan N. Khan
The University of Western Australia, [email protected]
Rashmi Watson
The University of Western Australia, [email protected]
Follow this and additional works at: https://ro.uow.edu.au/jutlp
Recommended Citation
Recommended Citation
Khan, Ramzan N. and Watson, Rashmi, The flipped classroom with tutor support: an experience
in a level one statistics unit, Journal of University Teaching & Learning Practice, 15(3), 2018.
Available at:https://ro.uow.edu.au/jutlp/vol15/iss3/3
of discussion in teaching and learning forums. However, its adoption in mathematics and statistics has been subdued. Most higher education mathematics and statistics are still delivered through traditional lectures where students are passive participants. In this study, experiences of flipping a large first-level statistics class are presented. The implementation included a combination of peer learning and tutor-assistance in lectures. Student performance, in the form of final examination and overall marks over four semesters (two with traditional delivery and two flipped), were analysed for differences with respect to the two teaching modes after adjusting for demographic differences. In addition, student survey data were analysed with a view to revealing any relationship between attitude towards a flipped classroom and performance. The results showed that students' performance improved and an increased understanding of concepts was achieved through the flipped classroom approach. Evidence also indicated an increase in learner engagement. Student feedback indicated a higher preference for a flipped mode overall and in particular for ages 20 and below.
Keywords
Keywords
flipped classroom, peer learning, tutor assistance, mathematics, statistics
Cover Page Footnote
Cover Page Footnote
Introduction
Higher education pedagogy is constantly evolving. In particular, alternatives to the traditional lecture have been under the spotlight for the past two decades. In Australia, this has been partly due to the decline in lecture attendance, precipitated by the availability of lecture recordings which is now a norm in most Australian universities (Karnad 2013). Another important aspect is the growing demand for online delivery of material and courses, partly to meet the requirements of remote and part-time students. An important and growing pedagogical approach is the flipped classroom, the subject of this study. We compare the performance of students under a flipped classroom versus traditional lectures, adjusted for demographic variables and student background, based on statistical analysis of the data. Further, we compare student engagement as well as investigating student preference for the two modes of delivery.
This paper is organised as follows. Section 2 discusses the rationale and aspects of the flipped classroom. Section 3 considers the essential elements of a flipped classroom, and Section 4 discusses the relationship of flipped mode to learning theories. Section 5 presents the methodology of this study, and Section 6 contains the results of data analysis. Finally, discussion and conclusions are presented in Section 7.
The Flipped Classroom
Traditional lectures have the disadvantage that the student is a passive participant in the learning process. A lecture is perhaps not the most effective way of delivering content, nor the best use of valuable class time (Bligh 2000). Compared with the traditional lecture, flipping implies an inversion of expectation argues (Berret 2012). That is, the delivery of content is moved out of class time and replaced by interactive activities that engage students by creating an active learning environment, and enhance and deepen learning. Andrews et al. (2011) claim that the passive nature of traditional lectures is a reason for many of the learning difficulties experienced by undergraduates. Richardson et al. (2012) reported based on meta-analysis that conscientiousness, concentration and deep approach to learning, characteristics typically associated with active learning, positively affect student achievement.
Technology allows for a dialogue-based teaching paradigm, often referred to as blended learning or the flipped classroom. Flipping or blended learning has many forms (Berrett 2012). A key aspect of this paradigm is delivering some content outside of the traditional face-to-face classroom time. Such delivery can take the form of, but is not restricted to, listening to pre-recorded lectures, completing tasks prior to attending in-class sessions or responding to online quizzes.
The flipped classroom has many advantages. It allows students to progress at their own pace, preventing cognitive overload and better management of working memory (Clark, Nguyen & Sweller 2005). In particular, pre-recorded lectures can be paused and viewed again at times convenient to the student (Jungic et al. 2015). The student has time to think and assimilate the material instead of simply scrambling to keep up with note-taking. The rationale for using a flipped classroom approach is that the usually passive task of transferring content (i.e. lecture notes) from the teacher to the student occurs outside of class. Face-to-face class time can then be utilised in active and interactive learning, problem-based learning, peer learning, deepening and extending
knowledge, enhancing understanding, and clarifying misconceptions and misunderstanding. This allows optimal use of face-to-face class time, increases teacher-student interaction and accelerates the learning process. A further advantage is that a flipped classroom can accommodate a range of student abilities (Abeysekera & Dawson 2015). Further, students have different learning styles. The flipped classroom accommodates a wide variety of learning styles by providing a range of varied learning opportunities and experiences (Lage, Platt & Treglia 2000).
Literature on flipped classroom in tertiary mathematics and statistics is sparse. It is unclear from the literature if the flipped classroom results in improved student learning. Llobregat-Gómez et al. (2015) reported improved attendance and performance with blended learning in a first-year mathematics unit for aerospace engineering students. They used a flipped class for their weekly one hour Mathematica laboratory session. Jungic et al. (2015) flipped a first-year calculus class using pre-recorded lectures. This was followed by a pre-class online quiz. In the class they used the Mazur model (Mazur 1997; Crouch & Mazur 2001) of posing questions which the students answered using clickers, followed by peer discussions. They reported increased student engagement, but that the impact on student learning was inconclusive. Wiginton (2013) found students performed better in flipped classroom as compared to traditional learning environment, but his study was not adjusted for demographic differences. In contrast, Findlay-Thomas & Mombourquette (2014) found no difference in grades between the flipped class and the traditional class for a business course. Love et al. (2013) split a first-year linear algebra class into two, a traditional and a flipped class. They reported that the students in the flipped class were more engaged but performed no better than those in the traditional approach.
Deslauriers et al. (2011) compared two groups of students in a controlled experiment for a large physics class. One group received a flipped mode delivery by inexperienced instructors while the control group was taught in the traditional lecture mode by highly experienced instructors. They measured student engagement by four trained observers in each class using methods outlined in their supplementary material. They found on average a 40% improvement in engagement for students in the flipped classroom compared with the traditional delivery. They also reported an improvement in performance for the flipped class.
Taylor (2015) reported that many students prefer the traditional lecture, and that student performance and satisfaction were lower under the flipped classroom. Missildine et al. (2013) found that nursing students performed better in but were less satisfied with the flipped classroom compared with the traditional lecture or lecture supported with lecture-capture.
Herreid and Schiller (2013) suggest that students may be resistant to the flipped classroom as they may not be familiar with it and it requires more work by the student outside class time. Johnson (2013) argues that the flipped classroom assumes students are sufficiently motivated. Findlay-Thomas & Mombourquette (2014) advise that the concept of the flipped classroom and its advantages must be explained to the students. Moffett (2015) states that learners should be provided with the rationale for the flipped classroom. We also advocate that students be familiarised with the
modus operandi of the flipped classroom and its advantages, such as the development of self-learning, team work, interpersonal skills and formation of a community of learning. In addition, the flipped classroom provides students with the opportunity to develop graduate attributes of communication and interpersonal skills, team work, collaboration and critical thinking (Donleavy 2012).
Essential Elements of a Flipped Lecture
Flipping a class is a process that requires a great deal of preparation and experimentation, as with any changes to the pedagogical approach. It is important to note that, as with all teaching and learning, implementing the flipped class is individual and personal, and differs with the instructor and the material that is taught. Continuous improvements and refining will be necessary as the instructor learns from experience and implements new processes. The primary motivation is to provide direct and personalised assistance and increase interaction with the instructor. Kim et al. (2014) propose nine design principles for flipped classroom based on data from their study. Hamdan et al. (2013) discuss four pillars of flipped learning: (i) a flexible learning environment that allows a variety of learning models; (ii) a shift in the learning culture from a teacher-centred to a student-centred approach; (iii) intentional content, requiring educators to determine what content to teach directly; and (iv) professional educators, who are skilled in a wholistic approach to teaching and learning, and able to adopt to student needs and issues. These imply a change in the use of in-class and out-of class times. In particular, what is traditionally considered in-class work is done out of class, while what is traditionally considered “homework” is done in class.
Our experience and literature suggest that the following essential elements of a flipped classroom are critical to its success. These include the four pillars of Hamden et al. (2013) and also relate to the nine principles of Kim et al. (2014).
Pre-recorded lectures. An earlier attempt to flip this class was based on providing lecture notes that the students were required to read, and then attempt an online quiz before class. This was unsuccessful as students could not read and understand the lecture material. Strayer (2012) also reported low student satisfaction in a flipped introductory statistics class that did not have pre-recorded lecture, but was based around an online intelligent tutoring system. This is perhaps due to the low mathematical background of the class, and may not be an issue for higher level mathematics and statistics classes. Brame (2013) suggests that students should be provided with an opportunity to gain exposure to material before class.
Students also find recorded lectures useful for missed lectures and preparation for assessment tasks (Traphagan et al. 2010). The recordings need to be focused and short, each no more than fifteen minutes long. Evidence and experience indicate that students have short attention spans and find longer recordings frustrating, resulting in reduced viewing. Traphagan et al. (2010) report that a higher number of lecture viewings is associated with higher student performance. Each recording should cover only one major concept. As such more than one short recording may correspond to a traditional lecture.
Learning outcomes. Clearly stated learning outcomes are central to teaching and learning and essential in a flipped classroom. Talbot (2014) states that students need “a clear set of criteria against which to judge their learning progress”, and he further sets out a series of steps to produce learning outcomes that communicate clearly what is intended to be assessed. In particular, he recommends that the learning outcomes be ordered by complexity with reference to Bloom’s Taxonomy. A University of Queensland (http://www.uq.edu.au/teach/flipped-classroom/how-to-start.html, viewed 26 August 2018) guide states that learning outcomes are a key element of flipped classroom (see also http://ctl.centre.edu/flipped-classrooms.html, viewed 26 August 2018). Learning outcomes should be highlighted continually and linked to content so students can see the relevance of the material and a path through the material. Otherwise the presentation may seem disjointed and fragmented. Learning outcomes focus the students on the important concepts of the course, and direct the content and assessment tasks, a process known as constructive alignment (Biggs 1999)
Well-designed class material. The recorded lectures need to be supplemented with well-designed class material. Since content is no longer covered in class, appropriate material needs to be prepared that test, enhance and deepen students’ knowledge (Brame 2013). The material must be aligned to the learning outcomes, and can easily be graded so as to challenge and extend the better students. Learning activities need to encourage: class interaction; peer learning; deep rather than surface learning; and be intentional, meaningful and useful. Elements of critical thinking, problem solving and reflection should also be considered. The instructor needs to be alert to any misconceptions that students may have so these can be cleared. Similarly, tutorial and laboratory material need to be designed for a seamless continuation of instruction.
In-class support. The utilisation of peer learning immediately increases the number of instructors in the class. By peer learning we mean that those who know teach others in the class, as well as students arriving at solutions by group discussions and co-operative learning. However, the instructor is still the only expert whose time is shared among the students and may not be adequate to meet demand. Including other experts in the class is important from this point of view, allowing students as much access as they may want.
Homogeneous mode. The same flipped classroom should be maintained in all other classes, such as tutorials and laboratory sessions. These are smaller classes with one instructor, who can monitor the progress of the whole class. Peer learning and group discussions should be maintained in these sessions. A classroom culture that encourages interaction needs to be established and maintained in all the different learning activities.
Assessment. Student-centred teaching focuses on more formative rather than summative assessment to provide increased opportunities for feedback from peers, tutors and the lecturer. Nicol & Macfarlane-Dick (2006) provide a good guide to the principles of formative assessment. A variety of approaches at different times during the learning process should be used to assess student understanding. As in any teaching mode, the assessment tasks need to be carefully designed and aligned with learning outcomes and learning activities. Biggs (1999) terms the alignment of learning outcomes, learning activities and assessments as “constructive alignment”.
Learning Theories
The flipped classroom accommodates varying learning styles and aligns with different learning theories (Stewart 2012). Abeysekera & Dawson (2015) discuss the motivation, cognitive load and rationale for the flipped classroom. In particular, two theories are discussed: self-determination theory (SDT) proposed by Deci & Ryan (1985); and cognitive load theory (Sweller 1988). In the SDT framework, the three basic cognitive needs, competence, autonomy and relatedness, are universally applicable (Abeysekera & Dawson 2015), and it is suggested that the flipped mode learning environment are likely to satisfy these three student needs and consequently nurture “greater levels of intrinsic motivation”. Further, the flipped classroom provides learning environments that are likely to satisfy “students’ need for autonomy and, thus, entice greater levels of extrinsic motivation” (Abeysekera & Dawson,2015). The facility to proceed at a pace determined by the student reduces cognitive load and enhances learning (Ginns 2005).
The Behaviourist perspective states that abundant repetition is required to reinforce skills and methods. In a flipped model, learning outcomes are clearly stated and sufficient rewards are available in the form of online quizzes and weekly tutorial assessments (Bishop & Verleger 2013), thus providing ample opportunity for repetition and reinforcement.
Social and situated learning theories consider social interaction and collaboration essential for learning. In a flipped classrooms, communities of practice are developed through social activities such as peer learning, where debate and discussion are encouraged (Lave 1988).
Humanist and self-theories (Maslow 1943; Rogers 1946) These learning paradigms advocate empowering learners to have control over their learning. In this model, the teacher relinquishes authority to students and assumes the role of a facilitator. This is central to flipped classroom, and individual learning styles and goals are encouraged and accommodated.
Problem-based learning is a student-centred approach that facilitates learning through solving open-ended problems (Savery & Duffy 1995). Students work in groups using existing knowledge and identifying gaps in knowledge as they attempt the problem. The flipped classroom aligns with the problem-based learning paradigm, as the class sessions can pose problems that need existing knowledge as well develop further ideas and concepts. It allows scaffolding of ideas, with the pre-class work providing the core information and the pre-class sessions extending these concepts and providing more complex applications.
Experiential learning relies on learning through experience. This is inherent in flipped mode teaching as students are not just passive bystanders but active participants in their learning.
Meyer and Land (2005) introduced the concept of liminal space, a state learners pass through in the process of learning a new or threshold concept. The flipped classroom accelerates learners more quickly into the liminal space. They are thus able to spend more time if needed in the liminal space and, more importantly, the instructor is available to them during this critical phase in their learning. According to Bloom’s taxonomy, in flipped classrooms students are engaged in the lowest cognitive level activities (such as exposition to material) outside class time, and the higher cognitive level activities (application, analysis, synthesis and evaluation) during class when instructors are available to assist (Brame 2013). This reverses the traditional approach.
Methodology
Background
The current study reports on a flipped approach in a first-year business statistics unit that is compulsory for all business majors at The University of Western Australia. It is a typical first-level statistics unit, covering exploratory data analysis, probability and random variables, sampling, one sample tests for means and proportions, two-sample test for means, ANOVA, simple and multiple linear regression and chi-square tests for contingency tables. As such, the unit covers basic univariate statistical methods and techniques. The assessments consist of two short tests worth 5% each, a mid-semester examination worth 15%, tutorial and lab-based assessments worth 17%, a weekly online quiz worth 13% and a final examination worth 45%.
The study occurred over two years, 2014 and 2015. During both semesters of 2014 (class size 460 in semester 1 and 615 in semester 2), teaching was based on three one-hour traditional lectures and a combined two-hour tutorial-laboratory session in which students attempted written questions as well as exercises based on data analysis. In addition, a one-hour problem solving session per week covered examination-type questions for further practice. A unit reader available to students contained skeleton lecture notes and tutorial-laboratory material. Lectures were based around the skeleton lecture notes in the unit reader.
The flipped classroom was introduced in semester 1 of 2015 (483 students) and continued in the following semester (483 students). The advantages of a flipped classroom discussed earlier were the motivation for its introduction, including: students can proceed at their own pace; recorded lectures could be replayed and revisited; increased student engagement; admitting all learning styles and choices; and exposition of material occurs outside the classroom with the class time available to immediately reinforce the content. In addition, it allows: students to have a deepened understanding of content; focus on the more difficult aspects through increased interaction between the instructor and students; highly interactive class sessions; use of peer learning; incorporation of problem-based learning; and time to discuss and develop real-life situations. In the traditional delivery, lecture attendance dropped from close to 100% in week one to around 70% in week four, and around 40% by the end of the semester. It was expected that the flipped classroom would increase lecture attendance.
Except for minor revisions the unit reader, lecture material, tutorial-lab and problem solving session material were kept the same over the two years. The lecturer was also the same over the two years. The material covered during the face-to-face lecture sessions was different over the two years, necessitated by the different delivery formats. In the flipped classroom, the lectures were pre-recorded using the skeleton lecture notes in the unit reader and made available online. The in-class lecture session would begin with a review of learning outcomes for the topic followed by a set of graded questions, from the straightforward to the more involved. Towards the end of the lecture, one or two challenge questions were set for the class under both the traditional and flipped approaches. The class worked in groups, and good use was made of peer learning as described earlier. Peer learning is one of the many active learning strategies available to lecturers that encompasses a student centred approach, transcends knowledge acquisition and helps nurture graduate attributes of collaboration, communication skills, problem solving and teamwork. Landis (2000) asserts that research shows students who engage in collaborative learning and group study perform better academically, persist longer, feel better about the educational experience and have enhanced self-esteem.
Peer learning increased the number of instructors in the session. To increase the number of experts, a new initiative was introduced: tutors were present in the lectures and problem solving sessions. This allowed students immediate access to an expert to discuss or clarify any issues, check answers and monitor progress. A staff to student ratio of one tutor per 30 students was maintained. Some level of peer learning and tutor-support had been used in the traditional mode as well, but the opportunities for these were limited by available class time.
Time was also devoted to discussing real life situations and case studies. This deepened
understanding by providing appropriate context and highlighting the nuances of real data analysis. This aspect was also present in the traditional classroom, but was limited by available time.
Student performance and engagement
Student performance was analysed to investigate any differences between the traditional and flipped classrooms. Performance was measured by the final examination mark as this is the largest single assessment, and also by the overall mark. The performance was adjusted for demographic data obtained from student records.
The variables in the dataset are given in Table 1. Demographic variables include Sex, Citizenship, and Age which has been categorised as 15—16,17, 18, 19, 20, 21, 22, 23, 24, 25, 26, 27—30 and > 30. The student cohort in each semester may differ, so it is expected that the performance of the classes in the two semesters may be different. The high school mathematics unit taken by students is expected to affect performance. As a consequence of a change in the high school mathematics curriculum in 2010, a total of nine entry-level mathematics units were possible, comprising of three from the old curriculum and six from the new. These have been coded as an ordered list L1 to L9, with L1 being the lowest mathematics level and L9 the highest.
Student engagement is difficult to measure, and no standard exists for this construct. Nonetheless, lack of engagement is linked to low achievement, boredom and dropout (Fredricks, Blumenfeld & Paris 2004). Fredricks & McColskey (2012) provide a good survey of measuring student
engagement, and in particular the dimensions (for example behaviour, emotion and cognitive) that comprise engagement. Engagement has been measured in several ways, including student self-reporting, teacher ratings and interviews. In this study, engagement was assessed by reports from tutors based on tutorial-laboratory classes, and by the lecturer and tutors based on observations in the lecture.
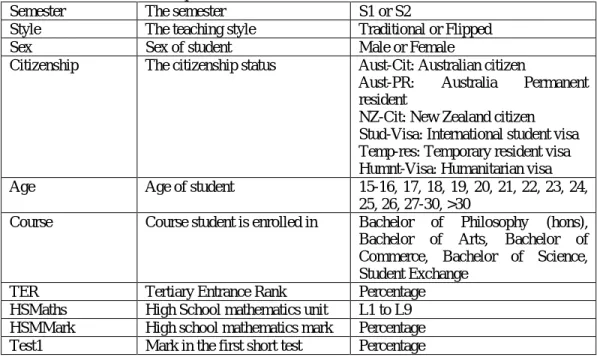
Table 1 Description of variables in the dataset
Variable Description Values
Semester The semester S1 or S2
Style The teaching style Traditional or Flipped Sex Sex of student Male or Female
Citizenship The citizenship status Aust-Cit: Australian citizen
Aust-PR: Australia Permanent resident
NZ-Cit: New Zealand citizen Stud-Visa: International student visa Temp-res: Temporary resident visa Humnt-Visa: Humanitarian visa Age Age of student 15-16, 17, 18, 19, 20, 21, 22, 23, 24,
25, 26, 27-30, >30
Course Course student is enrolled in Bachelor of Philosophy (hons), Bachelor of Arts, Bachelor of Commerce, Bachelor of Science, Student Exchange
TER Tertiary Entrance Rank Percentage HSMaths High School mathematics unit L1 to L9 HSMMark High school mathematics mark Percentage Test1 Mark in the first short test Percentage
MidSem Mark in the mid semester exam Percentage Test2 Mark in the second short test Percentage Exam Final examination mark Percentage Overall Overall mark in the unit Percentage
Student preference
The second aspect of the study is determining whether students prefer flipped classroom or traditional lectures. An online survey of the classes was conducted following each of the two semesters of flipped classroom. The variables collected are listed in Table 2. The survey data was merged with the student performance and demographic data from Table 1. A logistic regression model was fitted with Preference as response to determine any association between preference for flipped or traditional classroom and student demographics and performance. Qualitative analysis of responses was also conducted.
Table 2 Variables obtained from student survey.
Variable Description Values
Prefer Flipped Binary variable indicating whether the student prefers flipped classroom
Y or N
Level of study Highest level of study First year, Second year, Third year Lecture Attended Number of lectures attended 0, 1, 2, …, 13
Student understanding
The final aspect of the study was to investigate if the flipped classroom improved student understanding of content. This aspect was judged by answers to in-class questions and perusing a random sample of examination scripts to assess the quality of the solutions submitted by students.
Results
All data exploration and statistical analyses were performed using the R statistical environment (R Core Team, 2017).
Data exploration
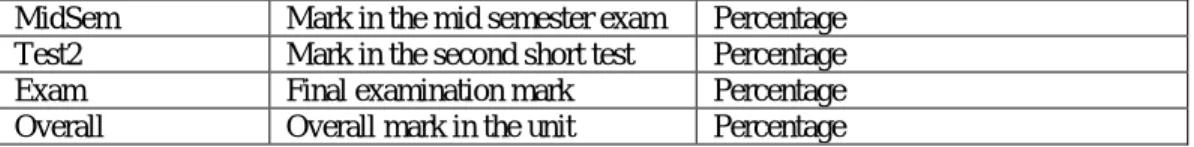
Table 3 contains a summary of the examination marks and overall marks (%) by teaching style and semester and Figure 1 shows boxplots. For both the examination mark and overall mark, the mean and median are highest for semester 2 in 2015 flipped classroom. In corresponding semesters the flipped classroom shows a better performance in both the examination and overall marks. Further, the marks for the flipped classroom are more heavily negatively skewed (longer lower tail), indicating a larger proportion of higher marks.
Statistical modelling
Student performance
Our interest is in difference in student performance between flipped and traditional classrooms. However, student demographics and ability also affect performance, so we need to adjust for these differences. That is, the statistical model should include demographic variables and measures of ability as well as teaching mode. The effect of flipped classroom is established if teaching style is significant a variable in such a model.
Table 3 Mean exam mark and mean overall mark (second entry) by teaching style and semester. The maximum for each summary is highlighted in bold.
Traditional (2014) Flipped (2015) S1 S2 S1 S2 No. of Students 460 615 483 483 Minimum 0 0 0 0 0 0 0 5 LQ 51.8 54.0 66.0 56.0 63.8 60.0 70.1 71.4 Median 67.0 65.0 77.0 62.0 76.2 68.0 81.1 81.1 Mean 62.5 63.6 71.0 63.1 69.2 64.4 75.5 76.6 UQ 78.0 77.0 85.0 75.0 84.2 77.0 86.9 86.0 Maximum 94 94 100 96 100 97 100 98 Stdev 21.4 18.2 21.4 17.7 23.7 18.7 18.6 15.7
In addition, tutorial assessments and tutorial participation marks are included in the model for examination marks to adjust for differences in student effort and engagement. However, the model for examination marks did not include the two short tests and mid semester exam as these were summative assessments. None of the assessment marks were included in the model for overall marks, as clearly the overall mark is comprised of all the assessments.
An important issue in the data is that a total of 548 mostly international students did not have a TER or other high school marks. As a result, models containing these variables would not include such students. Consequently, two linear models (Fox 1997) were fitted to each of examination marks and overall marks, the first including TER and high school marks, and the second without them. Summaries of the the models are presented in Table 4 (examination marks) and Table 5 (overall mark), and the main findings are detailed below.
Exam marks
In the model including TER and HSMMarks, 548 students who did not have at least one of these, mostly international students, were omitted. We first consider the effect of demographic variables, ability and effort. International students (StudVisa) had a higher average examination mark of 7.86% compared with domestic and exchange students. Males performed worse by 2% on average. Ability, measured by TER and high school mathematics mark (HSMMark) were also positively correlated with exam mark. On average, a 10% higher TER resulted in 5.6% increase in examination mark, while a 10% higher HSMMark resulted in a 1.4% higher examination mark. Semester 2 students performed better on average by 5.7%. Students who performed better in later tutorial assessments on material present in the examination (Tut6, Tut9—Tut12) and were more engaged in tutorials (Tutpart) performed better. Tut6 was on the basics of hypothesis testing, which forms the foundation of latter material.
Figure 1 Boxplots of (a) exam mark and (b) overall mark against delivery style and semester.
(a) Exam mark
Table 4 Results of the linear model fitted to examination marks with TER and without TER.
With TER Without TER
Variable Coefficient p-value Coefficient p-value
StudVisa 7.86 0.006 – –
Male -2.08 0.016 -2.38 0.002
TER 0.56 9.73e-13 – –
HSMMark 0.14 0.008 – –
TutPart 0.23 <2e-16 0.27 <2e-16
Tut6 (chi square test) 0.05 0.0007 0.04 0.001 Tut9 (1-sample t-test) 0.04 0.016 0.05 0.0002 Tut10 (2-sample t-test) 0.04 0.018 0.03 0.017 Tut11 (ANOVA) 0.07 4.03e-07 0.06 1.30e-06 Tut12 (Regression) 0.07 3.82e-06 0.05 2.08e-06
Semster2 5.71 2.13e-11 5.06 2.00e-11
StyleFlipped 11.6 <2e-16 10.5 <2e-16
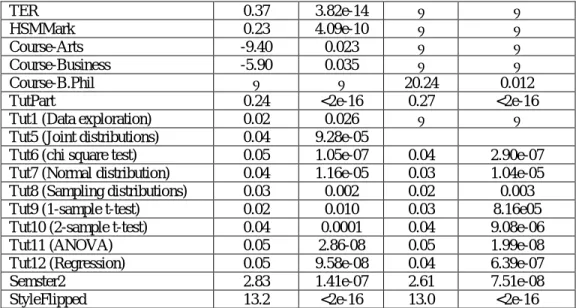
Table 5 Results of the linear model fitted to overall marks with TER and without TER.
With TER Without TER
Variable Coefficient p-value Coefficie nt
p-value
Aust-PR 2.78 0.022 - -
StudVisa 5.33 0.003 1.89 0.002
TER 0.37 3.82e-14 – –
HSMMark 0.23 4.09e-10 – –
Course-Arts -9.40 0.023 – –
Course-Business -5.90 0.035 – –
Course-B.Phil – – 20.24 0.012
TutPart 0.24 <2e-16 0.27 <2e-16 Tut1 (Data exploration) 0.02 0.026 – – Tut5 (Joint distributions) 0.04 9.28e-05
Tut6 (chi square test) 0.05 1.05e-07 0.04 2.90e-07 Tut7 (Normal distribution) 0.04 1.16e-05 0.03 1.04e-05 Tut8 (Sampling distributions) 0.03 0.002 0.02 0.003 Tut9 (1-sample t-test) 0.02 0.010 0.03 8.16e05 Tut10 (2-sample t-test) 0.04 0.0001 0.04 9.08e-06 Tut11 (ANOVA) 0.05 2.86-08 0.05 1.99e-08 Tut12 (Regression) 0.05 9.58e-08 0.04 6.39e-07
Semster2 2.83 1.41e-07 2.61 7.51e-08
StyleFlipped 13.2 <2e-16 13.0 <2e-16
Figure 2 Mean mark (95% confidence interval) by teaching style, adjusted for the effect of other variables.
Finally, the flipped classroom corresponded to a 11.6% higher mean examination mark on average compared with the traditional classroom. Figure 2(a) illustrates this difference in average student performance, plotting the mean exam mark under the model, adjusted for the other variables. The data indicates that after adjusting for demographic and other differences, under the flipped classroom teaching a substantial improvement in student exam performance is observed. That is, a student with a given background and ability will have an exam mark which is 11.6% higher on average under the flipped classroom.
We now consider the model without these TER and/or HSMMark (Table 4). International students no longer perform better than others. The effect of the other variables is similar to that in the previous model. Again, under the flipped classroom the examination marks are higher by 10.5% on average.
Overall mark
In the model including TER and HSMMarks (Table 5), Australian permanent residents (Aust-PR) and international students (StudVisa) performed better compared with other students, by 2.78% and 5.33% on average, respectively. A 10% higher TER resulted in a 3.7% higher average overall mark. Similarly, a 10% higher high school mathematics mark resulted in a 2.3% higher overall mark on average. Tutorial containing material in the final examination or more difficult concepts were positively correlated with the overall mark. For example, Tutorial 5 covered joint discrete distributions and covariance rules, material that is inherently difficult. NoteTutorial 1 covered data exploration, which was used in all topics. Arts and business students performed worse by 9.4% and 5.9% on average than B.Phil (Bachelor of Philosophy) and other students. This is expected as the B.Phil is a special programme for high achieving students. Further, Science students are a small but high achieving cohort in this unit, and exchange students are also high achieving students. Again semester 2 students performed better than semester 1 students. Finally, the flipped classroom resulted in a higher average overall mark of 13.2%. That is, a student with a given ability and demographics will have an overall mark which is 13.2% higher on average under the flipped classroom.
The model without TER and HSMMark shows that International students have a higher average overall mark (1.89%) and on average males perform worse than females (by 1.09%). The B.Phil students perfom much better than those in other programmes (by 20.24% on average). More engaged students (Tut marks and TutPart mark) performed better on average, and semester 2 students had a 2.61% higher average overall mark. Finally, under the flipped classroom, the overall marks were higher by 13%. That is, a student with a given profile will have a higher overall mark by 13% on average under the flipped classroom.
Student preference
For the cohort in 2015, a total of 158 students in semester 1 and 120 in semester 2 responded to the survey. Of these, a total of 165 (59%) preferred the flipped classroom. The aim of the analysis here was to determine the relationship between preference for the flipped style and student demography, performance and number of lectures attended. A logistic regression model (Dobson & Barnett 2008) indicated that the performance indicators (TER, HSMMark, semester assessments including exam mark and overall mark) had no significant effect on preference. Age was the only variable affecting preference. Compared with other age groups, students aged
• 18 were 2.8 times,
• 19 were 3.6 times, and
• 20 were 3.7 times
more likely to prefer flipped classroom. We note that the students had experienced traditional lectures in almost all other courses. Consequently they were able to compare the flipped mode with traditional, albeit not for the same course.
A hypothesis test of binomial proportion showed that the proportion of students preferred the flipped classroom was significantly greater than 0.5 (p-value = 0.001), with a 95% confidence interval of (0.53, 0.65).
Finally, in the survey many students commented positively on the flipped approach, while only two negative responsed were received.
Student engagement
Several tutors were common between the traditional and flipped approaches, so they were in a good position to rate and assess classroom engagement. Two aspects were noted in particular. Firstly, tutors reported increased participation and enthusiasm in the tutorial-laboratory class compared with previous year under the traditional classroom. Secondly, the lecturer noted that several students stayed back in class after the lecture session, still attempting the challenge questions. Both these aspects were observed throughout the semesters with flipped classroom.
Level of Student understanding
The level and depth of student understanding was assessed by the responses to in-class questions and perusing examination scripts. An example question from the chapter on random variable is shown in Figure 3. This question requires students to first find the distribution of the number of properties sold as a truncated Poisson distribution. In the second part ideas of conditional
probability course. Nonetheless, several students presented good solutions showing an understanding of the concepts involved, and also explained their solutions to their groups. In the traditional mode, this question required substantial scaffolding before students could attempt it.
Similarly, parts of several examination questions were more searching. A random sample of 100 scripts from each semester for the flipped classroom showed high quality answers to these questions, and only a few students had not attempted them. A similar investigation of the exams under the traditional mode revealed that fewer students had given correct answers to such questions, and several had not even attempted them.
Figure 3 An example of an in-class question
Student survey responses
A selection of student comments from the surveys is given in Table 6. A range of comments on the flipped classroom were obtained, mostly positive. It was clear from the comments that the flipped classroom had not been experienced previously by the class, although some of them were in the final year of their courses.
Table 6 Student comments from surveys.
1. Great idea of having tutors in every class, i.e. lectures and problem solving sessions. 2. The pre-recorded lectures were useful as I was able to use them to help learn the material. 3. One of the best run and taught units I have undertaken at university.
4. Unit required quite a lot of independent work.
5. This may be the best unit I have attended after three years at uni. 6. Stick to traditional lectures—no pre-recorded lectures.
7. This unit has made me consider taking another Statistics unit in the future.
8. I think ultimately the flipped classroom is a better model. People just need to get used to the model.
Discussion and Conclusions
Mathematics and statistics are technical disciplines with subtle ideas that need to be clearly explained and developed. The perception is perhaps that students will not be able to cope with the technical difficulties without direct instruction via the traditional lecturing format, and this may be the reason that the flipped classroom approach is not popular in mathematics and statistics. The
A property developer has three properties for sale at a site. The demand for properties has a Poisson distribution with mean 5. Let the random variable 𝑋 denote the number of properties that are sold.
1. What is the mean number of properties that are sold at this site?
2. The developer has put in tenders for twenty such sites, each with three properties. The probability that she gets a site is 0.3. The profit from the sale of each property is $150,000. What is the expected profit for the developer from this venture?
experience presented in this study shows that this is not the case. Students performed better, and attained a deeper understanding in flipped classroom compared with traditional lectures as observed in perusing examination scripts.
Surprisingly attendance in the face-to-face session did not increase much under the flipped classroom. Interestingly also, high school mathermatics unit did not affect performance. This is in contrast to the findings by Khan (2015) for the same unit, who noted that students who took the two highest mathematics units performed significantly better. However, that study was based on pre-2014 data which may have had a different student profile.
Student surveys revealed that preference for the flipped classroom was higher for those aged 18— 19. Additionally, females were twice as likely to prefer the flipped classroom compared with males. The reasons for these observations is unclear. It may be related to the online habits of these groups.
The flipped classroom does have disadvantages. Initially, it takes expertise and more effort to prepare course material (November & Mull 2012). Academic workload is a common issue when implementing new technologies in higher education (Jefferies et al. 2004; Laurillard 2007; O’Connor, Mortimer & Bond 2011). Running a flipped session takes skill and effort, and the instructor needs to be aware of the progress of the whole class so as to suitably direct the session. In addition, in a traditional lecture the instructor is able to react to student reception of material through body language and facial expressions. The time spent on concepts can thus be adjusted. This is not possible in a recorded lecture.
One of the weaknesses of the study is that the flipped and traditional classrooms were conducted for different cohorts. It would be preferable to a single cohort, allocated at random to one of flipped or traditional classroom. However, we anticipate issues with ethics approval for such an approach.
This study shows that a flipped classroom can lead to improved student learning and performance. We believe that the hesitation by mathematics and statistics teachers in higher education to embrace the flipped classroom is grounded in: an unwillingness to change; unclear ideas on how to flip; challenges presented by technology; or unwillingness to invest in time required initially for preparation. While more effort is required initially to prepare materials, a permanent reduction in workload is obtained. In our case three one-hour lectures were replaced by a two-hour session.
Finally, the most valuable aspect of the flipped class for the instructor is that it is far more interactive, enjoyable and rewarding than traditional lecturing and passive learning.
Ethics Approval
The appropriate ethics approval for this study was obtained from the University of Western Australia (RA/4/1/7641).
References
Abeysekera, L & Dawson, P 2015, ‘Motivation and cognitive load in the flipped classroom: definition, rationale and a call for research’, Higher Education Research & Development,
Andrews, T, Leonard, M, Colgrove, C & Kalinowski, S 2011, ‘Active learning not associated with student learning in a random sample of college biology courses’, Life Sciences Education, vol.10, no.4 , pp. 394-405.
Berrett, D 2012, ‘How ‘Flipping’ the Classroom Can Improve the Traditional Lecture’, The Chronicle of Higher Education, vol. 31, pp. A16-A18.
Biggs, J 1999, ‘What the student does: teaching for enhanced learning’, Higher Education Research and Development, vol. 18, no. 10, pp. 57-75.
Bishop, J & Verleger, M 2013, The Flipped Classroom: A Survey of the Research, Paper presented at ASEE Annual Conference, Atlanta, Georgia, June 23-26. Viewed at https://peer.asee.org/22585.
Bligh, D 2000, What’s the use of lectures? Jossey-Bass, San Francisco.
Brame, C 2013, Flipping the classroom. Vanderbilt University Center for Teaching. Viewed 9 June 2017 at http://cft.vanderbilt.edu/guides-sub-pages/flipping-the-classroom/.
Clark, R, Nguyen, F & Sweller, J 2005. Efficiency in learning: Evidence-based guidelines to manage cognitive load. Pfeiffer, San Francisco.
Crouch, C & Mazur, E 2001, ‘Peer Instruction: Ten Years of Experience and Results’, American
Journal of Physics, vol.69, pp. 970-977
Deci, E & Ryan, R 1985, Intrinsic motivation and self-determination in human behaviour, Plenum, New York.
Deslauriers, L, Schelew, E & Wieman, C 2011, ‘Improved learning in a large-enrollment physics class’, Science, vol.332, pp. 862-864.
Dobson, A & Barnett, A 2008, An introduction to generalised linear models (3rd ed.). Chapman & Hall, Boca Raton, FL.
Donleavy, G 2012, ‘Proclaimed graduate attributes of Australian universities: patterns, problems and prospects’, Quality Assurance in Education, vol. 20, no. 4, pp. 341-356.
Findlay-Thomas, S & Mombourquette, P 2014, ‘Evaluation of a flipped classroom in an undergraduate business course’, Business Education & Accreditation, vol. 6, no. 1, pp. 63-71.
Fox, J 1997, Applied regression analysis, linear models, and related methods. Sage, Thousand Oaks, CA.
Fredricks, A & McColskey, W 2012, ‘The measurement of student engagement: A comparative analysis of various methods and student self-report instruments’, in Christenson, S I (ed.),
Handbook of research on student engagement, Springer, US, pp. 763-782. doi: 10.1007/978-1-4614-2018-7_37.
Fredricks, J, Blumenfeld, P & Paris, A 2004, ‘School engagement: Potential of the concept: State of the evidence’, Review of Educational Research, vol. 74, pp. 59-119. doi: 10.3102/00346543074001059.
Ginns, P 2005, ‘Meta-analysis of the modality effect’, Learning and Instruction, vol. 15, no. 4, pp. 313-331.
Hamdan, N, McKnight, P McKnight, K & Arfstrom, K 2013, ‘A review of flipped learning’. Viewed 13 September 2016 at http://www.flippedlearning.org/review.
Herreid, C F & Schiller, N 2013, ‘Case studies and the flipped classroom’, Journal of College Science Teaching, vol. 42, no. 5, pp. 62-66.
Jefferies, A, Thornton, M, Alltree, J & Jones, I 2004, ‘Introducing web-based learning: An investigation into its impact on university lectures and their pedagogy’, Journal of Information Technology Impact, vol. 4, no. 2, pp. 91-98.
Johnson, G 2013, ‘Flipped classrooms not beneficial to all’, University Wire, 1(1) (November). Jungic, V, Kaur, H, Mulholland, J & Xin, C 2015, ‘On flipping the classroom in large first year
calculus’, International Journal of Mathematical Education in Science and Technology, vol. 46, pp. 508-520.
Karnad, A 2013, Student use of recorded lectures: a report reviewing recent research into the use of lecture capture technology in higher education, and its impact on teaching methods and attendance. London School of Economics and Political Science, London. Viewed September 2016 at
http://eprints.lse.ac.uk/50929/1/Karnad_Student_use_recorded_2013_author.pdf.
Khan, R 2015, ‘Assessments: an open and closed case’, International Journal of Mathematical Education in Science and Technology, vol.46, pp. 1061-1074.
Kim, M, Kim, S, Khera, O & Getman, J 2014, ‘The experience of three flipped classrooms in an urban university: an exploration of design principles’, Internet and Higher Education, 22, pp. 37-50.
Lage, M, Platt, G & Treglia, M 2000, ‘Inverting the classroom: A gateway to creating an inclusive learning environment’, The Journal of Economic Education, vol. 31, no. 1, pp. 30-43. Landis, R 2000, Academic Success Strategies. In Studying Engineering: A Road Map to a Rewarding
Career (2nd ed.). Discovery Press, Los Angeles.
Laurillard, D 2007, ‘Modelling benefits-oriented costs for technology enhanced learning’, Higher Education, vol. 54, no.1, pp. 21-39. https://doi.org/10.1007/s10734-006-9044-2.
Lave, J 1988, Cognition in Practice: Mind, mathematics, and culture in everyday life. Cambridge University Press, Cambridge, UK.
Llobregat-Gómez, N, Moraño, J, Roselló, M & Sánchez Ruiz, L 2015, ‘Blended learning at maths with aerospace engineering freshmen’, Frontiers in Education Conference, IEEE, vol. 1-4. doi: 10.1109/FIE.2015.7344370.
Love, B, Hodge, A, Grandgenett, N & Swift, A 2013, ‘Student learning and perceptions in a flipped linear algebra course’, International Journal of Mathematics Education in Science and Technology, vol. 45, pp. 317-324. doi: 10.1080/0020739X.2013.822582.
Maslow, A 1943, ‘A Theory of Human Motivation’, Psychological Review, vol. 50, pp. 370-96. Mazur, E 1997, Peer Instruction: A User’s Manual, Prentice Hall, Upper Saddle River, NJ. Meyer, J & Land, R 2005, ‘Threshold concepts and troublesome knowledge (2): epistemological
considerations and a conceptual framework for teaching and learning’, Higher Education, vol. 49, pp. 373-388. doi: 10.1007/s10734-004-6779-5.
Missildine, K, Fountain, R, Summers, L & Gosselin, K 2013, ‘Flipping the classroom to improve student performance and satisfaction’, Journal of Nursing Education, vol. 52, no. 10, pp. 597-599.
Moffett, J 2015, ‘Twelve tips for “flipping” the classroom’, Medical Teacher, vol. 37, no.4, pp. 331
-336.
Nicol, D & Macfarlane-Dick, D 2006, ‘Formative assessment and self-regulated learning: a model and seven principles of good feedback’, Studies in Higher Education, vol. 31, no. 2,pp. 199
-218.
November, A & Mull, B 2012, Flipped learning: A response to five common criticisms. Viewed 10 August 2017 at http://novemberlearning.com/resources/archives-of-articles/flipped-learning-a-response-to-five-common-criticisms/.
O’Connor, C, Mortimer, D & Bond, S 2011, ‘Blended learning: Issues, benefits and challenges’,
International Journal of Employment Studies, vol. 19, no. 92, pp. 63-83.
R Core Team 2017, R: A Language and Environment for Statistical Computing. R Foundation for Statistical Computing, Vienna, Austria. Viewed at http://www.R-project.org.
Richardson, M, Abraham, C & Bond, R 2012, ‘Psychological correlates of university students' academic performance: A systematic review and meta-analysis’, Psychological Bulletin, vol. 138, no. 2, pp. 353-387.
doi:http://dx.doi.org.ez.statsbiblioteket.dk:2048/10.1037/a0026838.
Savery, J & Duffy, T 1995, ‘Problem based learning: An instructional model and its constructivist framework’, Educational Technology, vol. 35, no. 5, pp. 31-37.
Stewart, M 2012, Understanding learning: theories and critique. In Hunt, L & Charmers, D (eds.),
University teaching in focus: a learning centred approach. ACER Press, Camberwell, VIC, pp. 3-20.
Strayer, J 2012, ‘How learning in an inverted classroom influences corporation, innovation and task orientation’, Learning Environments, vol. 15, no. 2, pp. 171-193.
Sweller, J 1988, ‘Cognitive load during problem solving: Effects on learning’, Cognitive Science, vol. 12, pp. 257-285.
Talbot, R 2014, ‘Creating learning objectives, flipped classroom style’, The Chronicle. Viewed 17 June 2017 at http://www.chronicle.com/blognetwork/castingoutnines/2014/03/05/creating-learning-objectives-flipped-classroom-style/?cid=at&utm_source=at&utm_medium=en. ( Taylor, A 2015, ‘Flipping great of flipping useless? A review of the flipped classroom experiment
at Coventry University London campus’, Journal of Pedagogical Development, vol. 5,pp. 57-65.
Traphagan, T, Kucsera, J & Kishi, K 2010, ‘Impact of class lecture webcasting on attendance and learning’, Educational Technology Research & Development, vol. 58, no. 1, pp. 19-37. Wiginton, B 2013, Flipped instruction: an investigation into the effect of learning environment on
student self-efficacy, learning style, and academic achievement in an algebra I classroom. PhD dissertation, The University of Alabama. Viewed 19 May 2016 at