DISCUSSION PAPERS
IN
ECONOMICS
No. 2013/5 ISSN 1478-9396
DID THE FINANCIAL CRISIS IMPACT ON THE
CAPITAL STRUCTURE OF FIRMS?
BARRY HARRISON
THEODORUS WISNU WIDJAJA
DISCUSSION PAPERS IN ECONOMICS
The economic research undertaken at Nottingham Trent University covers various fields of economics. But, a large part of it was grouped into two categories, Applied Economics and Policy and Political Economy.
This paper is part of the new series, Discussion Papers in Economics. Earlier papers in all series can be found at:
http://www.ntu.ac.uk/research/research_at_ntu/academic_schools/nbs/wor king_papers.html
Enquiries concerning this or any of our other Discussion Papers should be addressed to the Editors:
Dr. Marie Stack, Email: [email protected]
Dr. Dan Wheatley, Email: [email protected] Division of Economics
Nottingham Trent University
Burton Street, Nottingham, NG1 4BU UNITED KINGDOM.
Abstract
The financial crisis of 2008 provides an interesting opportunity to investigate the effect of the crisis on the capital structure decisions of firms. Over the years, capital structure choice has attracted considerable attention in the literature and to firms, investors and policy makers. We find that during 2008 financial crisis, the coefficients of tangibility and Market to Book (MTB) ratio exert a stronger influence on capital structure choices than prior to 2008. We also find that the coefficient of profitability exerts less influence on capital structure choice than before the crisis. In addition, the sign of the coefficient of firm size is negative, which is exactly the opposite of the situation that existed before the crisis. Further analysis indicates that during the 2008 financial crisis, pecking order theory has more explanatory power than trade-off and market timing theory.
1
1.
Introduction
In pursuit of maximizing firm value, financial managers are charged with two main responsibilities: investment decisions and capital structure choices (Watson and Head, 2010).Capital structure of a company is particularly important because it impacts on the ability of the firm to take up investment opportunities. For example, debt gives firms more financial agility in taking up investment opportunities because, in general, debt can be raised more quickly than either equity finance or the accumulation of earnings. Debt might also enable firms to increase their after tax earnings by exploiting available tax shields.
Myers (2001) has argued that there is no universal theory of the debt/equity choice and no reason to expect one. Despite this, scholars formulate the determinants of capital structure in the framework of trade-off theory, pecking order theory, or market timing theory. However, earlier tests of these theories produced ambiguous results. For example, the trade-off theory argues that the correlation between profitability and leverage ratio is positive: the higher the profit, the higher the leverage ratio. On the other hand, Rajan and Zingales (1995) find a negative correlation between profitability and leverage ratio: the higher the profitability, the lower the leverage ratio. Sinan (2010) finds that the market to book ratio is negatively correlated with leverage ratio, while Lemmon and Zender (2010) find a positive correlation between market to book ratio and leverage ratio. These opposing results suggest that capital structure theories might not be consistent as financial and/or economic conditions change. The recent financial crisis provides an opportunity to investigate the effect of a financial shock on capital structure. Bhamra, Kuehn, and Strebulaev (2011) find that firms are more conservative in their financial policy knowing that there is a possibility of rare economic crises. Ariff, Taufiq, and Shamsher (2008) find that the speed of capital structure adjustment is significantly slower for financially distressed firms. A survey of the real effect of financial constraints during financial crises reveals that constrained firms would use internal funding and put more effort in obtaining credit from the banks anticipating restricted access to credit in the future (Campello, Graham, and Harvey, 2010). However, as mentioned earlier, there is still no well-developed dynamic capital structure model which could comprehensively capture the capital structure choice. The purpose of this paper is to investigate whether the recent financial crisis has had any impact on the financial structure of firms. Table 1 shows the total value of securities (bonds and stock) issued by firms in the United States between
2
2004 and 2011. It is immediately apparent that between 2004-2007, the total value of securities issued by US corporations increased every year from USD 2,070,680 million in 2004 to USD 2,679,412 million in 2007. However, after the onset of the financial crisis in 2008, the total value of securities issued by US corporations plunged from USD 2,389,101 million in 2008 to USD 1,143,076 million in 2011 – a drop of over fifty per ent! The abrupt drop in securities issued is largely explained by a substantial decrease in bond issuance which declined from USD 2,500,770 million in 2007 to USD 2,220,530 million in 2008, then suddenly plummeted to USD 970,694 million in 2009. Meanwhile, stock issuance fluctuated between USD 168,571 million in 2008 and USD 233,967 million in 2011. These numbers suggest that the financial crisis might have led to a change in firms‟ preference for raising external capital through leverage.
Table 1 Securities issuance of US firms
Year Bonds ($m) Stocks ($m) Total ($m) 2004 1,923,094 147,585 2,070,679 2005 2,323,735 115,255 2,438,990 2006 2,590,863 119,165 2,710,028 2007 2,500,770 118,642 2,619,412 2008 2,220,530 168,571 2,389,101 2009 970,694 233,967 1,204,661 2010 893,717 131,135 1,024,852 2011 909,109 233,967 1,143,076 Source: www.federalreserve.gov
2.
Literature Review
2.1. Previous Studies on the Capital Structure Theories
Capital structure theory stems from Modigliani and Miller (1958) who argue that firm value is uninfluenced by capital structure choices and that capital structure is irrelevant to both firm value and the cost of capital as long as firms focus on value maximization. Given certain assumptions1, Modigliani and Miller (1958) argue that any attempt to reduce the proportion of equity in the firm‟s overall capital structure by substituting debt for equity would
1 Mainly perfect and frictionless capital markets, no transactions costs and tax deductable interest payments
3
equivalently raise the price of equity thus preserving the overall cost of capital constant and vice versa. However, it is now generally recognised that the assumptions made by MM are too restrictive and other theories have emerged in the capital structure debate.
Pecking order theory, trade off theory and market timing theory have thrown up several variables as possible determinants of capital structure including tangibility, profitability, size, market to book ratio, and liquidity. Marsh (1982) finds that tangible assets and leverage are positively correlated. Shah and Khan (2007) find that a company which has a relatively large proportion of fixed assets usually pays lower rates of interest on its borrowing costs. Pecking order theory emphasises the importance of profitability in financing decisions because, of all sources of finance, internal finance has least asymmetric information associated with it. Myers and Majluf (1984) and Titman and Wessels (1988) find that profitable companies tend to finance investments from internal sources and therefore such companies tend to be associated with lower levels of leverage.
Using an international sample of the G7 countries, Rajan and Zingales (1995) focus on four determinants of capital structure: tangible assets, market to book ratio, size, and profitability. They find that in most countries, size and tangible assets are positively correlated with the level of debt providing support for the trade-off theory of capital structure. However, they also find that market to book ratio and profitability are negatively correlated with the level of debt which provides support for the pecking order theory. This ambiguity is explained by Myers (2001) who suggests that any capital structure theory might work better in some circumstances than others!since the theories could not be applied generally to various sets of capital structure determinants used in the studies.
Focussing on US companies in the period 1973-1994, Graham (2000) finds that the benefit of capitalized interest tax shields is about 10 percent of firm value, but that the level of debt could be increased up to the point where, although incremental benefit decreases, the overall benefit of the tax shield could be increased up to 15 percent of firm value. The existence of unused tax shields, and therefore by implication conservatism towards increasing debt levels, reflects only weak support for trade-off theory since this theory suggests firms should exploit the tax shield benefit effectively.
Using survey data from 16 European countries (Austria, Belgium, Greece, Denmark, Finland, Ireland, Italy, France, Germany, Netherlands, Norway, Portugal, Spain, Switzerland, Sweden, and United Kingdom). Bancel and Mittoo (2004), examine the relationship between theory and practice in capital structure decisions across countries with different legal systems. Their results show that financial flexibility is a significant factor in financial decisions. Financial
4
flexibility is gained by having the ability to properly time debt or equity issuance according to the level of interest rates and the market value of equity. Furthermore, their findings show that firms do not rank agency costs or asymmetric information as important considerations in capital structure decisions. Overall they conclude that support for trade-off theory in capital structure choice is more obvious than support for pecking order theory.
Sinan (2010) examines different types of firm characteristics in the UK which may be related to the capital structure of firms and finds that profitability, non-debt tax shields, volatility, and liquidity are significantly negatively correlated with the level of debt which gives some support to pecking order theory. However, tangibility and size are significantly positively correlated with the level of debt providing support for the static trade-off theory. Lemmon and Zender (2010) control for debt capacity when investigating the capital structure of public companies in the United States between 1971 and 2001. Having allowed for debt capacity, they find that pecking order theory explains the observed financing behaviour of a broad cross section of firms because, on average, firms use internal funding to finance their investments.
In a different study, Antoniou, Guney, and Paudyal (2008) argue that despite extensive investigation of capital structure, two fields remain unexplored by researchers. One is the impact of dissimilarities in the legal and governance environment. In the UK and USA we have common law and a market based governance structure, whilst in France and Germany the law is codified and bank based governance structures are the norm. Japan is a hybrid of both. The second factor is the impact of macroeconomic conditions which might influence the capital structure choice of firms. Antoniou, Guney, and Paudyal (2008) find similarities between the determinants of capital structure among the five countries investigated, but the importance of these factors varies between the countries suggesting that firm specific factors cannot altogether explain capital structure and that country specific factors are also important. They also find evidence that the macroeconomic environment is important in explaining capital structure choice, but again the importance of this varies between the countries investigated.
Similarly DeJong, Kabir and Nguyen (2008) investigate the influence of firm specific and country specific factors in the capital structure choice of firms in a sample of 42 countries between 1997 - 2001. They find that firm specific factors (asset tangibility, firm size, profitability and growth opportunities) have significant impact in the capital structure choice
5
in most countries. However, they also find that for each country investigated, at least one of these factors is not significant and in a few countries, capital structure is inconsistent with the predictions of any theory of capital structure. They further find that creditor right protection, bond market development and GDP growth have a significant impact on corporate capital structure. The implication is that firms in countries with stronger legal protection and healthier economic conditions are more likely to take on debt. In other words, country specific factors matter in capital structure decisions.
Most studies show positive correlation between leverage and tangibility (and size), which implies a role for off theory in capital structure decisions. However, this role for trade-off theory is contradicted since the correlation between leverage and profitability is negative. This contradictory finding can be found in several studies such as Titman and Wessels (1988); Rajan and Zingales (1995); Antoniou, Gunay, and Paudyal (2008); De Jong, Kabir, and Nguyen (2008); and Sinan (2010). Fama and French (2002) argue that each capital structure theory possesses one defect in predicting the financing choices of firms. Thus pecking order theory fails to explain why small, low-leverage, growth firms have large equity issues whilst trade-off theory is unable to to explain the negative correlation of leverage and profitability.
Shyam-Sunder and Myers (1999) provide evidence using a simple empirical model and a sample of 157 U.S. firms and find that these firms largely act to finance their deficits with debt. They conclude that the pecking order theory provides a good first-order approximation of the financing behaviour of the firms investigated. Consistent with this view, Fama and French (2002) report that short term variation in earnings and investment is mostly absorbed by debt. In contrast, Frank and Goyal (2003) show that Shyam-Sunder and Myers‟ empirical findings supporting pecking order theory do not survive when a broader sample of firms or a longer time series is used. Chirinko and Singha (2000) argue that the empirical test used by Shyam-Sunder and Myers has little power to distinguish the order of the financing schemes They argue that the model used by Shyam-Sunder and Myers (1999) neglected the possibility of hidden costs of debt or hidden benefits of equity which might change the preference of the financing order.
6
A recent study Bartiloro and Iasio (2012) provides an insight into how recent events in the financial system have impacted on firms‟ capital structure. Economic theory suggests that developed financial systems stimulate economic growth by improving efficiency in the allocation of resources to productive units. This process of channelling funds from savers to productive users is continuously developing (Allen and Santomero, 1998). However, financial innovations in recent years have particularly benefited financial intermediaries as evidenced by the significant increase in transactions between financial intermediaries relative to transactions between financial intermeidairies and non-financial intermediaries. As a result of this, the financial firms‟ balance sheet is reflecting interconnectedness among financial intermediaries, debatably, not a stronger reciprocal and beneficial relationship between financial firms and non-financial firms.
In the wake of the financial crisis the amount of credit channelled to non-financial intermediaries has declined in those countries heavily affected by the financial crisis. However, there has not been a pronounced confirmation that the financial crisis has triggered substantial changes in firms‟ capital structure choices. Firm-level characteristics and effort in timing the market are still the strong factors that influence the determinants of firms‟ capital structure choices (Kayo and Kimura, 2011). These factors are evidently not influenced by the rapid development in recent financial innovation. In some countries, non-financial firms have experienced difficulties in taking advantage of better financing schemes. Severe financial crisis may leave firms financially constrained and consequently, most financially constrained firms would experience credit rationing (quantity constraint) in the capital market, higher costs of borrowing (price constraint), and difficulties in opening or renewing a credit line. Furthermore, these financially constrained firms would forego investment opportunities due to difficulties in raising internal or external capital, even if the investments have positive NPV. These financially constrained firms may also sell their assets to get cash in order to support their operations (Campello, Graham, and Harvey, 2010).
Meanwhile, the capital market condition prior to a financial crisis is generally more favourable than after the financial crisis. Doukas, Guo, and Zhou (2011) studied the effect of a favourable debt market on capital structure choice. They find that the adverse selection costs of equity at the firm level have significant impact on capital structure choice. Firms tend to engage in financing when equity is out of favour. The engagement in debt-financing intensifies when debt market conditions are more favourable, regardless the high adverse selection costs which firms may have. Furthermore, they find the effect of this debt-financing activity on capital structure of the debt issuers persists for more than five years
7
after the issue year. They argue that the trade-off theory of capital structure is contradictory with the financing behaviour of these firms. The implication is that that prior to a financial crisis, when the capital market is favourable, trade-off theory cannot explain the capital structure choice of firms.
Choe, Masulis, and Nanda (1993) find that the managers of firms are expected to minimize the adverse selection costs of equity finance. They find that during a period of economic expansion, the adverse selection costs of equity tend to decline causing the amount of equity issuance to increase relative to debt issuance. Dittmar and Dittmar (2008) support this finding. They find that during economic expansion, the cost of equity falls relative to the cost of debt. Consequently the financing activities related to equity (equity issuance and equity repurchase) significantly increase during a period of economic expansion impacting the capital structure of the firms.
3.
Methodology
3.1.Data
This research employs secondary data in building our discussion of capital structure theories. Various journal databases have been accessed in order to augment the discussion, including the Social Science Research Network, Elsevier, Emerald, and Google Scholar. Moreover, this research utilizes a quantitative approach by examining the correlation between the dependent and independent variables of capital structure determinants. Using financial database ensures accuracy and reliability of the data used in this research project, minimizing the probability of inaccurate results. The secondary data from annual financial statements of non-financial listed companies is compiled from Compustat North America – Fundamental Annuals which is accessed from the Wharton Research Database System (WRDS). A thorough examination of data availability from these two sources is conducted in order to have robust samples. Specific financial accounts which are related to capital structure determinants will be the main focus in data collection and processing (total assets, total current assets, book value per share, total long-term debt, total intangible assets, total liabilities, total current liabilities, total liabilities and stockholders‟ equity, stockholders‟ equity, sales, and total market value). Financial firms are omitted from this research due to the incomparable nature of capital
8
structure characteristics and different structure of balance sheet from non-financial firms. This research uses 2005, 2006, and 2007 as the period of before the financial crisis; and 2008, 2009, and 2010 as the period of after financial crisis. It is impossible to give a definitive statement that identifies the onset of the financial crisis and these dates are chosen as representative. Companies from the United States (S&P 500) are used since:
1. The United States is the epicentre of 2008 financial crisis.
2. The United States is considered as the appropriate place to conduct research on capital structure since firms have a comprehensive menu of financing options and relatively low cost of capital structure adjustment (Myers, 2001).
3. There is limitation on the time in collecting and processing a larger set of companies‟ database.
4. The data of United States companies which are listed in S&P 500 is relatively easily accessed and might be considered representative of companies in the developed world.
Requirements of a company to be included as a sample are:
1. Not in the industry of finance such as banks, insurances, leasing, investment, private equity, and the likes since they are heavily regulated and have different nature of financial statement. In our data set, there are 82 out of 500 firms which belong in the financial industry.
2. Not newly listed or delisted during the period research
3. Availability of certain accounts in the financial statement during the period of research (leverage, tangibility, profitability, size, market to book ratio, liquidity, outstanding shares and shares price).
4. The leverage value is not larger than the total asset value
Based on the above criteria, there are a further 87 firms which have to be excluded from this research. Therefore, the total number of firms which are included is: 500 firms – 82 firms – 87 firms = 331 firms.
3.2. Empirical Methodology
Regression has been used frequently as the empirical methodology to investigate the determinants of capital structure (Rajan and Zingales, 1995; Barbosa and Moraes, 2004;
9
Antoniou, Guney, and Paudyal, 2008; De Jong, Kabir, and Nguyen, 2008; and Sinan, 2010). However, each of these studies did not necessarily employ the same kind of regression. Rajan and Zingales (1995) used Tobit regression and ordinary least squares (OLS) regression. Barbosa and Moraes (2004) used multiple regressions: OLS regression to do the estimation of financial leverage measure and the pooled regression to investigate the relationship between leverage and its determinants. Antoniou, Guney, and Paudyal (2008 p.10) used panel data since it would increase the degrees of freedom, minimize the possibility of collinearity among the explanatory variables, and consequently deliver more efficient estimates. De Jong, Kabir, and Nguyen (2008) used OLS regression with leverage as the dependent variable and firm specific factors as explanatory variables. However, they used dummies to distinguish each individual firm and each country so they assumed that their method was comparable to pooled regression. Sinan (2010) used pooled OLS regression to estimate the correlation between the leverage and its determinants.
As in Antoniou, Guney, and Paudyal (2008), the data collected in this research will be processed using panel data methods which are suitable for analysing multi-dimensional data (cross-section and time series) with clear advantages over multi-dimensional data (Hsiao, 2006). Further advantages of panel data method are:
1. More accuracy in parameter modelling due to more degrees of freedom and more sample variability applied
2. Able to formulate and test more complicated behavioural hypotheses 3. Able to control the impact of omitted variables
4. Able to capture dynamic relationships
5. Able to generate more accurate predictions for individual outcomes by pooling the data
6. Able to decrease the misleading deviation in aggregate data analysis
In this paper we use a panel data sample and randon effect (RE) model. The RE model applies a different intercept for each data unit in both cross-section and time series thus maintaining the level of degrees of freedom. We use
the statistical software package of SAS to examine the presence of significant correlation between the independent variables and the dependent variable. The RE model regression equation consists of a dependent variable (leverage) and an independent variables (tangibility, profitability, size, market to book ratio, and liquidity). The potential equation is:
10
Where:
Leverage (L)
o The leverage measurement is adopted from the widely-used measure of long-term debt over market value of total assets. Long-long-term debt is more commonly used in studies of capital structure (for instance: Titman and Wessels, 1998; Demirguc-Kunt and Maksimovic, 1999; Booth et al., 2001; and Hall, Hutchinson, and Michaelas, 2004) since short-term debt consists of mostly trade credit. The inclusion of trade credit may produce unreliable results because trade credit is not influenced by the same determinants as leverage‟s determinants (De Jong, Kabir, Nguyen 2008).
Tangible (TANG)
o the net fixed assets over the book value of total assets ( as used in Rajan and Zingales, 1995; De Jong, Kabir, and Nguyen, 2008; Sinan, 2010)
Market to book value (MTB)
o the ratio of market value of total assets to the book value of total assets (as used in Rajan and Zingales, 1995; Lemmon and Zender, 2010; De Jong, Kabir, and Nguyen, 2008; Sinan, 2010)
Profitability (PROF)
o the value of earnings before interest and tax over the book value of total assets (as used in Lemmon and Zender, 2010; Sinan, 2010).
Size (Size)
o the value of log of total sales (as used in Rajan and Zingales, 1995; Sinan, 2010).
Liquidity (LIQ)
o the ratio of total current assets to total current liabilities (as used in Graham, 2000; De Jong, Kabir, and Nguyen, 2008; Sinan, 2010).
i is 1, 2, 3,..., N= firms in the same cross-section
t is 2005, 2006, 2007 ;and 2008, 2009, 2010 = period of time
εit : Within-entity error uit : Between-entity error
11
There are two preliminary tests which have to be taken before applying panel data methods to the data set. The tests are Pairwise correlation and Hausman Specification test. The purpose of pairwise correlation test is to detect the occurrence of multicollinearity problem. Multicollinearity problem occurs from strong bivariate correlations among the variables in the model. The maximum correlation which can be tolerated is if the coefficient of the pairwise correlation is below 0.8 (Lewis-Back, 1993, cited in Sinan, 2010 p.22).
Table 2 Pairwise Correlation of all data (2004-2011)
LEV TANG LNSIZE PROF LIQ MTB
LEV 1 TANG 0.142834 1 LNSIZE 0.005862 0.143092 1 PROF -0.29682 0.087263 -0.01521 1 LIQ -0.14478 -0.23291 -0.30966 0.132136 1 MTB -0.43146 -0.19795 -0.2219 0.616582 0.268549 1
Table 3 Pairwise Correlation of all data (2004-2007)
LEV TANG LNSIZE PROF LIQ MTB
LEV 1 TANG 0.201435 1 LNSIZE 0.104169 0.103902 1 PROF -0.30735 0.081281 0.07372 1 LIQ -0.21441 -0.30943 -0.46258 -0.01034 1 MTB -0.46338 -0.24807 -0.33879 0.456217 0.465755 1
Table 4 Pairwise Correlation of all data (2008-2011)
LEV TANG LNSIZE PROF LIQ MTB
LEV 1 TANG 0.187605 1 LNSIZE 0.080512 0.115555 1 PROF -0.25925 -0.00165 -0.07055 1 LIQ -0.20984 -0.25481 -0.39346 0.198357 1 MTB -0.40588 -0.20678 -0.32093 0.563537 0.414797 1
As seen in table 4, 5, and 6, there are no coefficients of pairwise correlation which are larger than 0.8. Thus, it can be concluded that multicollinearity problem does not exist in the variables. These correlation tables provide preliminary description of the relationships among the variables. Tangibility and size have positive correlation with leverage, whilst profitability,
12
liquidity, and MTB ratio have negative correlation. The positive correlation of tangibility and size with leverage is accordance with trade-off theory. Pecking order theory predicts the negative correlation between profitability and liquidity with leverage. However, pecking order theory fails to explain the negative correlation between MTB ratio with leverage. Market timing theory is the one which has the edge in clarifying the negative correlation between MTB ratio with leverage.
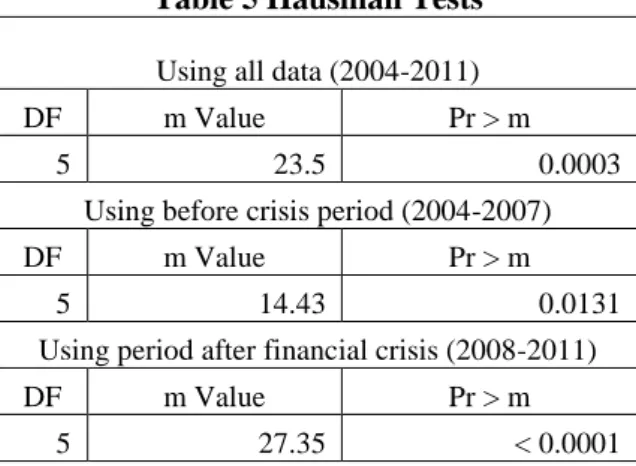
The next preliminary test is the Hausman Specification test. The purpose of the Hausman Specification test is to know whether the individual-specific effects (unobserved individual abilities, say α) are correlated or uncorrelated with certain variables across individual (i) and over time (t) (say Xit). If α and Xit are uncorrelated, then the estimations which RE model
produce will be consistent and efficient compared to FE model (Hsiao, 2006). The Hausman Specification test is conducted with SAS and the results are shown in table 7 below. The results show that all the Pr > m values are below the significance level of 0.05, indicating that the RE model would generate more consistent and efficient result than FE model.
Table 5 Hausman Tests
Using all data (2004-2011) DF m Value Pr > m
5 23.5 0.0003
Using before crisis period (2004-2007) DF m Value Pr > m
5 14.43 0.0131
Using period after financial crisis (2008-2011) DF m Value Pr > m
5 27.35 < 0.0001
Table 8 provides a brief picture of the descriptive statistics of the sample. The table shows the broad range of firms samples which are included in this research project, based on their total assets, total liabilities, EBIT (Earnings before Interest and Tax), and total market value of the firms. Total assets of the samples are ranging from USD 182.74 and USD 331,052.00 million. Total liabilities of the samples are varying between USD 39.30 and USD 170,308.00 million. The EBIT of the samples are varying between USD -7,236.00 and USD 78,669.00 million, whilst total market value of the firm are ranging from USD 438.12 and USD 504,239.58 million. It is noted that this research could not cover all firms which are listed in
13
the United States stock market. However, those wide range of figures show that the samples chosen in this research are fairly representative of all listed firms in the United States.
Furthermore, it is also fairly representative in terms of time observation and number of individual firms. Time observation spans for 8 years (2004-2011) and 4 years (2004-2007 and 2008-2011), whilst the number of individual firms is 331 firms. The total observation will be 2648 observations (2004-2011) and 1324 observations (2004-2007 and 2008-2011). The amount of cross-sectional and time series data is quite abundant that ordinary regression would unlikely be able to produce consistent coefficient of estimation. Therefore, the choice to use panel data regressions in this research is regarded to be necessary in minimizing the probability of unreliable results.
14
Table 6 Descriptive statistic of the samples
2004 2005 2006 2007 2008 2009 2010 2011 Total Assets Mean 16,577.98 15,090.23 16,615.70 18,954.52 19,231.58 19,651.44 21,484.18 23,368.70 Standard Deviation 30,646.20 24,999.03 27,113.83 32,292.45 32,224.04 32,490.82 36,280.05 38,569.20 Min 182.74 248.12 333.54 334.36 477.55 679.73 982.07 1,311.84 Max 270,344.00 208,335.00 219,015.00 270,634.00 275,644.00 265,245.00 302,510.00 331,052.00 Total Liabilities Mean 9,364.30 8,269.64 9,203.72 10,481.12 11,211.72 11,343.26 12,174.81 13,332.70 Standard Deviation 17,741.15 13,691.91 15,120.06 17,826.24 18,580.04 19,145.15 20,828.36 21,955.54 Min 39.30 59.00 82.09 151.32 161.89 98.05 152.30 189.25 Max 164,547.00 101,696.00 111,932.00 155,094.00 160,277.00 168,898.00 166,427.00 170,308.00 EBIT Mean 2,537.81 2,436.52 2,751.49 3,050.66 3,264.36 2,978.78 3,290.76 3,802.17 Standard Deviation 5,160.42 4,846.88 5,501.04 5,895.74 6,785.93 5,555.42 6,017.26 7,096.62 Min -82.18 -106.28 -126.43 - 95.52 -4,467.00 - 7,236.00 - 344.00 5.00 Max 45,639.00 59,255.00 68,355.00 69,905.00 78,669.00 42,946.00 54,882.00 69,687.00
Total Market Value
of the Firm
Mean 21,212.95 22,057.22 23,857.74 27,134.39 22,079.14 20,928.44 23,890.32 25,690.42 Standard Deviation 35,665.95 38,571.92 40,272.39 46,844.68 41,007.57 36,693.72 39,402.39 44,760.78 Min 438.12 734.07 1,269.90 1,523.27 1,110.58 548.75 1,093.69 2,057.96 Max 328,115.26 344,490.61 439,013.27 504,239.58 397,234.08 322,334.13 364,064.48 401,253.84
15
One feature that distinguishes this research with other empirical capital structure studies is the choice of the time frame. The time frame is divided into two periods which are the period before financial crisis and the period after financial crisis burst. This research emphasizes that the 2008 financial crisis may significantly affect firms‟ characteristics and their preferences on debt or equity financing. As discussed in the literature review, firms with high profitability do not prefer the same capital structure choices compared to firms with low profitability. Firms with high MTB ratio do not favor the same capital structure compared to firms with low MTB ratio as well. The descriptive statistics above show that the effect of financial crisis is pronounced. The impact of the crisis can be seen from the heavy fluctuation of the EBIT and the total market value of the firm. For instance, although the average EBIT only dropped in 2009 (from USD 3,264.36 to USD 2,978.78 million), the lowest EBIT in 2007, 2008, and 2009 are USD 95.52, USD -4,467.00, and USD -7,236.00 million respectively. The average market value of the firm also dropped significantly in 2008 and 2009 (from USD 27,134.39 million in 2007 to USD 22,079.14 million in 2008 and USD 20,928.44 million in 2009). The static figures of average total assets and liabilities in year 2008 (from USD 18,954.52 million in 2007 to USD 19,231.58 million in 2008) and 2009 (from USD 19,231.58 million in 2008 to USD 19,651.44 million in 2009) indicated that firms encountered considerable distress in operating their business. It should be kept in mind that these troubling figures have not represented the downfall of financial industry in 2008 yet. Therefore, the decision to divide the time frame of this research is essential in order to investigate the adverse effect of financial crisis on firms‟ aspects which may influence the capital structure choices of the firms.
16
4.
Results and Discussion
This section displays the results of panel data regressions using data for the period 2004-2011 broken into two sub-periods 2004-2007 (to represent the period of before financial crisis), and 2008-2011 (to represent the period of after financial crisis). Each table contains the detailed results gathered from running PROC PANEL procedures in SAS. The columns which have to be observed are the estimate (of coefficient) and the Pr > |t|. The estimate column specifies the coefficient of each variable tested in the regression. The coefficient expresses the magnitude of influence on leverage and the relationship with leverage. A higher number of coefficients implies that particular variable has greater influence on leverage. The positive or negative sign of the coefficient indicates whether the variable has direct or inverse relationship with leverage.
The next column to be examined is Pr > |t|. It represents the significance of a particular variable towards leverage. If the value is below 0.01, 0.05, and 0.1 (meeting the requirements of confidence level of 99%, 95%, and 90% respectively) then the variable is significant. Otherwise, the variable is not significant. Significant variables imply that they have influence on leverage. On the other hand, insignificant variables imply that they do not have influence on leverage. However, it would be unwise to exclude them from any discussion of leverage. First reason is by being insignificant, it tells that there is changes which make the independent variables insignificant. The independent variables in this research are chosen because they have theoretical ground to be significantly affecting the leverage and some of previous empirical studies showed that they are significant. If in this research they become insignificant, the discussion could suggest the possible reasoning which makes them insignificant. Second reason is because the coefficient‟s sign and value, to some extent, contain explanatory power to explain the relationship between the independent variables and the dependent variable.
17
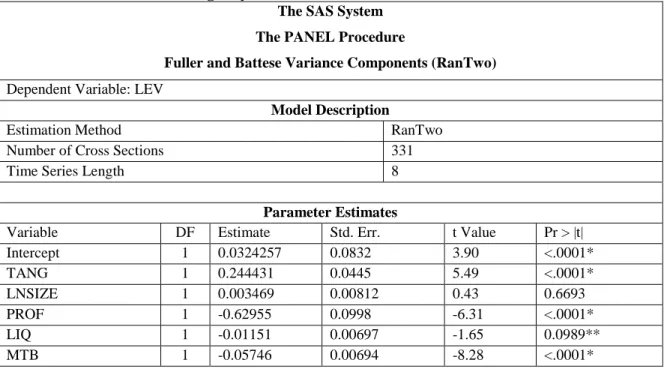
Table 7 Result (truncated, full result is available in the appendix) of panel data procedure in SAS using all years in the time horizon (2004-2011)
The SAS System The PANEL Procedure
Fuller and Battese Variance Components (RanTwo) Dependent Variable: LEV
Model Description
Estimation Method RanTwo
Number of Cross Sections 331
Time Series Length 8
Parameter Estimates
Variable DF Estimate Std. Err. t Value Pr > |t| Intercept 1 0.0324257 0.0832 3.90 <.0001* TANG 1 0.244431 0.0445 5.49 <.0001* LNSIZE 1 0.003469 0.00812 0.43 0.6693 PROF 1 -0.62955 0.0998 -6.31 <.0001* LIQ 1 -0.01151 0.00697 -1.65 0.0989** MTB 1 -0.05746 0.00694 -8.28 <.0001*
* and ** mark the significant at the 1 and 10 percent level, respectively.
The result above shows that with confidence level of 99%, the significant independent variables are TANG, PROF, and MTB which reflect tangibility, profitability, and market to book ratio. The LIQ (represents liquidity of the firms) variable is significant at the confidence level of 90%. The LNSIZE (represents size of the firm) variable is not considered as a significant variable. However, the insignificance of LIQ and LNSIZE variables does not make them irrelevant to our analysis. Indeed their insignificance is interesting since, in different ways, they each provide support for trade-off theory and pecking order theory. In trade-off theory, firm size and tangibility would be significantly and positively correlated with leverage. (See for example, De Jong, Kabir, and Nguyen (2008); Sinan (2010); and Lemmon and Zender (2010)) Pecking order theory, on the other hand, implies that liquidity should be significantly and negatively correlated with leverage level just like profitability. (See for example, Graham (2000); De Jong, Kabir, and Nguyen (2008); and Sinan (2010) ) The strongest variables among five determinants are profitability and tangibility with coefficient values of -0.62955 and 0.244431 respectively. It can be roughly interpreted that in this period the level of leverage is largely determined by the level of profitability and tangibility. Despite being significant, the MTB ratio coefficient value is relatively low at only -0.05746. That value is relatively
18
small compared to the coefficient of profitability and tangibility. However, it should be remembered that this coefficient value would likely to fluctuate when the period of the regression is grouped in the next section.
The result above also shows the coefficient of each independent variable. Tangibility and size have positive coefficients of 0.244431 and 0.003469. The significant and positive coefficient of tangibility is predicted in trade-off theory since tangible assets serve as collateral for debt. Furthermore, tangible assets are one of the instruments to mitigate the risk which occurs in shareholder and bondholder conflict (Jensen and Meckling, 1976). Thus, firms with a relatively large proportion of tangible assets could utilize this advantage to obtain more leverage than firms with a smaller proportion of tangible assets. The coefficient of size indicates a positive relationship between firm size and leverage, although it is not significant. Similar results are also found in empirical studies of Antoniou, Guney, and Paudyal (2008) and Sinan (2010). Titman and Wessels (1988) argue that large firms have more diversification in their revenue streams which make them able to tolerate higher levels of leverage in their capital structure. Larger firms are also more favourably viewed by credit rating agencies and are accorded a higher grade of credit rating implying that larger firms can issue higher levels of ebt at a lower cost than smaller firms. This encourages larger firms to lever up their capital structure.
The coefficient of profitability is -0.62955 and is significant. This implies that the more profitable a firm the lower its leverage. This behaviour means that trade-off theory fails to explain the relationship between profitability and leverage. Trade-off theory argues that firms with high profitability would have higher leverage because they have more taxable income to shield. Our result gives more support to pecking order theory which implies that firms prefer to finance projects with internal funding. Therefore, firms with higher levels of profitability tend to use less leverage in their capital structure. This result is supported by Titman and Wessels (1988); Rajan and Zingales (1995); Graham (2000); Antoniou, Guney, and Paudyal (2008); De Jong, Kabir, and Nguyen (2008); and Sinan (2010), among others.
The coefficient of liquidity is negative and significant. One reason for this suggested by Lipson and Mortal (2009), is that firms with high liquidity use less leverage because the cost of capital of using liquidity is lower than the cost of debt and the cost of equity.
19
Furthermore, pecking order theory also suggests that internal funding is the first order of firms‟ capital structure. Higher levels of liquidity may indicate that the firms have sufficient liquid assets to finance their operations. This finding is supported by Graham (2000); Antoniou, Guney, and Paudyal (2008); De Jong, Kabir, and Nguyen (2008); and Sinan (2010) among others.
The MTB ratio is derived from comparing the market capitalization and the book value of assets of the firm. The MTB ratio categorizes a firm into either an undervalued firm (the MTB ratio is below 1) or an overvalued firm (the MTB ratio is higher than 1). Overvalued firms are often recognized as firms with relatively high growth potential. The growth potential of a firm is one reason investors might be willing to pay more than the book value of the firm. This method of firm valuation can be performed by an investor who has adequate information about the firm. When an investor does not have the necessary information to value a firm, the investor tends to undertake herding behaviour. The accumulated demand from informed and uninformed investors will tend to drive up the share price of the firm.. Baker and Wurgler (2002) suggest that when the share price of a firm is overvalued, managers prefer to issue new shares since the firm would gain a higher price for a new issue of shares relative to book value. In contrast, when the share price of the firm is undervalued, managers prefer to buy back the outstanding shares since the firm could obtain a lower price for each share repurchased. The firms would also prefer to raise capital by issuing debt rather than issuing new shares in an undervalued condition. Our regression result for the whole period (2004-2011) supports the findings of Baker and Wurgler (2002). The coefficient of the is -0.05746. The negative sign implies that when the MTB ratio is relatively high, that is, the firm is overvalued, everage is relatively low. The findings of Rajan and Zingales (1995); Graham (2000); De Jong, Kabir, and Nguyen (2008); and Sinan (2010) support our findings on the MTB ratio variable.
In conclusion, for the whole sample period no theory of capital structure fully explains the pattern observed.. Regarding the relationship with leverage, trade-off theory could predict the positive relationship between tangibility and firm size, but it fails to explain the negative relationship between profitability and liquidity. Pecking order theory could explain the negative relationship between profitability and liquidity. However, this theory
20
states that the relationship between the MTB ratio and leverage will be positive where in fact, the relationship is negative. Market timing theory explains the negative relationship between the MTB ratio and leverage. However, our results show that the explanatory power of market timing theory is restricted only to the MTB ratio variable. This theory therefore also has limited explanatory power.
4.2. 2004-2007 Period (the period of before financial crisis/economic
expansion)
Table 10 summarises our findings for the sub-period 2004-2007. The coefficient sign of each variable is equal to the previous results (regression of year 2004-2011). The values of other coefficients are also similar to the results for the full sample. However, there is an evident drop in the value of the tangibility coefficient. The significant independent variables are tangibility, profitability, and market to book ratio. Conversely, the insignificant independent variables are firm size and liquidity.
There is one pronounced difference in the regression of year 2004-2007, which is the lower coefficient value of tangibility from 0.244431 to 0.175105 (a decrease of 28.36%). This implies that during economic expansion, tangibility has less dominance in determining the leverage of the firm. This could be caused by increases in the coefficient values of other determinants which compensate for the lower coefficient value of tangibility. Nevertheless, the coefficient of other determinants show little change for the sub-sample period. The reduction in the coefficient of tangibility tangible assets, which are involved in a debt contract, have certain roles in determining the characteristics (interest rate) of the debt.
Table 8 Result (truncated, full result is available in the appendix) of panel data procedure in SAS using 2004-2007 period
The SAS System The PANEL Procedure
Fuller and Battese Variance Components (RanTwo) Dependent Variable: LEV
Model Description
Estimation Method RanTwo
21
Time Series Length 4
Parameter Estimates
Variable DF Estimate Std. Err. t Value Pr > |t| Intercept 1 0.265287 0.0642 4.13 <.0001* TANG 1 0.175105 0.0369 4.75 <.0001* LNSIZE 1 0.006671 0.00614 1.09 0.2777 PROF 1 -0.58715 0.0990 -5.93 <.0001* LIQ 1 -0.00615 0.00616 -1.00 0.3183 MTB 1 -0.05507 0.00606 -9.09 <.0001*
* and ** mark the significant at the 1 and 10 percent level, respectively.
Tangible assets generally serve as proxies for collateral which a firm could use to acquire debts. Collateral mitigates the adverse selection which comes from asymmetric information between the lender and the borrower (Jimenez and Saurita (2004). The lower value of the coefficient of tangibility in the earlier sub-sample period, might indicate that during economic expansion,lenders face lower adverse selection issues. Collateral also mitigates moral hazard problems like asset substitution and half-hearted managers in making the investment a success. Asset substitution problems arises from the shift of risk from shareholders to bondholders, whilst the revenue of bondholders remains the same whilst the revenue of shareholders potentially increases. During an economic expansion, one may argue that the marginal increase in revenue is higher than the marginal increase in risk. Allen and Gale (2000) argue that by exploiting asset price bubbles during economic expansion, a firm may gain relatively large increases in revenue by undertaking slightly riskier investments. This implies that the role of tangible assets as an instrument to mitigate the risk of adverse selection is less evident during an economic expansion period leading to a lower coefficient of tangibility lower than other periods.
4.3. 2008-2011 Period (the period of after financial crisis burst)
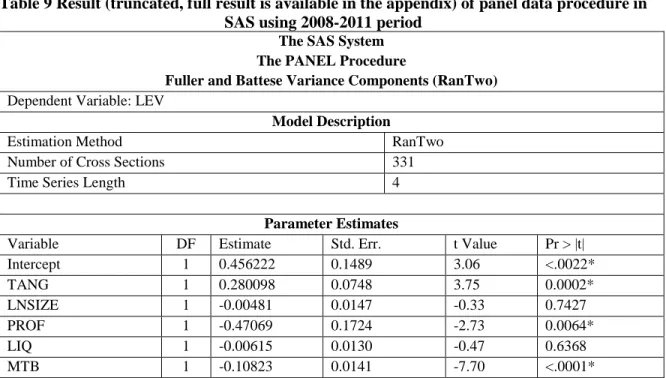
Table 11s summarises our results for the period after financial crisis burst which was 2008-2011. There are more distinct changes which occur in this period. First, the coefficient of profitability in 2008-2011 period is 25,23% lower than the coefficient of profitability in the overall period (2004-2011). The difference implies that the influence of profitability on leverage is less than for the whole sampleperiod. The second distinct change is the difference in the MTB ratio coefficient between 2008-2011 period and
22
2004-2011 period which means that the impact of a firm‟s market valuation is much more stronger than in the 2004-2011 period. The last unique property of the result is the negative sign of the coefficient of firm size. Even though it is not significant, the negative sign of the coefficient might indicate important shifts in capital structure determinants during financial crisis.
Table 9 Result (truncated, full result is available in the appendix) of panel data procedure in SAS using 2008-2011 period
The SAS System The PANEL Procedure
Fuller and Battese Variance Components (RanTwo) Dependent Variable: LEV
Model Description
Estimation Method RanTwo
Number of Cross Sections 331
Time Series Length 4
Parameter Estimates
Variable DF Estimate Std. Err. t Value Pr > |t| Intercept 1 0.456222 0.1489 3.06 <.0022* TANG 1 0.280098 0.0748 3.75 0.0002* LNSIZE 1 -0.00481 0.0147 -0.33 0.7427 PROF 1 -0.47069 0.1724 -2.73 0.0064* LIQ 1 -0.00615 0.0130 -0.47 0.6368 MTB 1 -0.10823 0.0141 -7.70 <.0001*
* and ** mark the significant at the 1 and 10 percent level, respectively.
The lesser influence of profitability on leverage is consistent with pecking order theory where profitability is the first order of firms‟ financing choice. During a financial crisis, the profitability of firms would be considerably lower than in normal times leaving the internal financing capacity also be much lower. Consequently, it would be more difficult to rely on internal financing capacity to cover the cost of operations and investment. The firms may favor external financing instead of sacrificing internal cash holdings which had already deteriorated because of the crisis. For instance, Campello, Graham, and Harvey (2010) find that financially constrained firms would withdraw funds from their facilities of outstanding lines of credit in advance during a financial crisis. The tendency towards external financing may cause the coefficient of profitability to become lower.
Market timing theory suggests that the negative sign of the MTB ratio coefficient implies an inverse relationship between market to book ratio and leverage level. When the MTB ratio is relatively low, the level of leverage will be relatively high and vice versa.
23
Furthermore, the relatively low value of the coefficient of the MTB ratio during the financial crisis (-0.10823) is almost twice as low than during the overall period (-0.5746) implying that MTB ratio has a stronger influence on the leverage of firms. During the period of financial crisis (2008-2011), the market valuation of firms is relatively low. This could indicate that firms prefer a higher leverage level in their capital structure. A higher level of leverage can be achieved through either: stock repurchase and/or debt issuance. Stock repurchase is a common strategy when market valuation of the firm is relatively low and economic conditions are normal. However, during a financial crisis, firms are likely to spend cash more cautiously and build cash reserves as a buffer against potential credit supply shocks (Almeida, Campello, and Weisbach, 2004 cited in Campello Graham Harvey, 2010 p. 472).
Table 10 Total value of bond and stock issuance of non financial industry Source: www.federalreserve.gov
Items / Years 2004 2005 2006 2007 2008 2009 2010 2011 Bond Issuance
(in million USD) 259,968 216,072 338,777 404,819 318,201 478,508 573,626 617,024 Stock Issuance
(in million USD) 64,345 54,713 56,029 65,440 44,545 63,043 60,831 57,822 Bond to Stock
issuance ratio 4.04 3.95 6.05 6.19 7.14 7.59 9.43 10.67
It can be seen from table 12 that from 2007 to 2011 there were uneven increases in the bond to stock issuance ratio. These uneven increases indicate that during 2008-2011, when firms decide to raise external capital, they prefer to issue corporate bonds rather than to issue new stocks. This fact also indicates the high level of leverage which is predicted by the negative MTB ratio coefficient occurs because firms choose to issue corporate bonds rather than to repurchase outstanding stocks.
The last unique property in the regression result of 2008-2011 is the negative sign of the firm size coefficient. Previous results from the overall period (2004-2011) yield a positive sign of firm size coefficient. Likewise, previous empirical studies suggest that size has a positive coefficient (Titman and Wessels, 1988; Rajan and Zingales, 1995; Graham, 2000; Antoniou, Guney, and Paudyal, 2008; De Jong, Kabir, and Nguyen, 2008; Sinan, 2010; Lemmon and Zender, 2010). The different result compared to previous empirical studies could be cautiously attributed to the disparities in data samples and statistical
24
procedures. However, the different result with the overall period regression should be carefully interpreted.
The overall period shows that the positive relationship between firm size and leverage is in accordance with trade-off theory. The theory assumes a larger firm could borrow at a lower cost than a smaller firm and hence a larger firm would have more leverage in its capital structure. On the contrary, our results during financial crisis period shows the opposite. The result suggests that a larger firm would have less leverage and a smaller firm would have more leverage in its capital structure. Peterson and Shulman (1987, cited in Barbosa and Moraes, 2004 p. 60) argue that a larger firm would indeed have less leverage since a larger firm has more funding options beside debt financing. However, they also argue that smaller firms would have less leverage because a smaller firm does not have stable income and credible track record.
Bharath, Pasquariello, and Wu (2009) conduct an investigation on the core of pecking order theory which is asymmetric information. The proxies of information asymmetry are market liquidity and transaction cost. Transaction costs (e.g. bid-ask spread) have three main components namely order processing, inventory, and adverse selection. They argue that adverse selection is positively correlated with the level of information asymmetry. Furthermore, they find that if the basic assumption of pecking order theory, severe adverse selection (and information asymmetry), is dominant in the data, then the theory would perform better in predicting capital structure choices.
If the justification of pecking order theory, proposed by Bharath, Pasquariello, and Wu (2009) and applicable assumptions during a financial crisis are used, the anomaly of smaller firms with high leverage could be explained. During a financial crisis, a smaller firm is more likely to be financially constrained. Campello, Graham, and Harvey (2010) find 82% of firms very affected by financial crisis, are small firms. A smaller firm may need considerable additional capital in order to survive and cautiously invest in the critical parts of the firm. In the 2008 financial crisis, the problem of asymmetric information was exacerbated by the obscurity of complex derivative products (Barell and Davis, 2008). Thus, pecking order theory would be more capable to explain the capital structure choice (Bharath, Pasquariello, and Wu, 2009). During a financial crisis, even though a smaller firm prefers internal financing, it has less internal financing capacity.
25
Consequently, it is forced to raise capital from external sources. The choice of external financing consists of debt or equity issuance. Equity issuance would be less preferable since equity market during a financial crisis is very volatile and the firm would be required to heavily discount the price of any new shares issued. The remaining option for a smaller firm to raise capital is debt. Therefore, during a financial crisis a smaller firm tends to prefer debt financing, which is reflected on the negative sign of firm size coefficient.
4.4. Comparison of Before and After Financial Crisis Burst
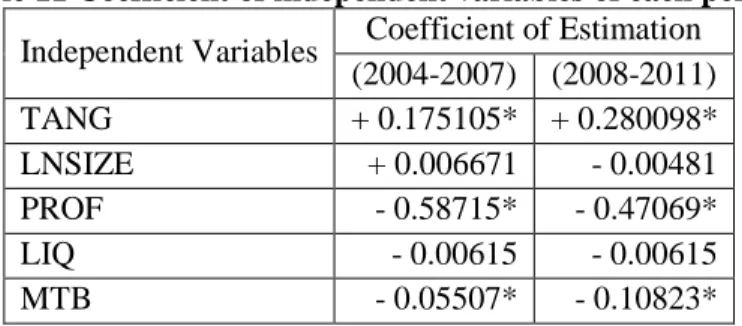
This section compares the differences which occur between our two sub-sample periods. First is the tangible variable. The tangible variable from the period 2004-2007 is almost 40 per cent higher than in the 2008-2011 period. This significant increase means that the tangible variable during the financial crisis had greater influence on leverage than during the preceding period of economic expansion. One prominent function of tangible assets is to mitigate the adverse selection problem faced by lenders (Jimenez and Saurita, 2004). This adverse selection problem was much more severe during the 2008 financial crisis (Barell and Davis, 2008). Thus, it is logical that during a financial crisis lenders seek better quality and quantity of tangible assets to compensate for the rising adverse selection problem. This increased desire for gives this variable greater impact on firm leverage..
Table 11 Coefficient of independent variables of each period
Independent Variables Coefficient of Estimation (2004-2007) (2008-2011) TANG + 0.175105* + 0.280098* LNSIZE + 0.006671 - 0.00481 PROF - 0.58715* - 0.47069* LIQ - 0.00615 - 0.00615 MTB - 0.05507* - 0.10823* * and ** mark the significant at the 1 and 10 percent level, respectively.
The second difference is the negative coefficient sign on the firm size variable. As discussed in the previous section, the firm size coefficient may shift toward a negative sign reflecting the inverse relationship between firm size and leverage. Conversely, the existence of asymmetric information and relatively poor internal financing capacity may
26
explain the inverse relationship between firm size and leverage. During a financial crisis, information asymmetry is a real issue. According to pecking order theory, big firms and small firms would internal financing capacity in circumstances where information asymmetry is relatively high. Big firms would have greater potential to fulfil their capital requirements using internal sources alone. However, small firms would be likely to experience internal financial constrains and therefore be more dependant on external capital. Since the equity market during a financial crisis is not favourable, small firms would involuntarily be encouraged to raise external capital by leverage. Therefore, the coefficient of firm size is negative reflecting the tendency of big firms toward low leverage and small firms toward high leverage.
The third difference is the coefficient of the MTB ratio which fell almost 200 per cent during financial crisis compared to its value in the pre-crisis period. Since the coefficient of the MTB ratio is negative, the lower value reflects greater influence of the MTB ratio on the leverage of the firm. Similar result is found on the comparison of regression results between 2008-2011 and between 2004-2011 period. In brief, the greater influence of the MTB ratio during financial crisis might make debt issuance preferable to equity issuance. Thus, the MTB ratio becomes more influential as a determinant of capital structure.
5.
Concluding Remarks
5.1.Conclusions
This paper compares the determinants of capital structure before and after the financial crisis of 2008. This is important because it might shed light on which capital structure theory has more explanatory power during a financial crisis. There are three main capital structure theories which are used as theoretical ground in developing the relationship between capital structure choice and its determinants: trade-off theory, pecking order theory, and market timing theory. Though each theory has different core assumptions, each employs some determinants with different predicted outcomes. Trade-off theory highlights the importance of interest tax shield benefit exploitation by firms. The theory
27
predicts profitability would be positively correlated with leverage. However, pecking order theory emphasizes the importance of information asymmetry and predicts a negative correlation between profitability and leverage. Pecking order theory also suggests a positive correlation between the MTB ratio and leverage. However, market timing theory contradicts this prediction since firms would try to time the market by issuing new shares when the MTB ratio is relatively high and repurchase outstanding shares or issuing debt when the MTB ratio is relatively low.
Capital structure theories regard many determinants that could influence capital structure. This research project includes five determinants which are widely used in capital structure studies: tangibility, firm size, profitability, liquidity, and MTB ratio. Leverage serves as the proxy of capital structure. In our empirical analysis, capital structure determinants are set as independent variables and leverage is set as dependent variable. This research project uses data from non-financial and non-utility firms listed in the S&P 500 index. The United States is intentionally chosen because the country was the epicentre of the crisis and its capital market is well developed. Our data is analysed using a panal data model.. As well as a the whole period (2004-2011) the data is divided into two sub-periods: 2004-2007 (to represent the period of before financial crisis), and 2008-2011 (to represent the period of after financial crisis occurred).
The results of the overall period regression yields similar inference as previous empirical studies on capital structure theories (Rajan and Zingales, 1995; De Jong, Kabir, and Nguyen, 2008; Sinan, 2010). Tangibility and firm size are positively correlated with leverage, whilst profitability, liquidity and MTB ratio are negatively correlated with leverage. Furthermore, the significant variables are tangibility, profitability, and MTB ratio. These results reflect that the explanatory power of each capital structure theories only exist to part of determinants used in capital structure studies. One implication of this is that or a longer period of time, there might be no prevailing capital structure theory which could dominantly predict the capital structure choices of firms. These ambiguous results do not necessarily imply conflicts among the capital structure theories. Fama and French (2002) argue that capital structure theories could share many predictions on leverage, even though the predictions are motivated by different reasons.
28
The regression results of 2004-2007 reveal one interesting difference which is noticeably lower coefficient of tangibility compared to the overall period and 2008-2011. Since tangible assets used as collateral mitigate the adverse selection problem, lower influence of tangibility may indicate that the lenders tolerate lower adverse selection when lending capital. Other than this, the results are similar to the regression results of the overall period. It indicates that during economic expansion there is no one predominant capital structure theory which is able to predict capital structure choices of firms.
The regression results of post crisis period signify some differences compared to the overall period and 2004-2007 period. The first difference is a notable lower value of the coefficient of profitability. The weaker internal financing capacity during this financial crisis may cause profitability to become less influential. The second difference in this period is the coefficient of the MTB ratio which is nearly twice as high compared to the earlier period. This stronger influence of the MTB ratio could be attributed to the preference of firms toward debt financing during this financial crisis. The last difference is the negative sign of firm size coefficient. It is common for a bigger firm to have lesser leverage. However, it is uncommon for a smaller firm to have bigger leverage in its capital structure. This peculiarity may be attributed to the abundant information asymmetry during the 2008 financial crisis which hinders a smaller firm to raise external capital through equity resulting in higher leverage in its capital structure.
Table 12 Compilation of the regression results and the related capital structure theory
All Before After
Tangibility + 0.244431* TOT + 0.175105* TOT + 0.280098* TOT Firm Size + 0.003469 TOT + 0.006671 TOT - 0.00481 POT Profitability - 0.62955* POT - 0.58715* POT - 0.47069* POT Liquidity - 0.01151** POT - 0.00615 POT - 0.00615 POT MTB ratio - 0.05746* MTT - 0.05507* MTT - 0.10823* MTT
* and ** mark the significant at the 1 and 10 percent level, respectively. TOT, POT, and MTT are short for Trade-off Theory, Pecking Order Theory, and Market Timing Theory, respectively.
The results show that during the 2008 financial crisis, pecking order theory has slightly more explanatory power than the other two theories considered. Pecking order theory
29
could predict three out of five capital structure determinants, compared to trade-off and market timing theory which could only predict one capital structure determinant. As Bharath, Pasquariello, and Wu (2008) found in their research, firms which face higher information asymmetry have more tendency to follow the prediction of pecking order theory. During the 2008 financial crisis, the amount of information asymmetry is arguably larger than the other periods, resulting in the increase of explanatory power of pecking order theory.
One limitation of this research is regarding the chosen turning point of the financial crisis occurrence. There is no academic consensus on the exact particular timing of the onset of the 2008 financial crisis exposing the risk of overlapping period in the data set. Likewise, though this research emphasizes the time period around the financial crisis, it does not provide an inarguable exact point on when the financial crisis did start. However, the assumption used on this research has been cautiously taken, resulting in a division of our period which gives obvious differences on the circumstances before and after the financial crisis occurred. Further research could employ a more detailed judgment of the timing period of the crisis and observe the changes of capital structure choices using quarterly data. Hence, the analysis of the capital structure choice and its determinants could be more precise and specific.
Another limitation of this researchconcerns the geographical coverage and classification of data set. Our research covers only the United States. Further research could employ different countries which are also heavily affected by 2008 financial crisis (e.g. United Kingdom, Spain, France, or Germany). Furthermore this research also does not apply classification of firms on the data set. Frank and Goyal (2003) categorize the firms into five classes based on their dividend policy, firm life cycle, firm size, MTB ratio, and profitability. Even though they find similar factors affecting capital structure choices in a similar way across these classes of firms, specific circumstance (abundant information asymmetry) during financial crisis may generate different conclusions on factors which affect the capital structure choice.