A systematic review of shared visualisation to achieve
common ground
$
Nor
’
ain Mohd Yusoff
a,n, Siti Salwah Salim
b,1 aFaculty of Computing and Informatics, Multimedia University, 63100 Cyberjaya, Malaysia b
Faculty of Computer Science and Information Technology, University of Malaya, 50603 Kuala Lumpur, Malaysia
a r t i c l e i n f o
Article history: Received 25 June 2014 Received in revised form 25 November 2014 Accepted 17 December 2014 Available online 25 December 2014
Keywords: Shared visualisation Collaborative design Teamwork
Human–computer interaction
a b s t r a c t
This paper reports a systematic review of shared visualisation based on fifteen papers from 2000 to 2013. The findings identified five shared visualisation strategies that represent the ways implemented to process data sharing and knowledge to arrive at the desired level of understanding. Four visualisation techniques were also identified to show how shared cognition is made possible in designing tools for mediating data or knowledge among the users involved. These findings provide research opportunities in integrating rich interactive data visualisation for mobile-based technologies as an effective mean in supporting collaborative work. Finally, social, task and cognitive elements which can be significantly supported by shared visualisation and a guideline for future researchers seeking to design shared visualisation-based systems are presented.
&2014 The Authors. Published by Elsevier Ltd. This is an open access article under the CC BY license (http://creativecommons.org/licenses/by/4.0/).
1. Introduction
Achieving common ground or shared cognition is one of the major aims in the development of Collaborative visualisation systems. Collaborative visualisation is defined by[31]as“the shared use of computer-supported, (inter-active,) visual representations of data by more than one person with the common goal of contribution to joint information processing activities”.
In this definition, the term “shared use of … visual representations”refers to any form of joint viewing, inter-acting, discussing or interpreting within a group of members
to amplify shared cognition that can be augmented by the use of visual representation. This shared cognition can be mediated and developed through any type of visual repre-sentation shared among the users, such as shared display (i.e. input technology) or using multiple displays as medium in shared devices. The use of shared visual representation, which remains one of the concerns of many researchers, is how data or knowledge can be captured, represented, presented and analysed among the users involved. Conse-quently, in the context of shared mental model, sharing cognition is described as having many types and aspects, which may later; result in different kinds of results of shared cognition.
According to Isenberg et al.[31], shared cognition can be initiated in several scenarios within two types of collaborative visualisation environment, which are distrib-uted and co-located. A distribdistrib-uted collaborative visualisa-tion involves how collaborative contribuvisualisa-tions can be effectively structured and integrated into a shared visua-lisation directed to the division or spread of resources such as design artefacts, design knowledge or design team to
Contents lists available atScienceDirect
journal homepage:www.elsevier.com/locate/jvlc
Journal of Visual Languages and Computing
http://dx.doi.org/10.1016/j.jvlc.2014.12.003
1045-926X/&2014 The Authors. Published by Elsevier Ltd. This is an open access article under the CC BY license (http://creativecommons.org/licenses/by/4.0/).
Abbreviations:(CoVis), collaborative visualisation; (SMM), shared men-tal model; (SSC), socially shared cognition; (SSA), shared situation awareness; (HCI), human–computer interaction
☆This paper has been recommended for acceptance by Shi Kho Chang. nCorresponding author. Tel.:þ603 83125247; fax:þ603 83125264.
E-mail addresses:[email protected](N.M. Yusoff),
[email protected](S.S. Salim). 1
form common ground. Such activities are performed via video conferences and email-based data discussions. On the other hand, a co-located collaborative visualisation is where these collaborative works are initiated into a shared visualisation in the same locations, where design team can conduct further discussion via wall displays or shared tables. In order to understand the implication of strategies demonstrated in both types of collaborative visualisation environments, this study aims to identify the implications of different visualisation strategies and techniques of shared visualisation applications as well as how they can be applied to designing collaborative visualisation sys-tems. In particular, we are interested in determining the strategies and techniques that have been undertaken by researchers in handling the datasets in shared visual representation to reach a particular result of shared cognition.
2. Related works
The concept of a shared mental model in human–
computer interaction is derived from the field of teamwork and collaboration [3]. Following the publication of an article by Payne [3], there has been much interest in shared mental models in the context of computer technol-ogy, particularly in the area of human–computer interac-tion (HCI). However, until now there is no substantial research review related to the use of systematic literature reviews in shared visualisation and which above all, focuses on developing a shared mental model.
Isenberg et al.[31]provided a detailed review on 5 real world examples of scenarios in which collaborative visua-lisation tools were used. The study urged researchers to extend their investigations into collaborative visualisation (CoVis). One of the specific challenges found in the research space intersecting collaborative work and visua-lisation is the visual representations aspect to support the process of social interaction to reach a common under-standing in terms of dataset.
Grimstead et al.[26]reviewed 42 CoVis systems, which were grouped and compared in terms of four application areas: collaborative problem-solving environments, virtual reality environments, multi-player online games and multi-user enabling of single user applications. The study concludes that a CoVis system that needs to support many simultaneous users must be scalable if it is designed to maximise the use of distributed resources and network facilities.
In summary, these studies only describe the impor-tance of shared cognition or shared application in CoVis systems. However, none of them analysed the shared visual representation for building a shared mental model, although this is one of the major aims for CoVis systems. 3. Research design
This systematic review follows the guidelines given by Kitchenham and Charters[34]that have been used in the software engineering field, as well as in other domains, including computer education [4] and business process measurement ([1]. Ref. [34]’s guidelines state that a
literature review should be systematic and minimise researcher bias. Two protocols are necessary: first, a set of research questions that captures the rationale for and objectives of a review should be developed; second, a search strategy that details search terms, library databases and study selection criteria. The process by which papers and data for this review were extracted is further described.
3.1. Research questions
The main purpose of this systematic literature review is to present research on using shared visualisation to achieve a shared mental model. This review aims to identify the shared visualisation strategies and techniques that can facilitate the development of shared mental models (SMM); it addresses the following specific research questions:
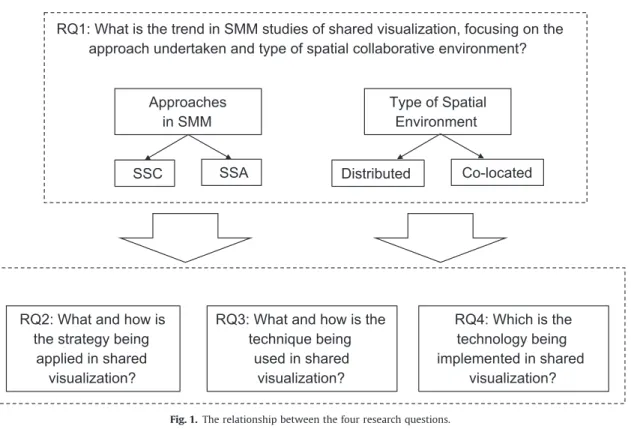
RQ1: What is the trend in SMM studies of shared visualization, focusing on two types of spatial colla-borative environment approaches, socially shared cog-nition (SSC) and shared situation awareness (SSA)? RQ2: What and how is the strategy being applied in shared visualization? RQ3: What and how is the technique being used in shared visualization? RQ4: What is the technology being implemented in shared visualization?Fig. 1 gives an overview of how the four research questions link to one another to give a comprehensive view of the review topic.
3.2. Searching strategy
In this study, specific keywords were used to search for the relevant literature. Although the term“shared visual repre-sentation”had been used above, the term“shared visualisa-tion” was preferred in the literature search as it is more specific than“shared visual representation”, which may refer to any visual representation that can potentially be shared. Although there has been a considerable amount of cognitive and design research on shared visualisation, there is also a long list of shared cognition research in the fields of group cognition and collaborative design. The term“shared visuali-sation”is therefore used in this review to refer to a particular visualisation that is explicitly designed for sharing information.
3.2.1. Search terms
Databases were searched using the search string con-structed from these keywords:
(Shared visualisation AND (shared mental model OR shared cognition))
If this search produced no hits, the terms “shared mental model”and“shared cognition”were removed from the search string.
3.2.2. Library databases
To encompass a broad set of relevant papers, the search covered popular databases in the field:
1. Science Direct.2
2. ACM Digital Library.3
3. IEEE Explore Digital Library.4
4. ISI Web of Knowledge.5
5. Scopus Online.6
6. Taylor and Francis Online.7 7. Springer Link.8
These digital libraries were selected for their compat-ibility with the Endnotes bibliographic tool [30]. These selections of digital libraries or electronic databases are also driven by factors such their popularity, frequency of actualization, facilities to run complex queries or the number of works indexed[60]. Moreover, they were also chosen as they provide the most important and with highest impact full-text journals and conference proceed-ings. The numbers of initial hits for the various search strings used are presented inTable 1.
3.2.3. Study selection
The inclusion and exclusion criteria used are described in this section.
Inclusion criteria—The initial hits are filtered according to the inclusion criteria as follows:
Publication date: between 2000 and 2013 inclusive. Research domain: science technology or computer science. Publication type: journals, proceedings and transactions. Article type: full text and reviews. Subject: directly addresses one or more of the research questions. Language: English.Exclusion criteria—This review focuses on strategies, tech-niques and technological implementation of shared visuali-sation for SMMs, so the following papers are excluded:
Papers under five pages in length. Papers drawn from workshops, presentations, opinions and viewpoints. Redundant papers. Replication studies.The Endnotes version X4 was used to detect and eliminate redundant papers. When similar studies with different first authors were found, only papers that were most recent, general and relevant to the research ques-tions were included. The search strategy and results are shown inFig. 2.
RQ1: What is the trend in SMM studies of shared visualization, focusing on the
approach undertaken and type of spatial collaborative environment?
Approaches
in SMM
Type of Spatial
Environment
SSC
SSA
Distributed
Co-located
RQ2: What and how is
the strategy being
applied in shared
visualization?
RQ3: What and how is the
technique being
used in shared
visualization?
RQ4: Which is the
technology being
implemented in shared
visualization?
Fig. 1.The relationship between the four research questions.
2〈 http://www.sciencedirect.com/〉. 3〈 http://dl.acm.org/dl.cfm〉. 4〈 http://ieeexplore.ieee.org/Xplore/home.jsp〉. 5〈http://apps.webofknowledge.com/UA_GeneralSearch_input.do?
product=UA&search_mode=GeneralSearch&SID=R2ZP9MMddFqMHl9m 4vk&preferencesSaved=〉.
6
〈http://www.scopus.com/source/browse.url? zone=TopNavBar&origin=searchbasic〉.
7〈
http://www.tandfonline.com/〉. 8〈
3.3. Papers and data extraction process
Publications were extracted using the Endnotes version X4, which can automatically document references for each paper. Kitchenham and Charters[34]do not provide very clear guidelines on the process of data extraction. We opted to use the Adobes Readers XI version 10.0.5 for data extraction. Papers were analysed using the“Find”tool and data were extracted on the basis of keywords such as
“visual”and“visualisation”. Following this, the Microsoft
Excel version 7 was used for data entry and coding; the data were classified by system name, year, research field, key features, methodology, type of spatial environment, descriptions of strategy, techniques and technological implementation. The Microsoft Excel’s “AutoFilter” was used to filter subsets of data based on this classification.
The results of this analysis are presented in the next section.
4. Results and analysis
A total of 15 studies discussed strategies and techniques of shared visualisation for shared cognition. Citations for these 15 papers were sorted in ascending order of pub-lication date and are included in Appendix A. A short overview of the studies is given before the detailed presentation of results relating to each research question.
4.1. Categorisation of investigated papers
The investigated papers were categorised according to two types of research [52]. Experimental reports and evaluation paper were included in the category of“ devel-opment and evaluation papers”. Philosophical papers and solution proposals were also considered as a single cate-gory. This classification resulted in the following categories:
Solution proposal paper: report of findings based on the theoretical studies, experimental research or other related work.Table 1
Initial search results for seven databases using the search string. Digital Database
Libraries
Keywords and hits
(Shared visualization AND shared mental model)
(Shared visualization AND shared cognition) (Shared visualization) Collective papers Science Direct 5 1 6
ACM digital library 3 0 3
IEEEXplore 0 0 5 5 ISI 0 0 1 1 Scopus 0 0 5 5 InformaWorld 1 0 1 Springer Link 0 1 1 Total N¼22
Fig. 2.Flow of searching and extraction strategy.
Solution
proposal
40 %
Development and
evaluation
60%
Fig. 3. Classification of inspected publications according to type of research. Year of Publication No. of Publications 0 1 2 3 4 5 2000 - 2002 2003 - 2005 2006 - 2008 2009 - 2011 2012 - 2013 SSC SSA
Fig. 3shows that of 15 papers, 40% are solution proposal papers and 60% are development and evaluation papers.
These papers were investigated with reference to the strategies and techniques of shared visualisation. The following sections consider the specific research questions in more detail.
4.2. Research question 1
RQ1: What is the trend in SMM studies of shared visualisation, focusing on the approach undertaken and type of spatial collaborative environment?
4.2.1. Comparison of SSC and SSA approaches
The inspected papers were published between 2000 and 2013.Fig. 4shows that over this 13-year period, there was an increase in publications focusing on SSA approaches to shared visualisation whilst the use of the SSC approach showed no consistent trend. The increase in SSA research may reflect a growing interest in SSA con-cerning shared visualisation research. This is due to an increasing demand for systems and tools to support decision making in critical situations and judgement under uncertainty[5,6,8,20,27,36,64].
Between 2006 and 2008, the number of SSC studies decreased; a possible reason was that researchers had chan-ged their focus to other areas such as collaborative design, collaborative learning and knowledge management. Examples of these studies are those by[1,22,24,25,40,41,47,57].
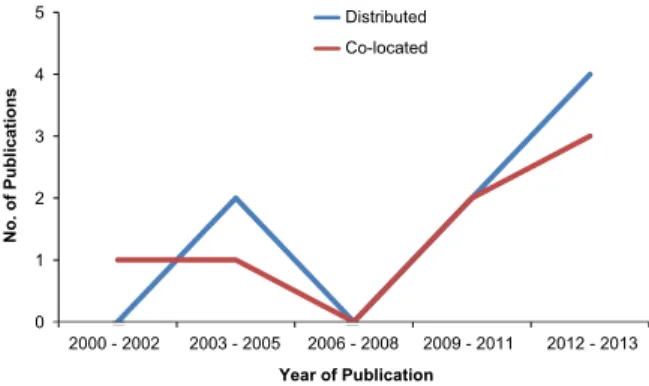
4.2.2. Distributed and co-located environments
Fig. 5shows the trend in research on distributed and co-located environments. There was a continuous growth in research on both types of spatial collaborative environ-ments. However,Fig. 5shows that there was slightly more interest in distributed environments between 2006 and 2008, e.g.[1,6,20,22,36,40,47,64]. This was potentially due to the expansion of cloud computing services led by giant corporations such as Google TM and Microsoft TM that
operate large data centres for public clouds[59].
Similarly, there was also a steady growth in research on co-located environments; for example, studies by
[5,8,24,25,27,41,57]. The requirement for seamless inter-action and integration across hardware devices was the likely key factor for research in this field. Research into both types of spatial environments has expanded and prospects for future research are promising.
4.3. Research question 2
RQ2: How are visualisation strategies applied in shared visualisation?
In this context, “visualisation strategy” refers to the methods used to achieve a shared mental model for users. Our analysis identified five types of visualisation strategies, which are presented below.
4.3.1. Shared visualisation
Shared visualisation is a type of visualisation strategy used to visualise content, activity (e.g. a work process) or artefacts for multiple users. It can be used to increase team cohesiveness by providing unambiguous information to support a shared mental model [56]. It helps co-located working groups to communicate more effectively by externalising the communication process[19].
The use of a shared visualisation strategy has been demonstrated by [20,25,47,64]. In PhoneChannel, [25]
combined asymmetric visual data with symmetric audio data, which allowed PhoneChannel’s users to access the Internet on a digital-cable subscriber’s television as long as the two are connected; the TV user could view the data sent on a designated channel. The Remote Presentation System[47]used a special tool called IVISOR to provide visualisation functions for flow data fields such as stream-lining, particle tracing, contour lines, surface layer render-ing, and creating animations that can be used in the shared virtual world. CIVIL [64] used maps as a medium for visualising a work process in order to enhance the aware-ness and sense-making abilities of groups. KIA[20] devel-oped activity visualisation to aid information sharing, sense-making and decision-making in small emergency management teams consisting of domain experts.
4.3.2. Shared coordination
Shared coordination is a visualisation strategy used to coordinate two or more elements in shared visualisation for multiple users. It can be used to support implicit coordination, which is necessary for a team developing a shared mental model to improve task performance and enable interaction across social transparencies needed in a virtual collaborative work system[38,55].
The use of a shared coordination strategy has been demonstrated by[6,20,24,40,64].
In Telling Calls,[24]implemented negotiated interac-tion commitment; this is a specific kind of coordinainterac-tion where two parties establish a shared understanding, which enables conversational engagement. Telling Calls was designed to allow both caller and receiver to review information sent or received, to provide common ground for coordination or reengagement; a call history feature was developed to store information sent or received in the same visualisation. In the Remote Collaborative System,[6] Year of Publication No. of Publications 0 1 2 3 4 5 2000 - 2002 2003 - 2005 2006 - 2008 2009 - 2011 2012 - 2013 Distributed Co-located
used visualisation of shared annotations and hypotheses to overcome coordination costs and cognitive biases.
KIA[20] provided two coordination strategies based on verbal and nonverbal feedback as well as directory updating. Verbal or nonverbal feedback was used to support coordina-tion of content and process in communicacoordina-tions, whilst directory updating was used to support information alloca-tion and retrieval coordinaalloca-tion to improve team perfor-mance. Both coordination strategies aimed to establish common ground and transactive memory system dimen-sions. GeoVE[40]supported coordination of perspectives, in particular cases of conflict using split screen views. In other words, GeoVE enabled users to understand what others were doing and used voice communication to discuss perspectives in a remote collaboration. CIVIL[64]used coordinated maps and activity visualisation to aid decision-making as well as improve group activity awareness.
4.3.3. Shared multiple representation
Shared multiple representation is a visualisation strat-egy used to provide two or more coordinated representa-tions in the form of a visualisation to multiple users. It can be used to support complex decision-making and analy-tical reasoning[12,16].
Shared multiple representation strategies have been demonstrated by[1,20,22,27,41,64].
Co-ENV[22]used integrated multiple collaborative func-tionality. A multidimensional viewpoint encompassing three collaborative tasks—job, team and cognitive performance enabled a design team to specify co-design activities and quantify each aspect of the collaboration. BEM[41]removed decoupled work and placed it in private views on mobile devices such as smart phones or tablets, so that the collaborative view could be used exclusively for shared work. This allowed users to make a clear distinction between coupled and decoupled activity. The developers were able to address real-estate constraints related to managing private views on a shared display, and alleviate concerns about combining multiple private views in a shared view.
VizCept,[27]used a visual analytical tool called Jigsaw to provide multiple views to illustrate connections between automatically generated entities in multiple documents. This tool enabled interoperable views and changes in one view were seamlessly reflected in the other views. The multiple views feature allowed the user to explore connections between entities and documents within a data set. Haeyong and colleagues also designed the SIMILE timeline widget[27]. This tool visualises concepts as events on a timeline, with the document that connects them to the associated timepoint. Concepts that are associated with multiple documents appear in multiple locations in the visualisation. The SIMILE timeline widget also supported various collaborative features such as colour coding of concepts according to the user who identified them, along with variable thicknesses and labels for edges in the global concept map to express different users’interest in a particular semantic relationship. VizCept was also designed to allow multiple simultaneous messages and requests to be processed seamlessly without significant delay. Concepts, relationships and notes are sent back to the server, where they are combined to create a unified data source that is available to all users of the various views.
KIA [20] was a collaborative integration tool that supported collaborative learning using multiple external representations to enable simultaneous consideration of both individual and collaborative processes. Learners could assign multiple representations independent of one another, and the collaborative integration tool visualised knowledge awareness information for each learner. The tool displayed corresponding assignments for learners side-by-side and visualised information about group knowledge, such as which part of the learning material was covered by at least one group member.
CIVIL[64]used a multi-view and role-based approach to support personal and shared activities. This system used distinct views for role-specific and shared information to help team members selectively share role-specific or unique con-tent with teammates. The system was able to limit the cognitive load on a team member whilst also offering a personal space for analyses. The personal (role-specific) and shared (team) map views served different purposes. The personal map view displayed role-specific information and allowed individuals to analyse data privately and explore various options before deciding what information and knowl-edge to share with others. At team level, using different role-specific views at the same time enabled multiple team members to explore and analyse data in parallel, making collaboration more efficient. The team (shared) map, the view common to all team members, was used to display shared information and examine general relevant objects collectively. Information from personal (role-specific) workspaces could be transferred to the shared space, i.e. there was capacity to transfer information from role-specific maps to shared maps. DIIII-D, [1] was a centralised gateway for multiple software services, which provided researchers with a unified interface for multiple functions including experi-ment status monitoring, data analysis and communication needed during fusion experiments. The system offered a presentation tier that did not execute complex computa-tions but simply filtered and displayed visual data in accordance with user requests. Multiple synchronous pre-sentation methods were supported.
4.3.4. Shared mirroring display
Shared mirroring display is a visualisation strategy used to facilitate reflection by informing users what each member of the group has done. It provides an unbiased, third person, real-time visual perspective for multiple users. Shared mirroring display can be used to support computer-mediated collaboration and learning[18], sup-port interaction regulation in collaborative problem sol-ving[32]and small group collaboration[50].
Shared mirroring has been demonstrated by [5,8]. Reflect[5]used basic representations to display to users the actions they had taken, i.e. the amount of speech they had produced, without offering either advice or interpre-tation of the state of the interaction. The mirroring strategy was used simply to show users the current state of the conversation; it was up to them to decide what needed to be done. The system did not provide any judgment of the interaction, nor was it meant actively to promote a more balanced collaboration.
Conversation Clock[8]used visualisation for an ongoing conversation in a shared surface. The Conversation Clock showed which member of the group was speaking at any given time and allowed users to access a snapshot of the conversation history every time they looked at the surface. The social mirror developed by [8] introduced group dynamics and social computing into research on real-time visualisations. This pilot study showed that some people accepted some significantly distorted visualisation as an accurate representation of conversation.
4.3.5. Shared boundary objects
Shared boundary objects is a visualisation strategy used to enable integration of knowledge across boundaries for multiple users. It can be used to support creativity in a distributed collaborative design process involving groups
belonging to different Communities of Practices[65]and to achieve shared understanding through negotiation in heterogeneous problem solving [35]. Ref. [40] used the-ories of boundary objects to develop a framework in which visual representation mediated group work. In GeoVE, visual displays for geocollaboration fulfilled several functions:
Shared objects to talk about: to depict selected information, provide geo context, and enable information integration; Shared objects to think with: to develop, clarify and support structuring of arguments; Shared objects to coordinate perspectives and actions: to compare perspectives, related participants’ knowl-edge domains, link perspectives across scales and enable joint activity.Table 2
Types of visualisation strategy, systems and their strategic descriptions. Types of visualization strategies
Shared visualization:a visualization strategy used to visualize content, activity (i.e. work process) or artifacts to multiple users. Author
(s)
System Examples Description
[25] Phone Channel - Audio-visual is shared among users
[47] Remote Presentation System
- Interactive visual interface of 3D are visualized and shared
[64] CIVIL - Work process and artefacts are visualized and shared.
[20] KIA - Activity is visualized and shared
Shared coordination:It is a type of visualization strategy undertaken by researcher to coordinate two or more elements in a shared form of visualization to multiple users.
[64] CIVIL - Maps and activity visualization are coordinated to aid decision-making and group activity awareness.
[24] Telling Calls - Negotiating interaction commitment is applied to allow conversation engagement
[6] Remote Collaborative System
- Visualizing annotations and hypotheses sharing are coordinated to overcome coordination costs and cognitive biases.
[20] KIA - The KIA contains two following features:
(1) grounding by verbal or nonverbal feedback is used to support coordination of content and process in communication
(2) directory updating is used to support information allocation and retrieval coordination
[40] GeoVE - Split screen views are used to support coordination of perspectives in cases of conflict
Shared multiple representations:It is a type of visualization strategy undertaken by researcher to provide two or more coordinated representations in a form of visualization to multiple users.
[22] Co-ENV - A multiple viewpoint to enable the identification and class of co-design activities
[41] BEM - Users are allowed to make a clear distinction between coupled and decoupled activity; able to address real-estate constraints relating to use of private views on a shared display, and alleviate concerns about combining multiple private views in a shared view and quantifying each aspect of the collaboration
[27] VizCept - The VizCept contains three following features:
(1) Jigsaw allows multiple users to explore connections between entities and documents within the data set. (2) SIMILE timeline widget allows concepts that are associated with the multiple documents to be appeared in
multiple locations in the visualization
(3) Multiple simultaneous messages and requests are being processed seamlessly
[20] KIA - A collaborative integration tool that supports collaborative learning with multiple external representations which provides a simultaneous consideration of both individual and collaborative processes.
[64] CIVIL - Multi-view and role-based design to support personal and shared activities
[1] DIIII-D - Multiple software services to provide researchers with a unified interface which can be supported synchronously. Shared mirroring display:a visualization strategy used to provide an unbiased and third person, real-time perspective on visual information for
multiple users.
[5] Reflect - It is used to simply show the users a reflection of their current state of the conversation, and allows no judgment to the quality of the interaction.
[8] Conversation Clock - It allows the users to get a snapshot of the conversation history every time it is projected onto some shared surface. Shared boundary objects:a visualization strategy used to enable integration of knowledge across boundaries for multiple users.
[41] GeoVE Maps and components of maps serve as external representations of boundary objects and the visual representation provides a medium for group work. The visual displays for geocollaboration fulfil functions as shared objects to talk about, shared objects to think with and shared objects to coordinate perspectives and actions
These visual representations of geospatial information provided a display space where team members could share and integrate information, compare perspectives and negotiate approaches and solutions to problems. Maps and components of maps served as effective external representations of boundary objects. Table 2 provides a brief descriptive summary of visualisation strategies and systems.
4.4. Research question 3
RQ3: What and how is the visualisation technique used in shared visualisation?
In this context, a visualisation technique refers to visualisation tools used to provide shared visualisation in order to achieve a shared mental model among users. Our analysis of the reviewed studies identified four types of visualisation techniques.
4.4.1. Collaborative annotation
Collaborative annotation is the practice and method of creating and managing metadata collaboratively to anno-tate and categorise content; it is a feature of many Web 2.0 services where it is also known as “social tagging” [33]. It can be used to support collaborative analysis of digital video in distributed groups [49], open-ended discourse with transparent groupware[42]or merely used to share, classify and elaborate documents[37].
In this study, we explore collaborative annotation strategies used by[22,57,64].
CO-ENV[22]used annotation in the collaborative phase of an advanced conceptual design task to support evalua-tion of individual contribuevalua-tions of the design team and decisions about future work. Users could be supported bidirectionally and actively with collaborative meeting tools.
MATRICS [57]applied the shared annotations techni-que in a virtual environment that allowed direct interac-tion with remote 3D objects within the virtual model, knowledge integration and management in design tasks and collaboration or cooperation around the objects. The 3D annotation options could be used to provide a con-textualised comment in the 3D space.
CIVIL [64]developed three types of annotation tools: annotation sorting table, annotation aggregation chart and annotation timelines chart. These annotation tools were used to cluster and aggregate information. Users could integrate relevant information from different sources as well as cluster and aggregate inputs from individuals, in order to review and analyse information.
4.4.2. Collaborative concept mapping
Concept mapping is a technique developed in the 1960s by Professor J.D. Novak from Cornell University to repre-sent knowledge graphically. In concept mapping, a graph consists of a number of nodes and links. The nodes represent concepts and the links represent the relation-ships among the different concepts[46]. Concept mapping has been used in knowledge representation as well as teaching and learning applications due to its effectiveness in externalising thoughts in the form of concepts and
relationships. In this context, collaborative concept map-ping can be described as a technical process in which two or more users engage in collaborative or developmental activities where knowledge is represented as graphs, nodes and links in a shared visualisation.
Collaborative concept mapping has proven its ability to support learning [54], construction of group memories Hoppe, Ganer[29]and management of conflict[14].
In this study, we describe studies of collaborative concept mapping by[20,27].
VizCept[27]applied concept mapping in one of three views available in the system, the concept map view. The concept map view displayed the union of all the concepts and relationships that individual users had discovered in personal workspaces. In this shared view, users could keep track of concepts added by other users and progressively make connections between them to make sense of the relationships. The nodes in the visualisation represented entities such as names, locations, objects and concepts; relationships were represented as directed edges labelled descriptively. The node colour indicated which user had originated the concept. Multiple relationships between pairs of entities could be represented: edge thickness was increased when multiple relationships were added to the same concept pair by different analysts. The concept map view allowed analysts to share the visualisation among themselves; it helped to generate new insights and hypotheses by tracking valuable information and could also be used to help reach a conclusion. Various interaction methods, such as panning and zooming, and manual or automatic reorganisation of the layout of the map, were supported by the concept map view to help analysts explore the visualisation.
In KIA,[20] used digital concept maps together with
[15], which were advanced digital concept mapping tools developed by the Florida Institute of Human and Machine Cognition (USA); these tools represent the underlying conceptual knowledge for each medium and allow direct interactive access to specific information. This digital concept mapping tool promotes knowledge and informa-tion awareness by allowing participants to create personal digital concept maps containing personal domain knowl-edge and personal information resources associated with this knowledge. This tool provides a group member with the information about the knowledge structures of other collaborators and the information resources underlying these knowledge structures.
In the KIA application, the collaborating partners’digital concept maps were arranged next to one another so that participants could compare the knowledge structures of their collaborators. Since their personal digital concept map was also included in the arrangement, it was easy to compare personal knowledge with the knowledge struc-tures of others. Concept maps are well suited to support such comparisons because there are very strict rules gov-erning the creation of a concept map; for example, nodes represent the concepts and links between the relationships.
4.4.3. Collaborative discussion board
Discussion board is a term used to describe a centre for readers to focus upon the users of information. Nowadays
a discussion board is used primarily as a forum for communicating with members of a group or an online community, or to seek assistance and support from such a group or online community [28]. An online discussion board or online threaded discussion board is characterised by asynchronous interaction in which multiple users achieve their consensual group responses. Collaborative discussion boards can be used to support distance learning and education for people with disabilities[44]and virtual collaborative research communities[53].
In this study, we look at collaborative discussion applications developed by[6,20,64].
The Remote Collaborative System [6] used flagged discussion as a visualisation technique to help individuals to spot anomalies and perceive patterns, increase the efficiency of information retrieval tasks and data analysis, promote feelings of community and foster discussion.
KIA[20]used group discussion to enable the exchange of unshared information intended for collaborative pro-blem solving among group members. In KIA, the recogni-tion of unshared informarecogni-tion is important because of the close arrangement of the collaborators’concept maps and the opportunity this offers for comparison. Using the group discussion technique to exchange information can help group members determine whether information has been shared among group members, which affects the coordinated sampling of information.
CIVIL [64] used a chat tool to support knowledge sharing. The chat tool was seen as useful for discussion and clarification, comparison and analysis, and getting a rapid response. Users could express personal perspectives or opinions, and these were related to objects on maps. The chat tool was also able to make individual information reviewable for future discussions; users could record information, take notes on ideas, compare the advantages and disadvantages of specific options in discussions and add comments on spatial objects.
4.4.4. Collaborative geographical map
A geographical map can be defined as an image of an area that represents features of the landscape such as cities and roads. A collaborative geographical map can be defined as a technique of visual representation that allows multiple users to collaborate, develop or engage in activities related to the representation of knowledge as an image that depicts the features of a landscape. Collaborative geographical map can be used to support exploration and interpretation in visual data mapping[43].
In this study, we look at studies of collaborative geographical map by[41,64]as well as[40].
In BEM, [41] applied geographical maps in a shared visual representation called BEMViewer. BEMViewer is a tool for collaborative visual search that can be panned and zoomed on desktop displays and tablets using multi-touch gestures such as pinch and drag. Data visualised on the BEMViewer is represented as a multidimensional dataset in which two of the dimensions specify geospatial position using longitude and latitude. These dimensions are used to plot each item in the dataset on the map.
CIVIL[64]used geographical maps to explore and focus on geographic locations to develop a good emergency
management plan. The data exploration activities, which could be conducted using the maps, were an effective means of organising geospatial data to support bottom-up, i.e. data-driven activities. Users could coordinate team activities using multiple, role-based views in which each group member used two maps for data exploration. One map was used for personal analysis of role-specific data and the other map was a shared map used by the team to share information and build a group plan.
GeoVE [40] used geographical maps as part of a distributed map-based data exploration and analysis sys-tem designed to support representation and analysis of participants and their actions. The distributed map-based data exploration and analysis system was designed to track the use of a multi-window geo-visualisation display, including for example a map, scatter plot and parallel coordinate plot, used in knowledge construction activities. The distributed map-based system supported four types of collaborative knowledge construction: collaborative explo-ration (brainstorming), collaborative analysis (mediation), collaborative synthesis (e.g. the development of a common perspective) and collaborative representation (e.g. repre-sentation of temporal and spatial information).
Table 3provides a brief summary of visualisation techni-ques and systems along with their technical implementation.
4.5. Research question 4
RQ4: Which technology is used in shared visualisation? In this context, the technology is the system applications and technologies used to design and develop the model, framework or systems of shared visualisation. We found that most reports did not provide details of specific technological implementation, e.g. MATRICS [57], Remote Presentation System[47], GeoVE[40], Phone Channel[25]. This limitation made analysis of this aspect of shared visualisation research problematic. Some reports did not provide a technological description because of their methodological approach and presentation; these include research using structured meth-ods, e.g. CO-ENV[22], BEM[41], Reflect[5], and KIA[20]; and experimental studies, e.g. Conversation Clock[8], and Remote Collaborative System[6]. In the remaining papers, the tech-nological implementation was either well described or could be determined indirectly; these studies are focused on in this section. We identified two kinds of technological implementation.
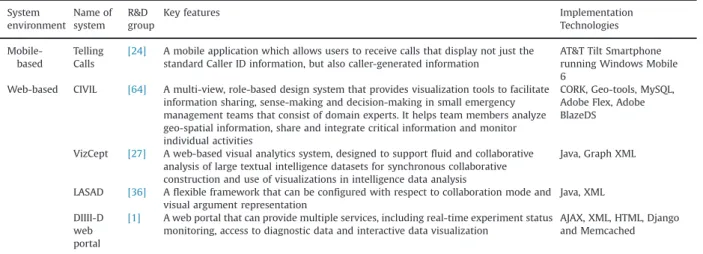
4.5.1. Mobile-based application system
Few researchers implemented shared visualisation in a mobile-based application environment. Studies that did use a mobile environment include Phone Channel[25]and Telling Calls[24]. The technological implementation was reported only for the Telling Calls project[24], which used the AT&T Tilt Smartphone running Windows Mobile 6.
4.5.2. Web-based application systems
Most of the shared visualisations were designed and developed with web-based tools or systems. We found four papers in which a well-defined technological description is available:[1,27,36,64]. The technological implementation of these systems is presented below.
In VizCept, an interactive concept map is implemented as a Java Applet using the Prefuse toolkit; data exchange between the client and the server is supported using files in the Java Script Object Notation (JSON) format. The concept map view supports various interaction methods, including panning, zooming, and node drag and drop from the VizCept’s backend server in a real-time environment, so the underlying data for concept maps are communi-cated using GraphML and XML. GraphML is used to support special graph features such as coloured nodes and variable edge thicknesses. Finally, SIMILE and the timeline visualisation are implemented with JavaScript API. When the timeline view is refreshed, it contacts the server, which generates an XML file based on the current state of the system. Filtering and highlighting of events is done on the client side by reading the Document Object Model object and updating it from events in the timeline. CIVIL was developed using Java to support a more broadly distributed collaboration. CIVIL used two tools: the CORK and Geo-tools. CORK, which stands for content object replication kit, can support the replication and
manipulation of shared objects in synchronous and asyn-chronous collaboration. Geo-tools were used in CIVIL for the organisation and manipulation of geospatial data, which are available at (http://www.geotools.org/). The maps in CIVIL were developed with GeoTools, an open-source Java library for the organisation and manipulation of geospatial data. The storage layer at the bottom has a MySQL server to store user action and session data and a file server to store other data, such as recorded audio in collaboration sessions. The client side used a web-based, rich Internet application (RIA) developed with Adobe Flex. The synchronisation and audio and video modules in the application server were built in Adobe BlazeDS; mean-while, other server modules were developed with Java running on a Tomcat Web server. CIVIL was also imple-mented on a cloud-computing service using Google Maps as the external map service.
LASAD was developed using Java, and the web-based communication interfaces were implemented using Java Remote Method Invocation to support different kinds of cooperation in the server layer. XML definition was used to
Table 3
Types of visualization techniques and systems and their technical implementation. Types of visualization technique
Collaborative annotation:a visualization technique that allow multiple users to annotate and categorise content collaboratively by creating and managing metadata
Author (s)
System examples Description
[22] CO-ENV Annotation is used in the collaborative phase of an advanced conceptual design task to support evaluation of individual work within the design team and decisions about future work
[57] MATRICS Annotation is used in a virtual environment that supports use of 3D annotation options to provide contextualized comments in the 3D space
[64] CIVIL Annotation is implemented as annotation sorting tables, annotation aggregation charts and annotation timelines charts to cluster and aggregate information
Collaborative concept mapping:a visualization technique that allow multiple users to collaborate, develop or engage in activities related to representation of knowledge as graphs, nodes and links.
[27] VizCept Concept mapping is applied in the Concept map view which displays the union of all the concepts and relationships that users have discovered in personal workspaces. Using Concept map view analysts can share the visualization among themselves in order to generate new insights and hypotheses, track valuable information, and to help reach a conclusion
[20] KIA Concept mapping is implemented as a digital concept map realized withCmap Tools. The Cmap Tool provides group members with the knowledge structures of other collaborators and the information resources underlying these knowledge structures. The collaboration partners’digital concept maps are arranged next to each other enabling partners to compare the knowledge structures of their collaborators
Collaborative discussion board:a visualization technique that allows multiple users to communicate with members of a group or an online community, or to seek assistance and support such a group or online community, in an asynchronous interaction
[6] Remote collaborative system
Flagged discussion is used to help individual’s spot anomalies and perceive patterns, increase the efficiency of information retrieval tasks and data analysis, promote feelings of community and foster discussion
[20] KIA Group discussion is used to exchange the unshared information intended for collaborative problem solving among group members
[64] CIVIL A chat tool is used to support the knowledge-sharing process. The chat tool was seen as useful for discussion and clarification, comparison and analysis, and getting a rapid response
Collaborative geographical map:a visualization technique that allows multiple users to collaborate, develop or engage in activities related to representation of knowledge as an image that depicts the features of the landscape
[41] BEM Geographical maps are used in a collaborative visual search tool called BEMViewer which can be panned and zoomed on desktop displays and tablets using multi-touch gestures such as pinch and drag
[64] CIVIL Geographical map is used to explore and focus on geographic locations to support bottom-up data-driven activities. Users can coordinate team activities using multiple, role-based views; each group member uses two maps for data exploration
[40] GeoVE Geographical maps are used in a distributed map-based data exploration and analysis system designed to support representation and analysis of participants and their actions. The system supports four kinds of collaborative knowledge construction: collaborative exploration (brainstorming), collaborative analysis (mediation), collaborative synthesis e.g. the development of a common perspective and collaborative representation e.g. representation of temporal and spatial information
specify the configuration of ontology elements in the LASAD system.
DIIII-D web portal was developed using AJAX technology to support efficient observation and server-side recording of all changes made on the client side. In addition, it also supported multiple presentation methods in synchronous operation. In the presentation layer, requests sent to the logic tier were described using HTTP/HTTPS requests. The Logic tier was implemented using Django, a python-based web framework. The web portal was developed using Memc-ached, a high performance, distributed memory object caching system that can speed up dynamic web applications by alleviating database load.
Table 4summarises the mobile-based and web-based shared visualisation systems.
5. Research implications
This section describes the implications of our analysis in terms of the four specific research questions. The identifica-tion of different visualisaidentifica-tion strategies and techniques for shared visualisation applications has implications for the design shared visualisation-based systems. We identified three kinds of support provided by shared visualisation applications and provide guidelines for future researchers seeking to design shared visualisations systems.
5.1. Three kinds of support in shared visualisation: Social, task and cognitive
All the strategies and techniques identified were cap-able of providing three types of support: social, task and cognitive. Interestingly, projects that used multiple strate-gies and techniques were able to provide all the three kinds of support, e.g. KIA[20], CIVIL[64]and GeoVE[40]. On the other hand, projects that used a single strategy or technique offered only one kind of support, e.g. MATRICS
[57], Remote Presentation System[47], Conversation Clock
[8]and DIIII-D web portal[1]. Other projects that utilised one strategy and one technique, e.g. CO-ENV [22], and VizCept [27] offered two kinds of support, a somewhat
surprising finding. However, these findings warrant addi-tional research and confirmation of their possible implica-tions for the design of shared visualisation-based systems.
Table 5 shows the kinds of support provided by the systems.
5.2. Guidelines for designing shared visualisation-based systems
This review is intended to provide guidelines for future researchers seeking to design shared visualisations.Figs. 6
and7show the strategies and techniques that can be used in socially shared cognitive systems and shared situation awareness systems.
Based on the projects reviewed in this study, some guidelines are proposed for the development of strategies for shared visualisation, which may be beneficial to researchers interested in shared visualisations used in system design and development. These include guidelines on multiple views[7], multiple representation[2], bound-ary objects[21]and cognitive perspectives on annotation
[13].
Table 6 provides a brief summary of the strategies, techniques and technologies applied in the fifteen systems we investigated.
6. Conclusion
This paper has presented a systematic review of shared visualisation that investigates strategies and techniques in shared visualisation to achieve common ground or shared cognition. The aim is to identify the implications of different visualisation strategies and techniques of shared visualisation applications together with how they can be applied in designing CoVis systems.
In achieving common ground among the design team members, five visualisation strategies applied in CoVis systems have been identified: shared visualisation, shared coordination, shared multiple representations, shared mir-roring displays and shared boundary objects. These stra-tegies represent the ways that have been implemented by
Table 4
Summary of technological implementation in mobile-based and web-based systems. System environment Name of system R&D group
Key features Implementation
Technologies
Mobile-based
Telling Calls
[24] A mobile application which allows users to receive calls that display not just the standard Caller ID information, but also caller-generated information
AT&T Tilt Smartphone running Windows Mobile 6
Web-based CIVIL [64] A multi-view, role-based design system that provides visualization tools to facilitate information sharing, sense-making and decision-making in small emergency management teams that consist of domain experts. It helps team members analyze geo-spatial information, share and integrate critical information and monitor individual activities
CORK, Geo-tools, MySQL, Adobe Flex, Adobe BlazeDS
VizCept [27] A web-based visual analytics system, designed to support fluid and collaborative analysis of large textual intelligence datasets for synchronous collaborative construction and use of visualizations in intelligence data analysis
Java, Graph XML
LASAD [36] A flexible framework that can be configured with respect to collaboration mode and visual argument representation
Java, XML DIIII-D
web portal
[1] A web portal that can provide multiple services, including real-time experiment status monitoring, access to diagnostic data and interactive data visualization
AJAX, XML, HTML, Django and Memcached
Table 5
Social, task and cognitive support in shared visualization. Nos. Project and
Researchers
RQ2 RQ3 Three kinds of
support
Cognitive
Strategies Techniques Social Task
1 CO-ENV[22] Shared multiple representations Collaborative annotation No Yes Yes 2 BEM[41] Shared multiple representations Collaborative geographical map No Yes No
3 Reflect[5] Shared mirroring display None No Yes Yes
4 VizCept[27] Shared multiple representations Collaborative concept mapping Yes Yes No
5 MATRICS[57] None Collaborative annotation No Yes No
6 A Remote Presentation System[47]
Shared visualization None No Yes No
7 Telling Calls[24] Shared coordination None Yes Yes No
8 A Remote Collaborative System[6]
Shared coordination Collaborative discussion board Yes Yes Yes
9 Phone Channel
[25]
Shared visualization None Yes Yes Yes
10 LASAD-[36] None None No Yes No
11 KIA[20] Shared visualization, Shared coordination, Shared multiple representations
Collaborative concept mapping, Collaborative discussion board
Yes Yes Yes
12 Conversation Clock
[8]
Shared mirroring display None Yes No No
13 CIVIL[64] Shared visualization, Shared coordination, Shared multiple representations
Collaborative annotation, Collaborative discussion board, Collaborative geographical map
Yes Yes Yes
14 GeoVE[40] Shared coordination, Shared boundary objects
Collaborative geographical map Yes Yes Yes 15 DIIII-D web portal
[1]
Shared multiple representations None No Yes No
Distributed Co-located SBO SC SMR SV CA CGM Legend: SV = Shared Visualization SC= Shared Coordination
SMR = Shared Multiple Representation SMD = Shared Mirroring Display SBO = Shared Boundary Objects CA = Collaborative Annotation CCM = Collaborative Concept Mapping CDB = Collaborative Discussion Board CGM = Collaborative Geographical Map
Fig. 6. Socially shared cognitive systems: strategies and techniques.
Distributed Co-located SMR CCM SMD SC SV CA CDB CGM Legend: SV = Shared Visualization SC= Shared Coordination
SMR = Shared Multiple Representation SMD = Shared Mirroring Display SBO = Shared Boundary Objects CA = Collaborative Annotation CCM = Collaborative Concept Mapping CDB = Collaborative Discussion Board CGM = Collaborative Geographical Map
researchers in order to process data sharing and knowl-edge to arrive at the desired level of understanding. However, further studies are needed to investigate how these strategies can be effective to support CoVis with a visualisation system pertaining to the three levels of engagement teams in viewing, interacting/exploring and sharing/creating as per outlined by Isenberg et al.[31]. In this paper, viewing is described as engagement level in which a system or tool can “support a group of people viewing static or animated visualizations of data without being able to interact with or annotate the information”.
Exploring is a level of engagement when“groups of people share the same interactive visualization software, either in co-located or distributed settings, and sharing/creating is an emerging trend of user generated content sites for visualization where many people are able to create, upload, and share new datasets and visualizations” ([31]
pp. 312). Another research that deserves consideration and would be useful is investigating the use of these five visualisation strategies to enhance the capabilities of distributed and collaborative visualization in the CoVis. According to Brodlie, Duce, Gallop, Walton and Wood[10],
Table 6
Summary of strategies, techniques and technologies.
Nos. System Researchers Year Categories of paper RQ1 RQ2 RQ3 RQ4 Approaches Spatial
environment
Strategies Techniques Technologies
1 CO-ENV [22] 2012 Developmentþevaluation SSC Distributed Shared multiple representations
Collaborative annotation
Unspecified
2 BEM [41] 2012 Developmentþevaluation SSC Co-located Shared multiple representations Collaborative geographical map Unspecified
3 Reflect [5] 2010 Developmentþevaluation SSA Co-located Shared mirroring display
None Unspecified
4 VizCept [27] 2010 Developmentþevaluation SSA Co-located Shared multiple representations Collaborative concept mapping Web-based
5 MATRICS [57] 2005 Developmentþevaluation SSC Co-located None Collaborative annotation
Unspecified 6 Remote
Presentation System
[47] 2003 Developmentþevaluation SSC Distributed Shared visualization
None Unspecified
7 Telling Calls [24] 2011 Solution proposal SSC Co-located Shared coordination
None Mobile-based 8 A Remote
Collaborative System
[6] 2010 Solution proposal SSA Distributed Shared coordination Collaborative discussion board Unspecified 9 Phone Channel
[25] 2000 Solution proposal SSC Co-located Shared visualization
None Unspecified 10 LASAD [36] 2013 Developmentþevaluation SSA Distributed None None Web-based 11 KIA [20] 2009 Solution proposal SSA Distributed Shared
visualization, Shared coordination, Shared multiple representations Collaborative concept mapping, Collaborative discussion board Unspecified 12 Conversation Clock
[8] 2012 Solution proposal SSA Co-located Shared mirroring display
None Unspecified
13 CIVIL [64] 2013 Developmentþevaluation SSA Distributed Shared visualization, Shared coordination, Shared multiple representations Collaborative annotation, Collaborative discussion board, Collaborative geographical map Web-based
14 GeoVE [40] 2004 Developmentþevaluation SSC Distributed Shared coordination, Shared boundary objects Collaborative geographical map Unspecified 15 DIIII-D web portal
[1] 2010 Solution proposal SSC Distributed Shared multiple representations
distributed visualization has some resource allocation problems such as location of processing close to data for minimizing data traffic. Example of an enabling technol-ogy i.e. Grid Computing and the link to web services could provide better enhancement for distributed visualization in the CoVis systems, such as close coupling of simulations and visualizations in a real-time, interactive steering environment.
On the other hand, we have also identified four visua-lisation techniques, which include collaborative annotation, collaborative concept mapping, collaborative discussion board and collaborative geographical map. All of these initiatives show how shared cognition is made possible through the shared use of computer support, or systems through the contribution of joint information processing activities. However, these techniques only represent the application used in designing tools for mediating data or knowledge among the users involved. More techniques should be considered to address specific challenges in CoVis research pertaining to reaching common ground among group members, as addressed by Isenberg et al. [31]; for instance, the aspects of task that can provide collaborative activity centric or cognitive aspects that can support colla-borative foraging and collacolla-borative sense making.
Besides, we can also see that the shared visualisation implementation on mobile-based system environments have received very little attention compared with the web-based systems. In general, mobile devices are com-pact in size and have some limitations in terms of visualization design. Chittaro [9], pp. 40 provides eight aspects of restrictions in mobile visualization applications compared to desktop computers: poorer displays, small ratio of width/height, less powerful onboard hardware, small and tiny input peripherals, small surface of input techniques, slower connectivity, different performance among different mobile device models, and low or limited graphic libraries. Due to the mobility context and technical limitations, the challenges of designing shared visualiza-tions to support these aspects can be considered for future research. We suggest that some research areas can be explored in integrating rich interactive shared 3-D data visualisation, listed out by Chittaro [9] such as text, pictures, maps, physical objects and abstract data for Android, iOS and Blackberry technologies; this function can support users in carrying out 3-D visualisation tasks or provide effective means in supporting collaborative work. For example, Lipman [62] found that current hardware limitations affect the efficiency of 3-D model visualization and currently exploring software solutions to the mobile devices by enabling rendering models on remote powerful computers as a video sequence. Another mobile visualiza-tion work is conducted by Burigat and Chittaro[61]who develop LAMP3D, a system for the location-aware presen-tation of Virtual Reality Modelling Language content on mobile devices, which allow simplifications in carrying out tasks that can renders real-time 3-D city models on current PDAs. Web technologies also provide great oppor-tunities for shared visualization systems. In particular on the client-server concept, Wood, Brodlie, and Wright[63]
provides three broad categories of web-based visualiza-tions that can be explored: full-service, software delivery
and local operation. Full service refers to the remote creation of visualization design and core software is both supplied by the visualization service provider. Software delivery refers to creation of visualization over the net-work to the user where at least the design and core software is transferred through the execution of the user. Finally, local operation is creation of visualization (both design and core software) that are readily available locally and executed by the user. Potential areas of shared visualization research can be explored to enhance colla-borative computing to the publisher, the viewer as well as the intelligent visualization system.
Other technologies that are worth investigating in shared visualization include multimodal interaction and affective computing. The visualization and multimedia output capabil-ities in the CoVis can also be increased through sophisticated multimodal interaction. According to Oviatt and Cohen[48], multimodal input facility in a system could give more power-ful interfaces for the user to access and manipulate informa-tion. Example of future work may include designing shared visualization for multimodal inputs such as speech and hand-written recognition from the users. These recognition techni-ques should be able to read, interprete and translate integrated data inputs in a form of shared visualization, consequently can provide better multimodal interaction facil-ity in the CoVis system. Affective computing is a computing technology that focuses on designing a computer the ability to recognize and express emotions[51]. Future work would be on how to use emotion/affect in shared visualization when designing affective interactive products. Researchers may consider using psychometric and/or multi modalities for computer interaction with human emotion such as skin conductivity, heart rate, brain signals and physiological signals to evaluate the effects of shared visualizations designs embedded with those affective interactive products[45].
In summary, we have discovered three kinds of support through the findings of shared visualisation strategies and techniques; in specific, the social, task and cognitive elements need more investigation for further confirmation and validation. A guide on the selection of strategies and techniques in the design and development of socially shared cognitive systems or shared situation awareness systems for both distributed and co-located CoVis environments is also provided.
Acknowledgments
This study has received funding from the Ministry of Higher Education Malaysia under the Exploratory Research Funding Scheme (Project ID: EP20120612006) and from the Multimedia University Malaysia Research Funding (Project ID: IP20110707004 and IP20120511020).
Appendix A SeeTable A1.
Table A1
List of papers included in this systematic review arranged by year of publication (2000–2013;N¼15) Authors System name Research objective
[25] PhoneChannel a) To understand the influence of different communication media on interpersonal attributions, e.g. trust, as well as on task-related variables, e.g. efficiency
b) To explore the use of these technologies in business-to-household communication
[47] A remote presentation system
a)
To realize a high presence remote presentation in the shared immersive virtual world
[40] GeoVE a) To outline a conceptual framework for visually-enabled collaboration with geospatial information through geospatial technologies (an activity referred to as“geocollaboration”)
b) To demonstrate application of this framework to a pair of case studies from their ongoing research
[57] The MATRICS a) To support collaboration between distant groups working on a joint project based on virtual reality possibilities
[20] KIA a) To present a specific group awareness approach to computer-supported collaborative learning (CSCL), namely knowledge awareness
b) To illustrate how the knowledge awareness tools are used in three different tasks using three application scenarios
[1] DIII-D web portal environment
a) To describe the software architecture of this scientific web portal
b) To present its implementation including deployment experiences during the 2009 DIII-D Experimental Campaign.
[5] Reflect a) To describe an interactive table designed for supporting face-to-face collaborative learning
[6] Remote collaboration systems
a) To examine remote analyst pairs collaborate on the serial killer task
b) To examine how the distribution of evidence and the availability of visualization tools changes how pairs discuss the evidence and their problem solving success
[27] VizCept a) To present a new web-based visual analytics system designed to support fluid, collaborative analysis of large textual intelligence datasets
b) To combine individual workspaces and shared visualization in an integrated environment
[24] Telling Calls a) To describe Telling Calls, a mobile phone application which allows users to provide and receive information b) To conducted a qualitative and quantitative field study of Telling Calls usage
[8] Conversation Clock a) To evaluate the effect of visual feedback on collaboration, by deliberately distorting the apparent balance in the Conversation Clock
b) To examine various distortion strategies
[22] CO-ENV a) To describe and evaluate a method that defines a co-design platform dedicated to SMEs in the mechanical product field
[41] BEM a) To describe a protocol based on managing revisions for each collaborator exploring a dataset b) To perform a qualitative user study involving a real estate dataset
[36] LASAD a) To describe LASAD, a collaborative argumentation framework that can be flexibly parameterized
b) To evaluate the impact of using an argumentation system with different argument representations designed for collaborative or individual use on the outcomes of scientific argumentation
[64] CIVIL. a) To describe a multi-view, role-based design to help team members analyze geo-spatial information, share and integrate critical information and monitor individual activities
b) To describe design rationale, iterative design of visualization tools, prototype implementation, and system evaluation