Open Research Online
The Open University’s repository of research publications
and other research outputs
SaferDrive: an NLG-based Behaviour Change Support
System for Drivers
Journal Item
How to cite:
Braun, Daniel; Reiter, Ehud and Siddharthan, Advaith (2018).
SaferDrive:
an NLG-based Behaviour Change
Support System for Drivers. Natural Language Engineering, 24(4) pp. 551–588.
For guidance on citations see FAQs.
c
2018 Cambridge University Press
Version: Accepted Manuscript
Link(s) to article on publisher’s website:
http://dx.doi.org/doi:10.1017/S1351324918000050
Copyright and Moral Rights for the articles on this site are retained by the individual authors and/or other copyright
owners. For more information on Open Research Online’s data policy on reuse of materials please consult the policies
page.
©2018 Cambridge University Press
SaferDrive: an NLG-based Behaviour Change
Support System for Drivers
D A N I E L B R A U N
Department of Informatics, Technical University of Munich e-mail:daniel. braun@ tum. de
E H U D R E I T E R
Department of Computing Science, University of Aberdeen e-mail:e. reiter@ abdn. ac. uk
A D V A I T H S I D D H A R T H A N
Knowledge Media Institute, The Open University e-mail:advaith. siddharthan@ open. ac. uk
(Accepted 17 January 2018)
Abstract
Despite the long history of Natural Language Generation (NLG) research, the potential for influencing real world behaviour through automatically generated texts has not re-ceived much attention. In this paper, we presentSaferDrive, a behaviour change support system that uses NLG and telematic data in order to create weekly textual feedback for automobile drivers, which is delivered through a smartphone application. Usage-based car insurances use sensors to track driver behaviour. Although the data collected by such insurances could provide detailed feedback about the driving style, they are typically with-held from the driver and used only to calculate insurance premiums.SaferDrive instead provides detailed textual feedback about the driving style, with the intent to help drivers improve their driving habits. We evaluate the system with real drivers and report that the textual feedback generated by our system does have a positive influence on driving habits, especially with regard to speeding.
1 Introduction
The use of Natural Language Generation (NLG) in feedback and Behaviour Change Support Systems (BCSS) has proven to be helpful in different fields of application (cf. Section 2.2). Despite the existence of several BCSS for ecological driving (cf. Section 2.1) and a few NLG systems that summarise spatio-temporal data (cf. Section 2.3.1), there has been no effort to date to create a BCSS for drivers based on NLG. This is despite the fact that drivers, as suggested by Braun, Reiter, and Siddharthan (2015), would enjoy such a system and even prefer it over existing numerical or map-based feedback.
that uses natural language generation and telematic data in order to create textual driver feedback. SaferDrive generates weekly feedback reports that are delivered to the driver through a smartphone application (cf. Figure 1 for a screenshot). We report the general design of the system and the psychological assumptions it is based on. Moreover, we report the results of a real-world evaluation of the system which shows that it does positively influence driving habits, especially with regard to speeding.
Driving Report 31 August - 6 September
You drove 170 kilometres in five hours and 40 minutes during the last week. You managed to reduce the number of acceleration incidents per kilometre by nearly 10%, well done!
You didn't do any serious speeding, well done! However, you speeded on 31
occasions, 15 timeson weekdays on King Street.
You accelerated or braked harshly 103 times, mostly on weekdays on A91
and on weekdays on roads with 30 mph speed limit in Aberdeen.
Fig. 1:SaferDrive feedback report1
1.1 Motivation
Although the number of road deaths in the UK is steadily decreasing, 1,730 people died in road accidents in 2015 and 22,144 were seriously injured, according to the
1
Department for Transport (2016). Nearly 33% of those who died were under the age of 30.
In modern cars, numerous driving assistance systems are available to detect and resolve dangerous situations. Although some of these systems have been available for decades, such as the lane departure warning (LDW) system, which was first introduced to the consumer market by Mitsubishi Motors in 1992 (Bhatia, 2003), they still have a considerably low distribution. In Germany, for example, only 4% of all new cars sold in 2013 were equipped with LDW systems, according to Endlein, Trede, and Letzner-Friedlein (2014). And with the average car in the UK being 7.59 years old (Centre for Automotive Management, 2013), even once the majority of new cars are equipped with these systems, it will presumably take decades until these technologies reach a significant market penetration, particularly among younger drivers. Therefore, it is important that research attempts to develop inexpensive technologies which can be rapidly deployed to address the ever important issue of road safety.
SaferDrive attempts to provide a contribution to this goal by examining and evaluating the possibility of influencing driving behaviour through textual driver feedback. With the growing popularity of so-called telematic car insurances (cf. Section 1.2) and the upcoming EU-legislation “eCall”, which will make telematic sensors mandatory in new cars from April 2018 (Riederer, 2014), an increasing number of drivers already record the data which can be used to help them improving their driving.
1.2 Telematic Car Insurances
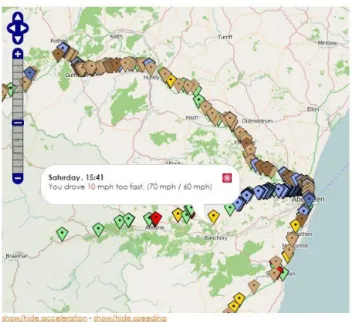
So-called “black box” or “telematic” car insurances are becoming more and more popular, especially among young drivers. Insurance companies expect that by 2020 nearly 40% of all car insurances in the UK will be telematic (Rose, 2013). Telematic insurances use different sensors installed in the car to track the individual driving style of their customers. Instead of calculating insurance premiums based on sta-tistical risk groups, insurance companies can use these data to create individual risk profiles and calculate insurance premiums accordingly. This offers drivers who belong to a high-risk group, such as young male drivers, the opportunity to save money. Very detailed feedback could be produced from these data, which could be able to help drivers to improve their driving and hence road safety. However, the feedback insurance companies give to their customers, if they give any feedback at all, is often very sparse: currently, two state-of-the-art versions of driver feed-back are utilised by large insurance companies. Policies like AXA Drivesave (cf. Figure 2a) and Aviva Drive provide scores, e.g. from 0 to 100, in categories such as “Anticipation”, “Smoothness”, “Pace” and “Calmness”. Policies like Intelligent Marmalade (cf. Figure 2b) provide maps in which incidents are marked with pins. As demonstrated by Braun et al. (2015), neither of these feedback formats are per-ceived as very helpful by drivers: in a study with 21 participants, three types of feedback (text, map, and score) were presented to each participant for four datasets. 13 participants chose textual feedback as their first preference, 4 the map, and 4
the score. Besides being perceived as more helpful, the textual feedback was also perceived as more encouraging and concrete than the other two feedback types.
(a)AXA Drivesave app (b)Intelligent Marmalade app Fig. 2: State-of-the-art driver feedback
2 Related Work
2.1 Automotive Behaviour Change Support Systems
Most BCSS in the automotive domain focus on ecological aspects of driving rather than road safety and all of them differ fromSaferDrive with regard to the form of feedback presentation.
TheCarCoachproject by Sharon, Selker, Wagner, and Frank (2005), for example, used a broad range of sensors, such as cameras, pressure sensors, GPS, and infor-mation provided by the car (e.g. gear and turn signal state), to track the behaviour of the driver. Although the system also monitored fuel efficiency, its main focus was on road safety. It attempted, for example, to identify turns without signalling or driver distraction. CarCoach provided immediate feedback to the driver in three different forms: visual (lights), acoustic (spoken messages), and haptic (vibration). As a study by Arroyo, Sullivan, and Selker (2006) has demonstrated, the immediate feedback from the CarCoach system can potentially increase the distraction of the driver and its feedback could be perceived as frustrating. CarCoach also used many additional sensors that are not usually available in cars, making it expensive.
DriveGainis a commercial smartphone application that was evaluated in a study by Tulusan, Staake, and Fleisch (2012). The app uses the GPS receiver and the acceleration sensor of phones to calculate scores from 0 to 100 in the categories acceleration, braking and speed, as well as a so-called overall “Journey Score”,
resulting in an app that is very similar to the feedback apps used by insurance companies. The study with 50 participants, all of them corporate car drivers, found an average improvement of 3.23% in fuel efficiency among subjects during the eight week test period.
A system that used both instant and non-instant feedback was developed by Boriboonsomsin, Vu, and Barth (2010). The system used a GPS receiver and data provided by the car to give instant feedback regarding fuel consumption andCO2
emissions and provides advice such as “shift gear sooner”, “maintain steady speed”, or “accelerate softly”. Following each trip, a summary was generated which included information such as the overall fuel consumption, the overall CO2 emissions, the
distance driven, and the average speed. A study with 20 participants demonstrated a 6% decrease in fuel consumption in cities and a 1% decrease on highways.
2.2 NLG feedback systems
Although no feedback systems or BCSS currently exist within the driving domain that use NLG, there are many such systems in other domains that have proven to be successful.
2.2.1 STOP
The STOP system is one of the very few well-documented cases of a BCSS that failed (Reiter, Robertson, and Osman, 2003). In order to encourage people to stop smoking, STOP generated tailored smoking cessation letters based on the responses to a smoking questionnaire. In an extensive clinical trial, more than 2,500 smokers participated and were randomly split among three groups. One group received tai-lored letters, one group received non-taitai-lored letters, and one group did not receive any letters at all. After the 20 month trial period, only 89 participants could be confirmed as new non-smokers. Broken down by groups, 3.5% of the tailored group, 4.4% of the non-tailored group and 2.6% of those who did not receive any letters stopped smoking. This indicated that participants who received non-tailored let-ters were more likely to stop smoking than participants that received tailored letlet-ters from the NLG system.
2.2.2 SkillSum
Despite such drawbacks, many other NLG systems, such asSkillSum by Williams and Reiter (2008), have been shown to be successful. SkillSum generated reports about reading skills for low-skilled readers. Obviously, based on the type of au-dience, the readability of the generated texts was crucial. But there was also a psychological challenge since bad results regarding basic reading skills could easily insult and demotivate people. An evaluation of the system showed that 92% of the participants found the reports generated by SkillSum were more useful than canned texts when they saw anonymized reports for someone else. However, only 55% of the participants preferred the text from the system when it was related to
their own performance. More importantly, two participants of the study became distressed and upset by their feedback, which underlines the importance of psycho-logical consideration during the creation of a feedback system. SkillSum was based on the GIRL (Generator for Individual Reading Levels) project (Williams, 2004), which focused on the effects of changes on the discourse level (e.g. order, length, etc.) on readers with different reading abilities.
2.2.3 Student Feedback
Gkatzia, Hastie, Janarthanam, and Lemon (2013) developed a statistical NLG sys-tem that generated feedback for students based on time-series data. Each participat-ing student was asked to complete a short questionnaire on a weekly basis, which in-cluded questions regarding the number of upcoming deadlines and attended classes. This information was combined with marks from a weekly assignment. Moreover, feedback generated from 12 different lectures for three different sets of student data was gathered and used to train the system. In an evaluation, the system was com-pared against three baseline conditions: system 1 used a rule-based approach with hand-crafted rules and templates. System 2 used a brute-force approach by ran-domly creating 10,000 different feedbacks and searching for the one that fit best. Finally, the third baseline condition was a text produced by a lecturer. 17 computer science students were asked to compare and rank the different approaches. In the ranking, the rule-based approach was preferred, while the learned system and the lecturer’s feedback shared second place.
2.2.4 NLG from Uncertain Information
Gkatzia, Lemon, and Rieser (2016) compared different information presentations (graphics only, text only, and graphics and text) for uncertain data. They used an extended version of the Weather Game (Stephens, Mylne, and Spiegelhalter, 2011) to find out which representation leads to better decisions. Their evaluation showed that the multi-modal presentation (graphics and text) and the text presentation both performed considerably better than the graphic presentation, although the participants felt more confident with the graphical representation, compared to the textual representation.
2.2.5 BeeWatch
BeeWatch (Blake, Siddharthan, Nguyen, Sharma, Robinson, O’Mahony, Darvill, Mellish, and van der Wal, 2012; van der Wal, Sharma, Mellish, Robinson, and Siddharthan, 2016) was a citizen science project which attempted to help people to identify different bumblebee species in order to capture their distribution. The species were identified with the help of an online tool where different visual features, like the colour pattern of the thorax, or the presence of a pollen basket, could be selected. In order to improve the quality of the collected data, two different feedback systems were tested, one with and one without NLG. After six months of using the
system, identification accuracy and retention were higher within the group that received feedback from the NLG feedback system.
2.2.6 DIAG
DIAG (Diagnostic Instruction and Guidance) was a system developed by Towne (1997) to teach students how to troubleshoot complex technical systems, such as heating systems. Di Eugenio, Fossati, Yu, Haller, and Glass (2005) used the DIAG system to evaluate the influence of aggregation on learning. They developed two systems DIAG-NLP1 and DIAG-NLP2. The first system only used syntactic ag-gregation, while the second system also used what the authors referred to as “func-tional aggregation”. This system not only aggregated by language connections but also by functional collections, such as aggregating different components to the ma-chine they build. The evaluation of both systems, compared to the original system, demonstrated that while syntactic aggregation did not improve the learning out-come functional aggregation did.
2.3 Data-to-Text systems
SaferDrive creates textual summaries of driving (i.e. GPS and acceleration) data and is therefore not only a BCSS but also a Data-to-Text system and follows the architecture described by Reiter (2007). There are numerous examples of Data-to-Text systems in many different domains, some of them more closely related to SaferDrive than others.
2.3.1 Geographical Data
More closely related are systems which deal with geographical data, such as Turner, Sripada, Reiter, and Davy (2008). Turner et al. investigated how to efficiently refer-ence geographic areas based on different available features, such as altitude, direc-tion, populadirec-tion, etc. The Tag2Blog project (Ponnamperuma, Siddharthan, Zeng, Mellish, and van der Wal, 2013; van der Wal, Zeng, Heptinstall, Ponnamperuma, Mellish, Ben, and Siddharthan, 2015) created diary-like texts from GPS tags at-tached to birds, in order to raise awareness about endangered animals.
A very popular field of application for Data-to-Text systems, which also deals with geographical data (but not exclusively), is the weather report. Early systems within this domain already appeared in the 1990s, such as FOG from Goldberg, Driedger, and Kittredge (1994). More recent examples are from Ramos-Soto, Bugar´ın, Barro, Gallego, Rodr´ıguez, Fraga, and Saunders (2015), who developed a Data-to-Text system for forecasts about air quality, or Sripada, Burnett, Turner, Mastin, and Evans (2014) who developed a Data-to-Text system for the UK national weather service.
2.3.2 Medical Data
Another very interesting though less closely related field of application for Data-to-Text systems is the medical domain. Examples from this domain include BabyTalk (Gatt, Portet, Reiter, Hunter, Mahamood, Moncur, and Sripada, 2009), a decision support system for doctors in neonatal intensive care, and Hallett, Power, and Scott (2006), who generated summaries for e-health data. While set in another domain, both systems generated summaries for data which was collected over a certain period of time, as we do with SaferDrive. Another example of such a system is BT-Nurse (Hunter, Freer, Gatt, Reiter, Sripada, Sykes, and Westwater, 2011), which created shift summaries for nurses in neonatal intensive care units. A more commercial perspective to the topic is represented by Harris (2008), who described the special challenges of creating a commercial Data-to-Text system within the medical domain, compared to research projects.
2.3.3 Stochastic Text Generation
While the language generation of SaferDrive and most of the aforementioned sys-tems, independent from their domain, is based on rules, there is also a recent trend towards stochastic language generation approaches. While the trend is currently fired by advances in machine learning, its roots go back to the Nitrogen realiser by Langkilde and Knight (1998). More recent approaches include Konstas and Lapata (2012), Mairesse, Gaˇsi´c, Jurˇc´ıˇcek, Keizer, Thomson, Yu, and Young (2010), Xu, Ba, Kiros, Cho, Courville, Salakhudinov, Zemel, and Bengio (2015), and many others. While these techniques have many advantages, they also have some disadvantages. They, for example, need a sufficiently large corpus of training data. For SaferDrive, there is no human generated equivalent of the reports we want to create. Creat-ing such a corpus (if possible at all) would be very expensive. Moreover, especially for BCSS, each word choice can be very important. While it is relatively easy to adapt the generated texts of a rule-based NLG system at word-level, it is often not possible in stochastic systems.
2.4 Psychological Aspects of Supporting Behaviour Change Many different theories exist regarding how behaviour changes can be encouraged. Some theories which are popular among BCSS (Lehto, 2012; Masthoff, Grasso, and Ham, 2014) and influenced the development of SaferDrive are presented in this section.
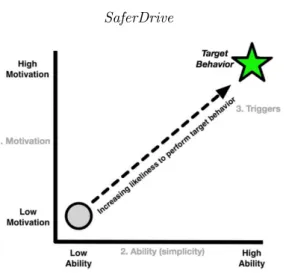
2.4.1 Fogg Behavior Model
In theFogg Behavior Model (FBM), “behavior is a product of three factors: moti-vation, ability, and triggers” (Fogg, 2009).
This implies that in order to increase the likelihood of a person performing a certain behaviour, the person must be motivated to perform the behaviour, have the ability to perform it, and needs a trigger (cf. Figure 3).
Fig. 3: The Fogg Behavior Model (source: Fogg (2009))
For systems that use NLG, such as the one presented in this article, the mo-tivation is always closely related to language choices. In our particular case, the perspective of saving money represents another motivating factor. In Section 3.2, we explain how the factor of “ability” is taken into account.
Fogg distinguishes three different types of triggers: a spark is a trigger with a motivational element, which is used“when a person lacks motivation to perform a target behavior” (Fogg, 2009) but has the ability. When a person lacks the ability but has the motivation, afacilitator is used. A facilitator usually tells the user that the target behaviour is easy to do. The third type of trigger, thesignal, is used if the user has both the ability and the motivation and just needs a reminder.
SaferDriveuses the generated feedback reports as a trigger. However, this trigger does not fit one of the categories defined by Fogg, since the feedback contains moti-vational elements and explains how the target behaviour can be achieved (ability). It is therefore a combination of a spark and a facilitator.
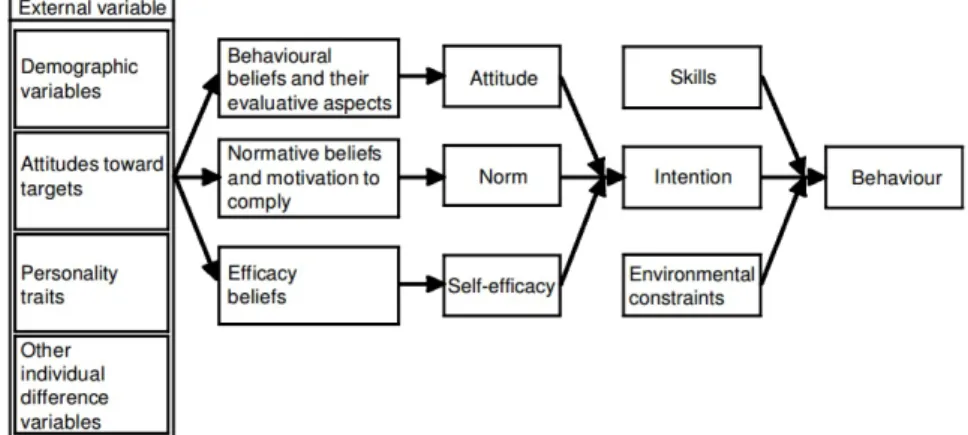
2.4.2 Integrative Model by Fishbein
A slightly more complex but closely related model was developed by Fishbein (2000) by combining different leading theories regarding behaviour prediction and behaviour change from Ajzen and Fishbein (1980), Bandura (1994), Becker (1974), and Rosenstock, Strecher, and Becker (1994).
Fishbein describes the main statement of his integrative model as: “if one has made a strong commitment (or formed a strong intention) to perform a given be-haviour, and if one has the necessary skills and the ability to perform the bebe-haviour, and if there are no environmental constraints to prevent the performance of that be-haviour, the probability is close to one that the behaviour will be performed” (Fish-bein, 2000).
What the FBM describes as “ability” is split into “skills” and “environmental constraints” in this model. And what is split into “motivation” and “trigger” in the
FBM represents part of the factors that influence the “intention” in the integrative model by Fishbein (cf. Figure 4).
Fig. 4: Integrative model by Fishbein (source: Fishbein (2000))
2.5 Feedback Techniques
Besides these general behaviour models, a large amount of literature exists which explicitly deals with textual or verbal feedback. The three following popular tech-niques have special importance in our feedback generation. For future reference, they are enumerated fromFT1 toFT3.
Positive Feedback (FT1): One very popular piece of advice is to begin feed-back reports with positive feedfeed-back. The reason for this is that positive feedfeed-back is generally perceived as more accurate by the recipient than negative feedback (Ilgen, Fisher, and Taylor, 1979). Beginning with positive feedback, therefore, can give the feedback source more credibility in general, which can have a positive influence on the perception and acceptance of following (possibly negative) feedback. Steelman and Rutkowski (2004) conducted a study with 405 employees from two manufac-turing companies. Participants were asked to rate the feedback they get from their supervisor in categories like “My supervisor tells me when my work performance does not meet organizational standards”, “My supervisor gives me useful feedback about my job”,“My supervisor generally provides feedback in a thoughtless manner”, “My supervisor is generally familiar with my performance on the job”, and“I want to improve my job performance based on the feedback my supervisor provides”. The statistical evaluation of the questionnaires showed that supervisors who regularly give positive feedback are perceived as more credible than others, even when they give negative feedback. Not surprisingly, it also showed that employees are more motivated to improve their performance after negative feedback if the supervisor has a high credibility.
This technique is also often used in clinical settings as part of the so-called “feed-back sandwich”, which begins with positive feed“feed-back, followed by negative feed“feed-back
and ends with positive feedback, as described by Dohrenwend (2002). We incorpo-rate these findings in SaferDrive by starting the report, whenever possible, with positive feedback.
Specific Goals (FT2): Another technique was emphasised by Hattie and Tim-perley (2007), who demonstrated that specific goals are more effective because “they focus students’ attention, and feedback can be more directed”. In a meta-analysis of more than 7,000 studies about feedback, they even found that clear goals have a higher effect size on learners than giving them rewards.
Our system addresses this by trying to describe misbehaviour as precisely as possible and pointing out which parts of the feedback should be addressed during the next feedback period.
Justified Feedback (FT3): The third feedback technique which plays a ma-jor role in the present work is supported by a variety of publications, such as Ye and Johnson (1995), Teach and Shortliffe (1987), and Weiner (1980). All of these publications suggested that it is crucial for the acceptance of feedback, especially from a computer system, that the feedback is presented in a form which allows the recipient to understand and reconstruct how conclusions were drawn. In other words, feedback has to be justified. In our system, this goal is mainly fulfilled by non-textual elements which visualise the underlying data from which the feedback was generated.
Ye and Johnson (1995) tested an expert system that analyses financial data with 20 practising auditors. The participants were asked to express how much they “believe the system’s conclusion is true or reasonable” on a scale from 1 (“strongly disagree”) to 7 (“strongly agree”). Without an explanation from the system, the mean of all answers was 5.56, with an explanation, the belief in the system increased by more than 10% to 6.13.
3 System Design
3.1 Data Corpus
The data corpus we gathered for the development of our algorithms and the Safer-Drive prototype consists of approximately 1,000 road kilometres, driven by five different drivers in four different countries (namely Germany, the United Kingdom, France, and Luxembourg - sorted by decreasing sample size). It was built using an Android smartphone application that was based on previous work by Braun, Endres, and M¨uller (2011). Depending on the update frequency provided by the system (usually GPS position update every second and accelerometer update every 100-200 ms), this application creates a dump of all GPS and accelerometer values every time they are updated. While “black boxes”, i.e. permanently installed sen-sors, do offer the possibility to collect more data (e.g. through the CAN-Bus) and sometimes more precise data (especially for acceleration), installing them is expen-sive and might scare potential participants. In contrast, smartphones are widely available and new applications can be deployed easily without any additional costs.
Since smartphone applications are also widely used by insurance companies, we decided to use them to collect data.
3.2 Relevant Behaviour
In order to provide feedback, we first have to decide which behaviours should be classified as “right” and which as “wrong” and when wrong behaviour is relevant or significant enough to be taken into account for the feedback generation. The most obvious approach would be to expect law-abiding behaviour. However, it is worth considering different points of view. From the police’s point of view, the naive approach of law-abidance may be sufficient, but from a driving instructor’s point of view other aspects are also important, like energy-saving and smoothness. As our system is influenced by telematic insurances, particular attention should be paid to the point of view of insurance companies. Although their exact metrics are secret, we know that they take into account speeding, time of day, day of week, acceleration, braking, elapsed distance, road type and other parameters (cf. H¨andel, Skog, Wahlstr¨om, Bonawiede, Welch, Ohlsson, and Ohlsson (2014) for a more extensive list). On one hand, we want to stick close to the insurance metrics, on the other hand, from a motivational point of view, it is strongly advised to analyse these parameters critically. It would be, for example, very frustrating for drivers who need to drive to work at 6 a.m. every weekday, to be told that they should not drive before 9 a.m., because it could increase insurance premiums.
After taking all these different considerations into account, we decided to con-centrate on speeding and acceleration and braking behaviour. These are three of the most important parameters for insurance companies, because wrong behaviour in these categories often causes accidents and they are also important for driving instructors. There are, of course, many other important parameters, like distraction and safety distance, which can not be taken into account due to the limitation of the available data.
Speeding, acceleration, and braking also possess quantitative dimensions which are very important for feedback generation. While it is reasonable to define driving at 50 mph on a road with a 30 mph speed limit as incorrect behaviour, it is debatable as to whether driving at 31 mph on the same road is still considered incorrect behaviour. In the UK, no compulsory law exists regarding the handling of these issues; therefore the decision is up to the police officer’s discretion. The Association of Chief Police Officers (2015) suggests a tolerance of 10% of the speed limit + 2mph. Other countries have a fixed tolerance, such as Germany, with a tolerance of 3%, or no tolerance at all, like Switzerland. Due to the limited accuracy of our measurement method, it was decided to adopt a tolerance of 10% of the speed limit, before an exceeding of the speed limit is classified as speeding. It was also decided to ignore violations of the speed limit with a distance under 10 metres. While the quantification of speeding incidents can be derived from laws, the situation is less obvious for inappropriate acceleration or braking. After numerous tests, we decided to adopt the guidelines we derived from theAXA Drivesaveapp, which categorises
speeding and braking incidents up to +/- 2ms2 as permissible, and everything above
as non-permissible behaviour.
3.2.1 Importance
Based on these quantifications, the decision as to whether a specific incident should be taken into account for the feedback generation is not based on a binary classifi-cation (relevant behaviour / non-relevant behaviour), but on a numeric importance value between 0 and 1 that is assigned to each violation of the aforementioned be-haviour criteria. In order to calculate this value, each violation is represented as a 5-tuple, consisting of:
1. type: the type of the violation (i.e. speeding, accelerating, or braking) 2. length: the length in kilometres
3. max value: the maximum value (i.e. the maximum speed during the violation
in km/h or the maximum / minimum acceleration in m s2)
4. exp value: the expected or allowed value (i.e. the speed limit in km/h or
+/-2m s2)
5. road type: the type of the road the incident occurred on
This tuple is used to calculate importance values for each detected violation using Algorithm 1. The development of the algorithm began based on the basic assump-tions described at the beginning of this section (e.g. speeding is more important than braking, and braking is more important than accelerating), the metrics from insurance companies, recommendations from the police and advice from a driving instructor. In order to refine the exact values, we ran multiple iterations in which we tested the algorithm on the training data, and adjusted the values until the results matched a manual assessment collaboratively created by the authors, the domain expert and multiple drivers.
The development of the importance algorithm and the distance function, which is introduced in the next section, did require a noticeable amount of manual work. In the future, machine learning techniques could help to reduce this amount and refine the algorithms further, or even adapt them to new violation types or new domains.
3.2.2 Agglomeration
A single hour of driving can consist of up to 300,000 data points, which can result in hundreds of violations per week. Since we aim to generate weekly feedback reports that will be presented on a smartphone display, we need to summarise this data. While maintaining awareness of the goal of behaviour change, a single violation which occurred in the past is not very important or helpful for feedback generation since the goal is to influence future behaviour. By clustering similar past violations along meaningful features (like street name, street type, speed limit, time of the day, and day of the week), we can detect behaviour patterns which occur regularly and are therefore likely to be repeated in the future. Reporting these clusters could
Algorithm 1Importance Algorithm for Violations
1: functionImportance(type, length, max value, exp value, road type)
2: i←0 . init importance value with 0
3: if type=Speeding then
4: i←i+ 0.25 .a priori importance of speeding violations
5: i←i+ min(jlength100·1000k· 1 100,0.1)
6: if road type=Livingstreet∨road type=Residential then
7: i←i+ 0.15
8: end if
9: ∆v←max value−exp value . max exceedance of the speed limit
10: if ∆v≤10then 11: i←i+ 0 12: else if ∆v≤15then 13: i←i+ 0.02 14: else if ∆v≤20then 15: i←i+ 0.08 16: else if ∆v≤25then 17: i←i+ 0.14 18: else if ∆v≤30then 19: i←i+ 0.20 20: else if ∆v≤40then 21: i←i+ 0.26 22: else if ∆v≤50then 23: i←i+ 0.32 24: else if ∆v≤60then 25: i←i+ 0.38 26: else if ∆v≤70then 27: i←i+ 0.44 28: else 29: i←i+ 0.50 30: end if 31: else
32: if type=Brakingthen
33: i←i+ 0.2 . a priori importance of braking violations
34: if road type=Highway then
35: i←i+ 0.15
36: else if road type=T runk then
37: i←i+ 0.1
38: end if
39: else if type=Acceleratingthen
40: if road type=Livingstreetthen
41: i←i+ 0.15
42: else if road type=Residentialthen
43: i←i+ 0.1
44: end if
45: end if
46: i←i+ min((b|max value10 |c),0.4)
47: end if
48: returni 49: end function
help drivers to avoid such behaviour in the future. A positive side effect of this approach is that the influence of any measuring errors by the sensors is minimised. Other NLG systems, e.g. by Hallet et al. (2006) and Gatt et al. (2009), also used the concept of clustering to summarise data and locate patterns.
In order to produce helpful feedback, the features by which the violations are clustered must be meaningful, which in this case implies the need to identify features which have a causal relationship to the incidents, rather than just a correlation. In order to identify such features, we tried to identify common behaviour patterns that are caused by factors which are detectable in the available data set, together with a driving instructor. Besides personal expertise, these patterns were mainly derived from national road accidents statistics. Insights derived from this statistics include the fact that the type of a road and the speed limit has a huge impact on the number of accidents (Statistisches Bundesamt, 2016), as well as the time of the day and the day of the week, since especially young drivers tend to have more accidents at the weekend and during the night (Unger, 2012).
Therefore, we cluster the incidents by the following features: street name, street type, speed limit, time of the day, and day of the week. With additional data sources (such as personal schedules, traffic data, weather data, etc.) the results of the clustering could be improved. However, ethical and privacy concerns prohibited the use of some data sources (e.g. personal schedules) and others (such as traffic and weather data) are difficult to obtain retrospectively.
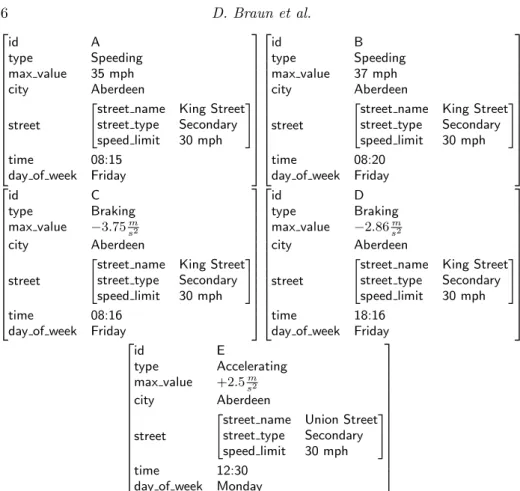
Figure 5 shows a simplified representation of three violations which includes all features taken into account for the cluster generation. Based on this selection and our data corpus, we developed a distance function that calculates the similarity or dissimilarity of two violations (v1andv2) as a value between 0 and 1, as Algorithm 2
shows, whereby 0 means they are (nearly) equal and 1 means they have nothing in common. Like the importance algorithm, we started with the basic assumptions extracted from the literature and ran multiple iterations in which we tested the algorithm on the training data, and refined the values until the results matched a manual assessment collaboratively created by the authors, the domain expert and multiple drivers. As mentioned before, in future systems, the amount of manual work could be reduced by using machine learning techniques.
The algorithm which actually creates the clusters uses a bottom-up approach and repeatedly joins the “nearest” clusters, this method is called hierarchical ag-glomerative clustering. The creation of the clusters is a weighing up and a trade-off between the cluster size and the tightness of a cluster. A large cluster describes a behaviour pattern that occurs very often, which is desirable to report because it makes it more likely to occur again in the future. On the other hand, a tight cluster contains very similar elements, which means they can be described very precisely, which is desirable to report because more specific feedback is better than general feedback.
In order to keep these two interests balanced, the algorithm can be configured with a minimal cluster size and a maximal cluster-distance. Clusters that do not fulfil these requirements will not be used during the feedback generation. Moreover, as soon as a cluster fulfils the minimal size criterion, it will not be joined with other
id A type Speeding max value 35 mph city Aberdeen street
"street name King Street
street type Secondary
speed limit 30 mph
#
time 08:15
day of week Friday
id B type Speeding max value 37 mph city Aberdeen street
"street name King Street
street type Secondary
speed limit 30 mph
#
time 08:20
day of week Friday
id C type Braking max value −3.75sm2 city Aberdeen street
"street name King Street
street type Secondary
speed limit 30 mph
#
time 08:16
day of week Friday
id D type Braking max value −2.86ms2 city Aberdeen street
"street name King Street
street type Secondary
speed limit 30 mph
#
time 18:16
day of week Friday
id E type Accelerating max value +2.5m s2 city Aberdeen street
"street name Union Street
street type Secondary
speed limit 30 mph
#
time 12:30
day of week Monday
Fig. 5: Simplified representation of violations
clusters if the join would lead to a significant drop in tightness. This is how our system takes into account feedback technique FT2 (cf. Section 2.5), by keeping clusters tight and therefore more specific. The tightness, or inner distance, of a clusterC is in our system defined as the maximum distance between two elements of the cluster:max({distance(a, b)| ∀a, b∈C}). The distance between two clusters
C and D is defined as the maximum distance between an element from clusterC
and an element from clusterD:max({distance(a, b)| ∀a∈C, b∈D}).
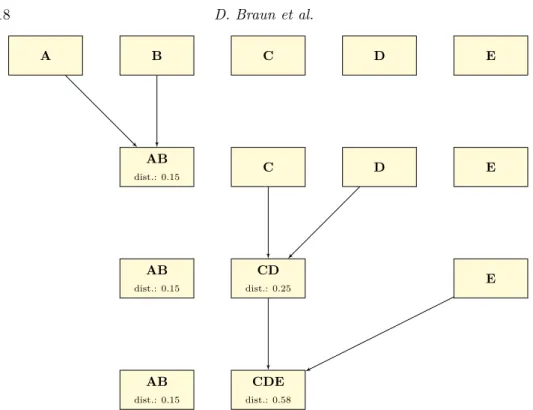
Figure 6 provides an example how the clustering algorithm works, based on the five example input violations in Figure 5.
In the first step, all five messages are represented as a cluster containing only themselves. For every possible pair of clusters (AB, AC, AD, AE, BC, BD, BE, CD, CE, and DE), the distance between the two clusters is calculated with Algo-rithm 2. The calculation always begins with the distance 1. For the pair AB, 0.25 is subtracted from this initial distance because both are of the same type (Speeding). 0.2 is subtracted because the speed limit is the same for both violations, and 0.2 more because they occurred on the same street. Since they also both occurred on a Friday, 0.1 is subtracted and finally, 0.1 is subtracted again because they occurred within 5 minutes of each other. Combined, the distance for the pair AB is
there-Algorithm 2Distance Function
1: functionDistance(v1, v2)
2: d←1.0 .init distance value with 1
3: if v1.type = v2.type∨(v1.type = Braking∧v2.type = Accelerating)∨
(v1.type=Accelerating∧v2.type=Braking)then
4: d←d−0.25
5: if v1.type=Speeding then
6: if v1.speed limit=v2.speed limit then
7: d←d−0.2
8: end if
9: else if v1.type=Accelerating∨v1.type=Brakingthen
10: if sign(v1.max value) =sign(v2.max value)then . check if both
violations have the same direction
11: d←d−0.2
12: end if
13: end if
14: end if
15: if v1.street name=v2.street namethen
16: d←d−0.2
17: else if v1.city=v2.city then
18: d←d−0.1
19: end if
20: if v1.street type = v2.street type ∧ v1.street type ∈
{Livingstreet, Residential, T runk, Link, Highway}then
21: d←d−0.15
22: end if
23: if v1.day of week=v2.day of week then
24: d←d−0.1
25: else if v1.day of week∈W eekend∧v2.day of week∈W eekendthen
26: d←d−0.09
27: else if v1.day of week∈W eekday∧v2.day of week ∈W eekday then
28: d←d−0.07
29: end if
30: ∆t← |v1.time−v2.time| .time difference in minutes (not dependent on
the day) 31: d←d−max(0,(0.1− ∆t 2000 )) 32: returnd 33: end function
fore 0.15. The distances between A and all other violations and B and all other violations are higher because they are not of the same type. The pair CD has the distance 0.25, because they match in the same points, with the exception of the time difference. All other combinations have higher distances. Therefore, in the first step, A and B are joined.
A B C D E AB dist.: 0.15 C D E AB dist.: 0.15 CD dist.: 0.25 E AB dist.: 0.15 CDE dist.: 0.58
Fig. 6: Visualisation cluster algorithm (cf. Figure 5 for input)
The newly created cluster AB has an inner distance of 0.15. In the second step, the distances are calculated again for all possible pairs (ABC, ABD, ABE, CD, CE, and DE). Since the distance between two clusters is defined as the distance of the two elements with the highest distance, the distance between AB and C would be the distance between B and C (because the time difference between B and C is higher than the time difference between A and C). However, the two nearest elements in this step are C and D, and they are therefore combined to a new cluster CD with an inner distance of 0.25.
In the third step, the distance between CD and E is 0.58, and the distance between AB and E is 0.83. Depending on the defined maximum inner distance, the algorithm either terminates or joins CD and E to a new cluster with an inner distance of 0.58.
In the fourth step, the only possible operation would be to join AB and CDE to a new cluster ABCDE which would have an inner distance of 0.83. This would create a cluster that only has the city (Aberdeen) and the fact that all incidents happened on a weekday in common, which would clearly not be useful for our purposes.
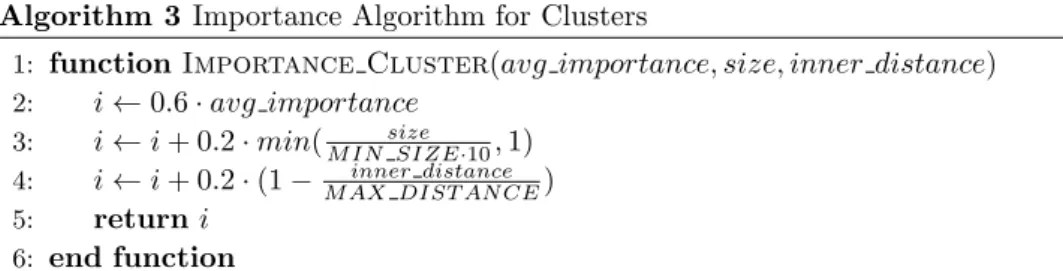
In order to determine which clusters will be used for the feedback generation (cf. Section 3.6.3), there is also an importance value attached to each cluster based on the average importance of the elements within the cluster, the size of the cluster, and the inner distance of the cluster (cf. Algorithm 3).
Algorithm 3Importance Algorithm for Clusters
1: functionImportance Cluster(avg importance, size, inner distance)
2: i←0.6·avg importance 3: i←i+ 0.2·min( size M IN SIZE·10,1) 4: i←i+ 0.2·(1− inner distance M AX DIST AN CE) 5: returni 6: end function 3.3 General Architecture
The general architecture ofSaferDrive is shown in Figure 7. The user application collects raw sensor data from the accelerometer and GPS receiver on a smartphone. The data is then sent to a server where it is parsed for violations, which are subse-quently stored in a standard SQL database. One week after a user sent data for the first time, the NLG-Module creates an HTML feedback report from the violations database, which is immediately sent to the user and displayed as soon as the ap-plication is opened again. Subsequently, feedback reports are created once a week. So if users start to use the app e.g. at 1 p.m. on a Monday, they will receive a new report every Monday at 1 p.m.
Nominatim
Violation DB User Application
encrypted raw sensor data GPS coordinates
street, city, country, type, speed limit, city violation type, time, position,
value, importance, osmID
Multimodal HTML F eedback Violation Parser NLG-Module Most impor tant viola tions OpenStreetMap API osmID osmID
Fig. 7: System architecture
3.4 User Application
Insurance companies use mainly two different approaches to collect their data. They either use permanently installed sensors, so-called “black boxes”, or smartphone
applications. In both cases, GPS timestamps and coordinates, as well as acceleration data, are logged. Although both smartphone and black box solutions raise questions about data reliability and integrity, as pointed out by H¨andel et al. (2014) and others, these two approaches have together a worldwide market share of nearly 80% of all telematic car insurances (No¨el, 2015).
(a) Main screen (b) Feedback screen
Fig. 8:SaferDrive app
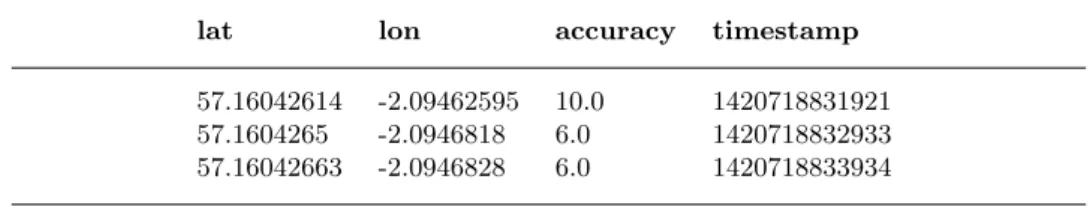
Our prototype application, which is shown in Figure 8a, is an Android-application which collects raw sensor data from the accelerometer (cf. Table 1) and GPS receiver (cf. Table 2). Before the data is transmitted to the server, the first and the last mile of each trip are removed to reduce the possibility of identifying subjects by their place of residence or work. The data is also encrypted with AES-256 before the transmission.
The second important functionality of the user app is the delivery of the feed-back reports (cf. Figure 8b) and the gathering of the user evaluation data. The app checks regularly if a new feedback report is available from the server and down-loads it automatically to the phone as soon as it is available. Before the feedback report can be closed, the user has to complete a short survey, which is described in Section 4.4.1.
date time x y z
08.01.2015 12:07:10.838 1.49 2.10 9.76 08.01.2015 12:07:10.858 1.45 2.18 9.73 08.01.2015 12:07:10.879 1.64 2.15 9.65
Table 1: Raw data acceleration sensor (in sm2)
lat lon accuracy timestamp
57.16042614 -2.09462595 10.0 1420718831921
57.1604265 -2.0946818 6.0 1420718832933
57.16042663 -2.0946828 6.0 1420718833934
Table 2: Raw data GPS receiver (accuracy in m)
3.5 Violation Parser
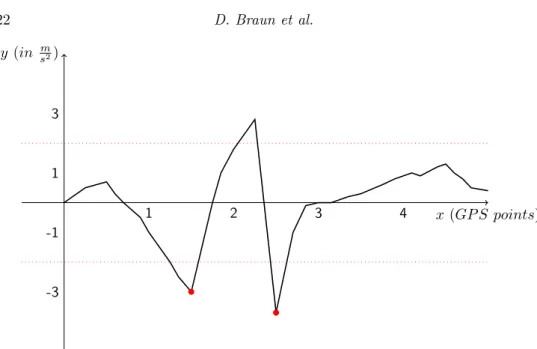
As soon as the data is uploaded to the server it is parsed for violations, and the raw sensor data is deleted immediately afterwards. Violations of the braking and acceleration rules can be detected by using only the raw sensor data. Since the phone is calibrated prior to each recording we just have to search for an acceleration of more than 2sm2 or less than −2
m
s2 on the y-axis. However, only the maximum value
is of interest. This implies that while the absolute value of the acceleration is still increasing, no violation is detected even if the threshold is already passed (as for example in Figure 9 after x-value 1), until the acceleration has reached its maximum and is decreasing again.
Since the value of the accelerometer is typically updated far more frequently than the GPS position, it is possible that two different acceleration violations could exist at the same GPS position, for example, if a driver is accelerating harshly and must suddenly brake, as in Figure 9 between x-values 2 and 3. In this case, only the incident with the higher absolute value is saved.
The detection of violations of the speed limit is slightly more complex. Since speed is the distance travelled in a certain amount of time, a speeding violation can never consist of a single point, but instead of a segment. The smallest segment for which we can calculate a speed is the distance between two GPS position updates. In order to calculate the distance between two GPS positions, we implemented the Haversine formula (cf. e.g. Ratsameethammawong and Kasemsan (2010) and Yue, Zhang, and Jacobsen (2013)). An exceeding of the speed limit is only classified as a speeding violation if the speed limit is exceeded by more than 10% for more than 10 metres. A continued exceeding of the speed limit is saved as a continuous violation, even if the necessary threshold is undershot for a short time in between. However,
x(GP S points) y (in sm2) 1 2 3 4 1 -1 3 -3
Fig. 9: Acceleration violation detection example (dots: detected violations)
in order to be able to connect each violation with a specific street, a new violation is created every time the street or the speed limit changes.
Additional information that is necessary during the detection of violations, such as street names, street types, and speed limits, are obtained from OpenStreetMap (OSM). In order to access these data, it is necessary to first reverse geocode the po-sition information to match them to a street in the OSM dataset. For this purpose, we developed the Nominatim Reverse Geocoding JAPI, which uses Nominatim -Servers2to perform this task. In this way, a unique ID for each street is obtained, which can be used to fetch additional information from the OSM API, most impor-tantly for our application, the speed limit.
3.6 NLG-Module
The most important part of our prototype is the NLG-Module, which generates the actual feedback reports from the information in the database. In general, the prototype follows the architecture described by Reiter (2007), which consists of four stages: Signal Analysis, Data Interpretation, Document Planning and Microplan-ning and Realisation.
3.6.1 Signal Analysis
In our system, the Signal Analysis stage is implemented by the Violation Parser and separated from the NLG-Module. The reason is quite simple: the NLG-Module is only active when a feedback report has to be generated (i.e. once a week). For
2
performance and privacy reasons, we do not want to keep the raw sensor data until this happens. Therefore, the Signal Analysis stage is executed every time new data is uploaded. The other three stages are described in this section.
3.6.2 Data Interpretation
The Data Interpretation stage fulfils multiple important tasks: it generates clusters from the single violations, calculates a comparison between the current and the previous feedback period, generatesmessages and assigns an importance value to each message. In this context, a “message” is an abstraction that represents an intermediate step between the data structure and the text that will be generated from it (Reiter and Dale, 2000). In our system, there are seven different types of messages which are represented as Java classes. The message types that represent single violations are calledSingleSpeedViolation, which represent speeding, and Sin-gleAccelerationViolation, which represent harsh acceleration, but also harsh brak-ing, since braking is just an acceleration with a negative sign. Similarly aggregated violations are represented by two message types called AggregatedSpeedViolation andAggregatedAccelerationViolation.
The generation of the clusters follows the method described in Section 3.2.2. Based on tests with our data corpus we decided to set the minimal cluster size to 7 and the maximum inner distance to 50. A higher minimal cluster size or maximum inner distance would lead to clusters with only a few features in common. As described in Section 3.2.2, such clusters can not be described precisely and are therefore less suitable for feedback generation because they would not comply with feedback technique FT2 (cf. Section 2.5). A lower minimal cluster size or maximum inner distance, on the other hand, would lead to very small clusters which would represent behaviour patterns that hardly occurred and are therefore also less suitable for feedback generation. The importance values are calculated according to the algorithm described in Section 3.2.1.
The calculated comparisons describe the change in the number of violations from the previous week (or feedback period) to the current week (or feedback period) for a cluster. However, they are not bound to the minimal cluster size and the maximal inner distance: they can represent very general developments, such as a change in the number of violations per kilometre, independent from the violation type, or a change in the number of violations per kilometre for a single violation type, but also very specific changes such as a change in the number of violations per kilometre for a specific violation type, on a specific street type in a specific city. We will explain in the next section why they are not bound by the same rules as the other clusters.
3.6.3 Document Planning
During the process of Data Interpretation, several hundred messages can be created for a feedback period of one week. Clearly, a feedback report can not (or at least should not) cover all of these messages. Since feedback reports will be shown on a
small (smartphone) screen, the texts should be of a very limited length in order to not lose the attention of users, as pointed out by Braun et al. (2015).
During the Document Planning stage, the system must decide which clusters and violations, and hence which messages, are important enough to be mentioned in the feedback report, and also in which order they should be mentioned and how the document should be generally structured. These decisions are very dynamic and depend strongly on the underlying data (cf. Algorithm 4). If someone is, for example, a very careful driver, it might be worth mentioning if he or she exceeded the speed limit by 20 mph once. But if someone is a rather forceful driver who regularly exceeds the speed limit by an even bigger amount, this would probably not be an incident worth mentioning.
Another reason why it is crucial to have a dynamic process of content selection and ordering is the fact that the users will receive regular feedback reports. There-fore, repetitive elements could get annoying rather quickly. To avoid this, we try to vary our texts on three different levels: first and foremost we try to support a change in behaviour. If this aim is successful, the underlying data will change due to a behaviour change which will generate a “natural” variation in the content. The second level is the stage of Document Planning where we alter the content selection (i.e. leaving out less important information sometimes) and the structure. The third and final method we utilise is a variation during the realisation process, where we do not change what is communicated, but how it is communicated.
Nevertheless, there are rules for the structure of the document which are fixed. Each report consists of a heading (cf. Algorithm 4, line 4), two text parts, and a map. The first text part consists of one paragraph which contains a summary of the driving activity during the feedback period and a comparison between the current and the previous feedback period. The summary always contains the length of the feedback period (e.g. one week) and the driven distance during this time (cf. line 7). It can also contain the driven time, which is an optional variation that is randomly added or excluded (cf. line 9). For this, and all other random decisions, we believe that they do not influence the impact of the feedback. They are merely possibilities to generate textual variance, without changing the underlying message or affecting the psychological influence of the texts. However, we have not yet evaluated the influence of single verbalisations on the effectiveness of the feedback.
For the comparison, the main criterion by which the message is selected is whether or not it reflects a positive change (i.e. a decrease in the number of violations per mile). The reason why we try to find a positive message here is feedback technique FT1 (cf. Section 2.5). A negative change report is only selected if no significant positive change could be found (cf. lines 11 to 15). Even if the overall tendency was negative (e.g. an increase of all incidents by 50 %), a positive change report will be reported first, if other improvements can be found (e.g. a decrease of speeding inci-dents by 20 %), due to the aforementioned psychological reasons. The comparison is, of course, not part of the first feedback report.
The second text part consists of two paragraphs. These can either be one para-graph about single incidents and one about clusters, or one parapara-graph about speed-ing violations and one about acceleration and brakspeed-ing violations. This is again
cho-Algorithm 4Process of Document Planning
1: functionDocument Plan(metadata, violations, clusters, comparisons)
2: d←Document()
3: .heading
4: d←d.setHeading(metadata.start day, metadata.end day)
5: . summary
6: paragraph1←P aragraph()
7: summary←Summary(metadata.period, metadata.driven distance)
8: if variation1then
9: summary←summary.add(metadata.driven time)
10: end if
11: if comparisonscontains positive changethen
12: comparison←comparisons.select(positive, important)
13: else
14: comparison←comparisons.select(negative, important)
15: end if
16: summary←summary.add(comparison)
17: paragraph1←paragraph1.add(summary)
18: d←d.addP aragraph(paragraph1)
19: . map 20: d←d.addM ap(violations) 21: .detailed report 22: paragraph2←P aragraph() 23: paragraph3←P aragraph() 24:
25: if violationscontains speeding >20km/hthen
26: single incidents←violations.select(#<= 5, speeding >20km/h)
27: else
28: single incidents←empty
29: end if
30: speeding clusters←clusters.select(speeding,#<= 3, important)
31: accel clusters←clusters.select(acceleration,#<= 3, important)
32:
33: paragraph2←paragraph2.add(single incidents)
34: if variation1 then
35: paragraph2←paragraph2.add(speeding clusters)
36: paragraph3←paragraph3.add(accel clusters)
37: else
38: paragraph3←paragraph3.add(speeding clusters)
39: paragraph3←paragraph3.add(accel clusters)
40: end if
41:
42: d←d.addP aragraph(paragraph2)
43: d←d.addP aragraph(paragraph3)
44:
45: returnd 46: end function
sen randomly in order to add additional variation to the feedback reports, without influencing their impact (cf. lines 33 to 40). The content selection, however, is not influenced by these structural decisions: Up to five single speeding violations are selected for this part, but only the five with the highest absolute amount of speeding and only such violations that exceed the speed limit by at least 20 km/h (cf. lines 25 to 29). Moreover, up to 3 clusters of speeding violations (cf. line 30) and up to 3 clusters of braking and acceleration violations (cf. line 31) are selected based on their importance value, but only clusters which fulfil the minimum cluster size and the maximum inner distance can be selected. Therefore, if a driver drove in general very well during a week, even less important clusters, representing minor incidents, may be reported. However, if there are important violations to be reported, this less important information will probably not be reported.
Many studies (e.g. from Ye and Johnson (1995), Teach and Shortliffe (1987), and Weiner (1980)) suggest that it is crucial for the acceptance of feedback, especially from a computer system, that the feedback is presented in a form which allows the recipient to understand and reconstruct how conclusions were drawn. In other words, feedback has to be justified (FT3). Therefore, we decided to add a map to the feedback reports in which all violations are marked with pins (cf. line 20). Depending upon the type of the violation and its quantification, the pins have different colours. If one of the pins is selected, a bubble opens which provides further information regarding what occurred at the given position and when it occurred. All important statements in the text, such as the description of the clusters, the number of the worst speeding violations, among others, are links. If the user clicks on one of these links the map shows only the incidents which are part of what he or she clicked on, e.g. only the five worst single speeding violations or all violations that belong to a certain cluster, in order to justify this statement from the text. The map is realised with OSM and OpenLayers3.
3.6.4 Microplanning and Realisation
During the Microplanning and Realisation stage, the actual texts are produced based on the messages selected during the Document Planning. Our prototype uses SimpleNLG (Gatt and Reiter, 2009) for the surface realiser. An example feedback text is shown in Figure 10.
The first sentence of the first paragraph contains a summary of the driving ac-tivity during the feedback period. As mentioned previously, it is possible to vary the content of this sentence by adding or leaving out the amount of time that was driven. But it is also possible to vary the realisation so that there is a total of four different possibilities to express the same data. Driving 34 miles in 1 hour and 32 minutes in one week could, for example, be expressed as follows: “You drove 35 miles during the last week.”, “During the last week, you drove 35 miles.”, “You drove 35 miles in one hour and a half during the last week.” or “During the last
3
Driving Report 19 25 January
You drove 390 miles in 10 hours and 50 minutes during the last week. You reduced the number of speeding incidents per mile by more than 10 %, well done!
Five times you drove more than 30 mph too fast: On Castle Road, on Kirkton Road, on North Deeside Road and twice on A92. Going 30 mph slower could shorten your braking distance by 108 yards. You also speeded on 175 other occasions, 7 times on roads with 20 mph speed limit and 12 times on weekends on roads with 30 mph speed limit. You accelerated or braked harshly 645 times, mostly on highways and on roads with 20 mph speed limit.
Fig. 10: Feedback text
week, you drove 35 miles in one hour and a half ”. The numbers are rounded by up to 10% of their value in order to make the text more fluent. While all underlying data is always stored and processed in metric units, feedback reports can be created using both the metric and imperial system.
The second sentence of the first paragraph is a realisation of the selected change report, supported by an encouraging phrase if a positive change was detected. In order to increase variation in the generated texts, there are multiple encouraging phrases from which the system can choose, such as“keep up the good work”,“well done”, etc. However, the main variation in this sentence should come from changing behaviour. Some possible outputs are: “You reduced the number of speeding inci-dents per mile by nearly 10 %, well done!”, “You reduced the number of speeding incidents on highways by nearly 20 %, good job!”. If no positive change could be detected, the change is reported without an additional phrase. A possible output would be:“You increased the number of speeding incidents by nearly 20 %.”.
The second paragraph begins with up to five selected single speeding incidents. However, if none of the single speeding incidents met the criteria to be selected, the user is simply informed that they performed well:“You didn’t do any serious speeding, keep up the good work!”or“You didn’t do any serious speeding during the last week, keep up the good work!”. The encouraging phrase at the end can again be replaced by another randomly selected phrase.
If there were serious violations of the speed limit, their reporting starts with the number of selected violations and the infimum (greatest lower bound) of the abso-lute amount of speeding, e.g.“Five times you drove more than 30 mph too fast:” or “On five occasions you drove more than 30 mph too fast.”. This is followed by an enumeration of the name of the streets on which the incidents happened. In order to make the feedback more effective, we“provide information on consequences” as suggested by Abraham and Michie (2008): we highlight to the driver how speeding can influence the braking distance, e.g.:“Going 30 mph slower could shorten your braking distance by 108 yards”. As the example shows, a positive way to
communi-cate this fact is chosen (in opposite to“going 30 mph too fast extends your braking distance by 108 yards”) in order to avoid a patronising method of communication. If it was decided during the Document Planning that there is one paragraph about single speeding incidents and one about clusters, a new paragraph begins after this sentence. If there is one paragraph about speeding and one about acceleration and braking, the following sentence still belongs to the first paragraph. The next sentence is the realisation of up to three selected clusters of speeding incidents, which are described by the number of violations they cover, their common features and the total number of incidents, e.g.:“You also speeded on 163 other occasions, 15 times on roads with 20 mph speed limit and 13 times on motorways between 5 and 6 pm”. Afterwards, the process is repeated for the acceleration and braking clusters. If there were no serious speeding incidents, the sentence starts with“However, you speeded on X occasions”, instead of “You also speeded on X other occasions”. If no relevant clusters were identified, these sentences are omitted entirely. We also decided to highlight key passages and figures in the text by making them bold, in order to help users to identify the most important information in the text quickly.
4 Evaluation
In order to evaluate our system in a real world scenario, we conducted a short lon-gitudinal study using a protocol approved by the University of Aberdeen’s Ethical Review Board for the College of Physical Sciences. Drivers used the prototype over a period of four to five weeks, and we analysed their behaviour and whether or not it changed. Additionally, the participants were asked to rate the quality of the generated texts.
4.1 Participants
Six drivers used and evaluated the prototype during this period. Four participants used it for five weeks and two participants used it for four weeks. Since the appli-cation was publicly available in the Google Play Store and we wanted to maximise the privacy of our participants, no further information was gathered from or about them. The setup of this study placed high demands on the participants. Not only did they have to be willing to share their location data, they also had to use the app regularly over a long period of time.
4.2 Collected Data
Between August and September 2015 (calendar weeks 32 to 37), the six partic-ipants drove more than 4,000 kilometres in Germany and the United Kingdom, distributed over 129 single trips. More than 1,000 violations of the speed limit and more than 2,600 harsh brakings and accelerations were recorded during the study.
A total number of 27 weekly feedback reports were generated4 and rated by the participants.
As Figure 11 displays, the driven distance varies greatly between the different drivers. More than half of the overall distance was contributed by just two drivers (users A and C). We could also observe two different patterns with regard to the frequency of driving: one group (users A, C, and F) drove mostly the same routes repeatedly on a very regular basis, whereas the other drivers (users B, D, and E) drove less regularly and were rarely using the same route multiple times. In order to be comparable, the total number of incidents has to be normalised by the driven distance: 5 violations of the speed limit during a two kilometres drive is obviously not good driving, while 5 violations of the speed limit during two hundred kilometres seems to be rather acceptable. Although it seems reasonable to assume that the connection between the driven distance and the number of incidents is proportional, if the behaviour does not change, it is arguable if this also holds true for very short distances. We believe that very short distances are less suitable to capture general behaviour changes because they are more vulnerable to exceptional external influences such as unforeseeable misbehaviour of other road users (law of large numbers).
A B C D E F
0 500 1,000
Fig. 11: Driven distance in km by each user A – F
4.3 Control Group
We used the five drivers whose data was used for the development of the system (cf. Section 3.1) as a control group. They used an app, which collects data in the same manner as SaferDrive, for four to six weeks. However, they did not receive any feedback. In the future, it would be desirable to compare the textual feedback against the other, state-of-the-art, feedback technologies (namely scores and maps) in order to evaluate if the preference for the textual feedback, which was found in a lab setting by Braun et al. (2015), can be confirmed in a real-world scenario. However, at this point in time, we wanted to evaluate whether the textual feedback has any influence on the driving performance at all, and therefore, we used a control group which did not receive any feedback.
4 One participant did not drive at all during one week of the study, therefore the number is not 28 (4·5 + 2·4) but 27.
4.4 Evaluation Criteria 4.4.1 Ratings
With every weekly feedback report, the participants were asked to rate the gener-ated report in four categories on a scale from 0 (very bad) to 5 (very good). These categories were: “The text was easy to understand”, “The text was a good sum-mary of my driving”, “The text was encouraging” and “The feedback was helpful”. At the end of the study participants were asked to give overall ratings in the same categories and were additionally asked three questions which could be answered in a free text field. These questions were: “Would you use the app in the future?”, “What impact did the feedback have on you?” and “How would you improve the app?”.
4.4.2 Behaviour Change
The main question we wanted to answer with this evaluation was whether the feedback from our prototype can actually help the participants to improve their driving. There is more than one possibility to assess successful behaviour change in this setting. One could, for example, argue that the feedback is only successful if the number of incidents per kilometre decreases with every subsequent feedback report. However, that would be quite an unrealistic goal, especially since the dataset is rather small and single “outliers” would, therefore, have a relatively high impact. Moreover, we are aiming for a long-term behaviour change, which makes the overall development more important than the impact of a single feedback report. Therefore, we decided to define behaviour change in the evaluation as the difference between the number of incidents per kilometre during the first and the last week.
4.5 Limitations
The method in which data was gathered for this evaluation results in certain lim-itations. These limitations should be kept in mind when interpreting the results. Most of these limitations are a result of our dedication to provide as much privacy as possible to participants. Since the first and last mile (together∼3.2 km) were re-moved from each trip for privacy reasons, very short trips (i.e.<3 miles) could not be taken into account. This means that at least 412 kilometres that were driven by our participants were not included in the feedback generation, and are not part of this evaluation. Moreover, it is not known for certain whether participants recorded all of their driving or just some of it. They may have, accidentally or on purpose, not recorded certain trips. It is, for example, conceivable that some participants did not use the app when they were in a hurry, which could influence the amount of recorded violations.
External factors, like weather conditions or traffic density, could also potentially influence the results. However, since the participants drove in two different countries (control group in four different countries) and their starting dates were staggered, the potential influence of these factors was reduced. The results could also be