Analysis of Textual and
Non-Textual Sources of Sentiment
in Github
by
Nalin De Zoysa
A thesis
presented to the University of Waterloo in fulfillment of the
thesis requirement for the degree of Master of Mathematics
in
Computer Science
Waterloo, Ontario, Canada, 2020
Author’s Declaration
I hereby declare that I am the sole author of this thesis. This is a true copy of the thesis, including any required final revisions, as accepted by my examiners.
Abstract
Github is a collaborative platform that is used primarily for the development of software. In order to gain more insight into how teams work on Github, we wish to analyze the sentiment content available via communication on the platform.
In order to do so, we first use existing sentiment analysis classifiers and compare the Github data to other social networks, Twitter and Reddit. By identifying that users are able to provide reactions to other users posts on Github, we use this as an indicator or label of sentiment information. Using this we first investigate whether repeated user interaction has an impact on sentiment and find that it is positively correlated to the amount of prior interaction as well as the directness of interaction. We also investigate if metrics corresponding to a user’s status or power in a project correlate with positive sentiment received and find that it does.
We then build sentiment classifiers using both textual and non textual informa-tion, both which outperform the generic sentiment scorer systems. In addition we show that a sentiment classifier built using only non-textual information can perform at a comparable level to that of a text-based classifier, indicating that there is sig-nificant sentiment information contained in non-textual information in the Github network.
Acknowledgements
I would like to thank my supervisor Prof. Jesse Hoey for all his help and support, which has been invaluable. I would also like to thank Prof. Daniel Berry and Prof. Mei Nagappan for agreeing to read my thesis and providing helpful feedback.
I would also like to thank Moojan, Neda, Rahul, Aaron, Josh, Alex Y, Alex S, Aaron and all the members of the CHIL group.
Dedication
Table of Contents
List of Figures viii
List of Tables x
1 Introduction 1
2 Related Work 5
2.1 Sentiment Text Scorers . . . 5
2.1.1 Sentistrength . . . 5
2.1.2 LIWC . . . 6
2.1.3 ANEW. . . 6
2.1.4 VADER . . . 7
2.1.5 NRC-Lexicon . . . 7
2.2 Sentiment in Software Engineering projects . . . 8
2.3 Neural Networks . . . 10
2.4 Long Short Term Memory Networks. . . 11
3 Sentiment content in Github compared to other networks 13 3.1 Methodology . . . 13
3.1.1 Further sentiment dimensions . . . 16
4 Distant Supervision Learning of Github Reactions 23 4.1 Reaction Data . . . 24 4.2 Graph metrics . . . 33 4.3 Following . . . 35 4.4 User-specific features . . . 35 4.4.1 Contributions . . . 36 4.4.2 Closes . . . 37
4.4.3 Number of Followers and Following . . . 38
4.4.4 Centrality . . . 39 5 Classification Models 42 5.1 Deepmoji . . . 42 5.2 Non-Textual Classifier . . . 48 5.3 XGBoost . . . 49 6 Analysis 52 7 Conclusions 55 References 57
List of Figures
2.1 Recurrent Neural Network and unravelled equivalent . . . 11
2.2 Long Short Term Memory Cell Structure . . . 11
3.1 Sentiment content scored by VADER . . . 15
3.2 Sentiment content scored by Opinion Lexicon . . . 16
3.3 Arousal content . . . 18
3.4 Dominance content . . . 19
3.5 Log sentiment scored by VADER . . . 20
3.6 Screenshot of a Github post with reactions . . . 22
4.1 Table of possible Github reactions . . . 25
4.2 Scatterplot of userpair ratio and number of times user seen . . . 30
4.3 Boxplot of userpair ratio and number of times user seen . . . 30
4.4 Scatterplot of userpair ratio and number of times user mentioned . . 31
4.5 Boxplot of userpair ratio and number of times user mentioned . . . . 31
5.1 Deepmoji Architecture . . . 43
5.2 Chainthaw fine tuning method used in Deepmoji . . . 43
5.3 Deepmoji trained on Github data confusion matrix . . . 44
5.4 Sentistrength on Github data confusion matrix . . . 45
5.5 VADER on Github data confusion matrix . . . 46
5.7 XGBoost Confusion Matrix . . . 50
List of Tables
3.1 Sentiment scorer rankings . . . 14
3.2 Mann Whitney and Kolmogorov-Smirnov tests results . . . 17
3.3 Arousal and Dominance rankings . . . 17
3.4 Percentage of neutral posts . . . 19
3.5 Mean sentiment of classified posts . . . 21
4.1 Positive reactions percentage based on user interaction . . . 26
4.2 Positive reactions percentage based on user interaction for project subsets . . . 27
4.3 Mean userpair ratio based on user interaction . . . 28
4.4 Spearman correlation coefficient of userpair ratio and number of in-teractions . . . 28
4.5 Spearman correlation coefficient of userpair ratio and number of in-teractions for users who have already interacted with each other . . . 29
4.6 Spearman correlation distribution over all projects . . . 29
4.7 Percentage of positive reactions based on graph of user’s seeing each other . . . 33
4.8 Mean userpair ratio based on user seen graph connection . . . 33
4.9 Percentage of positive reactions based on graph of users mentioning each other . . . 34
4.10 Mean userpair ratio based on users mentioning each other . . . 34
4.12 Positive reaction percentage based on users following each other . . . 35
4.13 Mean userpair ratio based on users following each other . . . 36
4.14 Positive reaction percentage based on user contributions . . . 36
4.15 Mean positive reaction ratio based on number of contributions . . . . 37
4.16 Spearman correlation of user positive reaction ratio and number of contributions . . . 37
4.17 Positive reaction percentage based on number of closes . . . 38
4.18 Mean user positive reaction ratio based on number of closes . . . 38
4.19 Spearman correlation of user positive reaction ratio and number of closes . . . 39
4.20 Positive reaction percentage based on number of followers. . . 39
4.21 Mean user positive reaction ratio based on number of followers . . . . 39
4.22 Positive reaction percentage based on number of following . . . 40
4.23 Mean user positive reaction ratio based on number of following . . . . 40
4.24 Spearman correlation of user positive reaction ratio and number of followers and following . . . 40
4.25 Spearman correlation of user positive reaction ratio and user centrality 41 5.1 Classification report for Deepmoji trained on Github data . . . 44
5.2 Classification report for Sentistrength on Github data . . . 45
5.3 Classification report for VADER on Github data . . . 46
5.4 Classification report for Opinion Lexicon on Github data . . . 47
5.5 Classification summary for classifiers on Github data . . . 48
5.6 Classification report for XGBoost . . . 50
Chapter 1
Introduction
Online based collaboration in and out the workplace is on the rise and has been increasingly been a part of people’s personal, professional and academic life. In a survey conducted in 2017 by a leading web conferencing solution PGi, 88% of professionals utilize online collaboration tools at least once a week [34]. This is an increasing reality especially in the field of software development, where more and more team interaction is relegated to online collaboration tools such as Github.
Github is an online collaborative tool aimed at software development, providing a platform for a team to host its code via the Git versioning control system. It also provides features such as allowing users to create posts known as issues, which indicates that there is a problem, feature request, or other general issue in the project which needs to be addressed. Users can then reply to each other and converse on these threads. When an issue has been resolved, the status of the issue is changed from open to closed. That can be done by either the issue creator or an administrator of the project. In addition to issues, users can also submit requests of addition of code to the project, known as a pull request. A pull request is a platform where users can discuss the code being proposed to be added to the project and whether there are issues with the proposed changes or if it can be merged into the project. Github provides also the familiar social media feature of being able to follow other users.
In online collaboration platforms such as Github and other social networks, the primary form of communication is via text. One of the primary methods used to systematically analyze text has been he field of sentiment analysis, which is the technique of extracting subjective information from text, in the case of textual sen-timent analysis. Some of the first algorithmic sensen-timent analysis techniques were
based around identifying whether reviews of products or movies were positive or negative [62], also known as the valence of statement. Since then other dimensions have been identified in sentiment analysis, such as arousal and dominance [33]. It is also important to note that non-verbal communication also plays a large role in communication in general. There have been widely cited studies indicating that a large part of communication, even a majority of communication may be non-verbal [18].
There has been a vast array of research [3], [50], [53] that indicates people who are happy are able to perform better at their work, are more creative and learn more. In a study conducted in 2009, it was found that happier workers experienced 10-12% greater productivity, and indicated that emotional well-being can be a causal force of workplace productivity. Positive sentiment has also found to have a direct linear relationship with creativity in the workplace [1].
It follows therefore that the sentiment of a work group can be a key factor in the success of team and their projects. While in-person interviews are one way of assessing the sentiment of an individual, this approach is clearly faces challenges when it comes to situations where members are working remotely and collaborating online only. As a result, an automated sentiment detection system could prove to be quite useful. Some benefits of an automated system includes less time taken to obtain sentiment than by conducting member interviews, the ability provide a finer grained view of sentiment such as indicating the sentiment content of specific messages or comments, and that it does not have to rely on the willingness of a member to take part in an interview or survey.
The scale at which sentiment can be determined manually by humans is poten-tially smaller compared to what we could acheieve through an automated system. It can also be a challege to obtain reliable assessments of sentiment from a limited num-ber of humans assessing sentiment, as they may misinterpret terms or context. In order to get the best understanding of how a team works on a platform like Github, we want to not only be able to assess the sentiment of as much communication on the platform as possible, but also ensure that the sentiment we extract is as accurate as possible.
The first thing that we want to investigate is how much sentiment content is actually contained in Github as a platform in general. In order to do this we will compare it to other social networks, namely Twitter and Reddit. As a part of this task, we will attempt to determine what is the best way of extracting sentiment from Github. This involves looking into whether standardized generic sentiment analysis systems are appropriate or whether a more specialized is required or is useful. We
next want to investigate how does past user interaction affect subsequent sentiment that is expressed on Github, and whether these effects are strong enough to use to predict sentiment. The power or status that a member holds in a team could also be a factor that affects the sentiment that they receive, and so we investigate what sort of influence these factors have on sentiment. Finally we will investigate how much sentiment content is contained in both textual and non-textual sources in Github.
As a result, the work of this thesis spans a variety of disciplines. We touch on software engineering considering the way specifically programming teams work and interact on Github. Analyzing the sentiment content of text in networks such as Github involves the field of Natural Language Processing, and using both textual and non-textual information to train classifiers more broadly involves the field of Machine Learning and Artificial Intelligence.
As a result of the work in this thesis, we are able to show that according to standard generic sentiment analysis techniques, it appears that there is a lower level of sentiment content in Github than in Twitter and Reddit. We then are able to identify that there is a way to extract sentiment data directly from the Github data we obtain without having to rely on generic sentiment analysis tools. Using this data, we are also able to provide evidence that prior and repeated interaction between users have a positive correlation with the probability of subsequent positive reactions between users. We then identify specific factors that relate to the status or power of a user in a project, such as the number of contributions a user makes, the number of issues or requests they close, number of their followers, or their centrality in a project. It is then shown that these factors also positively correlate with the probability of a user receiving a positive reaction. Finally, based on both textual and non-textual data, we train sentiment classifiers which are shown to outperform the existing sentiment analysis tools. We also show that we are able to train a sentiment classifier based on only non-texual data which has comparable performance to a text-only based sentiment classifier for the Github data.
In this thesis, the main questions we want investigate are:
1. How does the sentiment content of Github compare to other social networks such as Twitter and Reddit?
2. What is the best way to analyze sentiment on a platform such as Github? 3. How does user interaction affect sentiment on Github?
5. How much sentiment information is contained in non-textual information on Github?
The main contributions of this thesis are:
1. Perform an analysis of the sentiment content in Github compared with Twitter and Reddit
2. Provide evidence that prior and repeated interaction between users have a positive correlation with probability of positive sentiment between users in Github projects
3. Show that factors which contribute to the status or power of a user in a Github project also positively correlate towards positive sentiment
4. Demonstrate that generalized sentiment detectors do not perform effectively in networks such as Github
5. Provide an implementation of a textual classifier that vastly outperforms gen-eralized sentiment detectors
6. Show that non-textual information related to prior user interaction and user status and power can be used to create a sentiment detector that can perform with comparable results to a text-based classifier.
Chapter 2
Related Work
2.1
Sentiment Text Scorers
Over time there have been a variety of classifiers designed to extract sentiment from text, which will be referred to as sentiment scorers. A variety of these sentiment scorers were used to extract and analyze the sentiment content of Github and other social networks.
2.1.1
Sentistrength
Sentistrength [60] is a text based sentiment scorer which was primarily designed to extract sentiment from social media. Most initial sentiment scorers were designed and trained based on text information from commercial sources, namely consumer product reviews and movie reviews. These were chosen since they provide a large corpus of labelled data. That is, along with the text of a review, you also have the user provide a score, indicating if the review is positive or negative. As a result, this data was a prime choice to use to train sentiment classifiers. It was found that these systems do not perform well on text from the social web, which is a problem that Sentistrength seeks to address. Sentistrength was able to outperform baseline classifiers over a diverse set of of six social websites, namely MySpace, Youtube, Digg, Twitter, BBC Forums and Runners World.
Sentistrength employs a combination of traditional Machine Learning classifica-tion techniques and the use of a lexicon. Lexicons are word lists that are generated either manually or programmatically, which assigns positive or negative values to
specific key words. They have shown to be effective and popular in creating general sentiment scorers. Based on a combination of both techniques, Sentistrength assigns a score to a piece of text provided to it from -4 to 4, 4 being the highest level of positive sentiment and -4 being the highest level of negative sentiment. It also does support classifying text as neutral, that is to say that Sentistrength considers it to have no sentiment content at all.
2.1.2
LIWC
Linguistic Inquiry and Word Count (LIWC) [46] is a text analysis program developed by Pennebaker, Booth, and Francis which is able to categorize words into psycholog-ically meaningful categories [59]. It compares each word in a document against its own internal dictionaries and assesses what categories a specific word is contained in. It categorizes words into not only standard linguistic dimensions, such as pronouns, verbs, adjectives and prepositions, but also categorizes whether words are part of dif-ferent psychological categories, such as positive emotions, negative emotions, anxiety and many others. There are over 80 different categories which LIWC can classify a word into. In order to develop these category dictionaries, text files from several studies totalling over 100 million words were analyzed. It has also been shown that certain personality traits correspond with LIWC categories [59], [35], [47]. LIWC has been validated by psychologists, sociologists, and linguists [20] and has been used in a variety of applications such as determining political sentiment from tweets [61] and identifying unhappy or happy romantic couples based on their instant messaging text communications [17].
2.1.3
ANEW
Affective Norms for English Words (ANEW) [6] is an affective word list, alternatively known as a sentiment lexicon, which provides normative emotional ratings for a set of 1,034 words [20], [41]. The words are ranked based on the dimensions of pleasure, arousal and dominance from 1-9, with 5 being a neutral point. Words which are ranked lower than 5 are considered unpleasant or negative and words ranked greater than 5 are considered to be pleasant or positive. ANEW has been used extensively in sentiment analysis projects, including measuring the intensity of sentiment in social media posts [9], [41]. Similar to Sentistrength, ANEW is able to give the intensity of sentiment on a scale, versus LIWC which only indicates if a word is determined
to be part of a certain category or not. Unlike Sentistrength, ANEW was developed before the advent of social media and microblogging [41].
2.1.4
VADER
VADER [20] is another sentiment scorer which utilizes a simple lexicon based system that has shown to be comparable or outperform other industry standard sentiment analysis scorers such as LIWC, ANEW or standard Machine Learning techniques such as Naive Bayes or Support Vector Machines. Like Sentistrength, when given text to score, VADER provides a score ranging from -1 to 1, indicating positive or negative sentiment, with 0 being neutral sentiment.
The lexicon that VADER provides was derived from getting 10 independent pre-screened human raters to assess the sentiment level of a list of words from a scale of -4 being extremely negative to 4 being extremely positive. Every term that had a non zero mean rating and a standard deviation of less than 2.5 was selected for the lexicon.
One of the main advantages of VADER is that the Lexicon is user replaceable and so lexicons created by other organizations can be easily used, or one can be created for a specific purpose. In addition, dimensions other than sentiment valence can be obtained through VADER by replacing the lexicon. The level of sentiment on the dimensions of arousal or dominance can be obtained by simply using an arousal or dominance lexicon.
2.1.5
NRC-Lexicon
NRC-Lexicon [39] is another lexicon which was developed by the National Research Council Canada. It was also obtained through human annotating of words, but unlike VADER which used pre-screened volunteers, NRC-Lexicon utilized Amazon Mechanical Turk, a service used to crowd source paid participants. As mentioned previously, lexicons such as NRC-Lexicon can be utilized with the VADER system by replacing VADER’s built in lexicon with it, and the same scoring scheme of a score from -1 to +1 can be obtained. The National Research Council also provides lexicons for arousal and dominance, obtained through similar means. The NRC Lexicon has been extensively used across many projects related to sentiment analysis and is considered a benchmark scorer.
Despite the NRC Lexicon being created and designed in English, it was found that simply translating the lexicon to other languages proved very effective at extracting sentiment as well, and that the majority of affective terms are stable across languages. As a result NRC also provides their lexicon in over 100 languages, translated via Google Translate.
2.2
Sentiment in Software Engineering projects
There has been a variety of work done in assessing the sentiment content of Software Engineering projects such as Github and Stackoverflow.Sinha et al. [57] utilized Sentistrength to analyze the commit messages of 28,466 Github projects. They found that majority of the sentiment found in the commit messages were neutral, but that there was approximately 10% more negative senti-ment found than positive sentisenti-ment, and that commits on Tuesday seemed to have the most amount of negative sentiment. In addition they found that there was a strong correlation between the number of files changed and the strength of senti-ment found in the commit message.
Pletea et al. [48] performed an analysis of discussions related to security from Github pull requests and commits. They used a dataset of 54,892 pull requests and 60,658 commit comments, and found that approximately 10% of all discussions on Github were related to security and the sentiment of these discussions were largely negative. In order to determine sentiment, they used the Natural Language Toolkit [31], a Python based sentiment and natural language processing library.
Iyer [23] utilized theIBM Watson Personality Insights service to analyze the text of pull requests of 16,935 users from 1,860 Github projects and determined the ’Big Five’ (Openness, Conscientiousness, Extraversion, Agreeableness, and Neuroticism) personality traits of users of these projects. He found that the pull requests from users who have higher levels of openness and conscientiousness are more likely to be approved. Pull requests that were closed by users who had higher levels of consci-entiousness, extraversion and neuroticism were more likely to be accepted as well. He found that the larger difference between personality traits between requester and closer of a pull request, the greater the likelihood that it would accepted. It was also found that that the greater the percentage of positive comments made by the pull request closer and requester led to a higher likelihood of pull request accep-tance. Conversely the higher the percentage of negative comments resulted in a lower acceptance likelihood of pull request acceptance.
Novielli et al. [42] utilized tools such as Sentistrength to assess the sentiment content in Stack Overflow comments. They were able to find that even when using the state-of-the-art tools, polarity alone was not sufficient to capture the actual feeling or attitude of a comment or piece of text. They recommended that a more fine-grained look at emotion when dealing with such text.
Ram et al. [49] identified that sentiment analysis has found to be challenging when looking at software engineering text, due to the technical nature of the vocabulary. They were able to create a state-of-the-art sentiment classifier using deep learning techniques that was able to outperform existing tools on specific software engineering datasets such as app reviews and JIRA bug tickets.
Islam et al. [22] performed a study where they analyzed the sentiment content of more than 490,000 commit comments over 50 open source projects, by utilizing Sentistrength as well. In order to address the challenge of software engineering specific terms which have ambiguous or neutral sentiment content, they created their own supplementary word list to augment the score provided by Sentistrength. They were able to categorize users into profiles that were either mostly positive, mostly negative or mostly neutral. Unlike the study done by Sinha et al. they found no specific variation in sentiment over time of day or during the week. They were also able to determine that when users were more emotionally active they tended to post longer commit messages.
Rishi [52] collected a dataset of 834 pull requests and 3000 comments from Github, which was then labelled by four people regarding the sentiment expressed. The set of possible emotions that were labelled were nervous, careless, happy, thanks, sorry, calm, nervous, careless, cautious, aggressive, defensive, and angry. They were also labelled based on Interaction Process Analysis labels, which were of the following: ’Shows solidarity’, ’Shows tension release’, ’Agrees’, ’Gives suggestion’, ’Gives opin-ion’, ’Gives orientatopin-ion’, ’Asks for orientatopin-ion’, ’Asks for opinopin-ion’, ’Asks for sugges-tion’, ’Disagrees’, ’Shows tension’ and ’Shows antagonism’. Based on this labelled dataset he created a 1-vs-all classification system for each sentiment and concluded that automated detection of these sentiments posed a considerable challenge.
While the previous studies focused on commit messages, Destefanis et al. [43] analyzed over 370K comments from over 100k Github issues. As part of their analysis they separated the Github userbase into users and commenters. Users are people who submit code to a project as well as comment, whereas commenters are people who only leave comments in a Github project. They found that commenters are less polite and less positive than users. They also provided empirical evidence that ther are different categories of users in Github and that they behave differently.
2.3
Neural Networks
Apart from Lexicon based sentiment scorers, one of the leading Machine Learning techniques used to extract information from text is the use of neural networks.
An Artificial Neural Network (ANN) is a form of a classifier that is loosely mod-eled on the human brain and the biological neural networks that they consist of [26]. The primary component of this model is an artificial neuron, which is a mathemat-ical function that is designed to loosely imitate a biologmathemat-ical neuron. Each artificial neuron receives input signals and outputs a non-linearly transformed output, which can then be propagated to other neurons in the network. For a neuron with n+1 inputs, and input signals denoted from x0 to xn and weights being w0 to wn, the formula of the output of artificial neuron is shown in equation 2.1. The transfer function is given by ϕ, which typically has a sigmoid shape. At the minimum, an ANN consists of an input layer of neurons, which receives the input information to be classified, an output layer, which provides the output of the classification and possibly any number of layers in between, known as hidden layers.
yk =ϕ n X j=0 wkjxj ! (2.1)
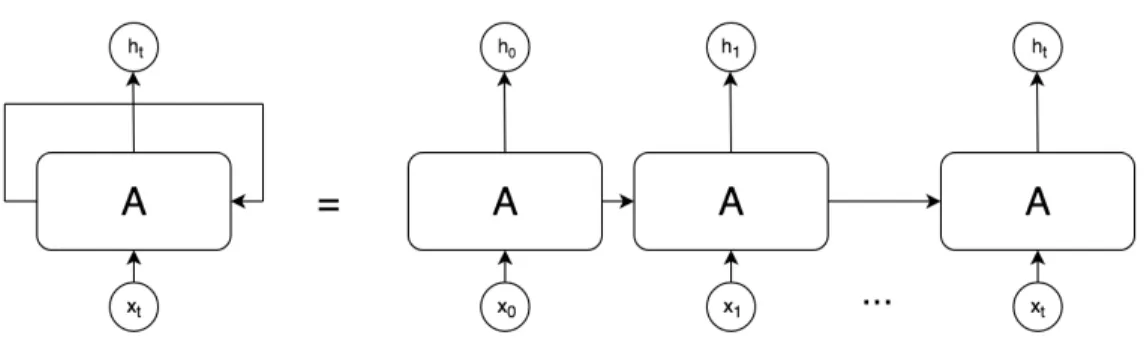
Feedfoward neural networks were the first implemented ANN and considered to be most basic design [56]. The main feature of design is that neurons in the network only propagates data forward throughout the network, and it contains no loops or cycles. When it comes to information such as understanding the meaning of text, context is something which is quite important. The meaning of a single word or phrase can be ambiguous in isolation or change depending on the surrounding words and overall context. Based on the work first done by David Rumelhart [54], a Recurrent Neural Network (RNN) addresses this issue by allowing feedback loops, in contrast to traditional Feedforward neural networks. These loops enable the persistence of data, which acts as a form of storage for the network which it can have direct control over. The basic architecture of an RNN is shown in Figure2.1. Here we can see that the network can also be visualized as series of copies of networks, with each network providing an output to the subsequent network.
Figure 2.1: Recurrent Neural Network and unravelled equivalent
Figure 2.2: Long Short Term Memory Cell Structure
2.4
Long Short Term Memory Networks
While RNNs should in theory be able to retain memory of previous tasks after many cycles or “long term”, in practice we find that their design seems to fundamentally
not be able to retain long-term dependencies, and information tends to be quickly “forgotten” or not retained. In order to tackle the long-term dependency issue, Long Short Term Memory (LSTM) networks were proposed by Hochreiter and Schmid-huber [19]. The standard unit of these networks consist of a cell with an input, output and forget gate. These are used to determine what information the network should retain and what it should “forget”, hence facilitating it to persist important information long term.
Figure2.2 shows the structure of an LSTM cell with a forget gate, which is also described by the equations:
ht=ot◦σh(ct) it=σg(Wixt+Uiht−1+bi) ˜ ct=σh(Wcxt+Ucht−1+bc) ct=ft◦ct−1+it◦˜ct ft=σg(Wfxt+Ufht−1+bf) ot=σg(Woxt+Uoht−1+bo)
Here xt is the input to the LSTM unit, ft is the activation vector for the forget gate, it is the activation vector for the input gate and ot is the output activation vector. ct is the cell state and ˜ct is the cell input activation vector, b are the bias vectors parameters while W and U are weight matrices, which during training are learned. LSTMs were used to train a text based sentiment classifier for the Github data inchapter 5.
Chapter 3
Sentiment content in Github
compared to other networks
3.1
Methodology
In order to get a general understanding of the sentiment content across Github as compared to other social networks such as Reddit and Twitter, standard sentiment analysis classifiers were used. The work by Ribeiro et al. [51] provided a benchmark comparison of state-of-the-practice sentiment analysis methods across a variety of datasets created from internet posts such as social media posts and website com-ments. This work was used as a starting point to select a few candidate sentiment scorers. We constructed datasets by pulling posts dating between the years of 2018 to 2019 from the public APIs of Github, Twitter and Reddit. We were able to collect 3,319,369 unique Twitter posts, 2,082,076 unique Reddit posts and 4,358,802 unique Github posts. All posts were filtered to ensure that the text content was English only and content such as links, usernames and emails were removed. We then used a selection of sentiment scorers to analyze the Github, Reddit and Twitter datasets. Majority of the scorers rated on one dimension of sentiment, namely valence, which indicates how positive or negative a post is. Most scorers would produce a positive, negative and overall score as a result for each part of text analyzed. For our purposes we decided to take the summation of the absolute value of both positive and negative metrics rather than the overall score. The reason for this is that if there were an equal score of both positive and negative sentiment as scored by the Sentistrength scorer, the overall score would give it an overall low or neutral sentiment score. What
we are looking for is raw sentiment content, not whether the overall sentiment of a post is neutral, or whether the positive and negative aspects of a post cancels each other out. If there is both high negative and high positive sentiment in a post, this can be quite useful for gaining insight into group member behavior, compared to a post which does not have much sentiment content at all.
The Github, Twitter and Reddit datasets were scored by three sentiment scorers, namely Sentistrength, VADER and Opinion Lexicon. The table for the rankings of each scorer are shown in Table3.1.
Rank Dataset Mean Std. Dev.
1 Reddit 0.21 0.18
2 Twitter 0.21 0.21
3 Github 0.13 0.16
(a) VADER sentiment ranking
Rank Dataset Mean Std. Dev.
1 Reddit 0.17 0.17
2 Twitter 0.13 0.16
3 Github 0.09 0.12
(b) Opinion Lexicon sentiment ranking Rank Dataset Mean Std. Dev.
1 Reddit 0.21 0.18
2 Twitter 0.21 0.21
3 Github 0.13 0.16
(c) Sentistrength sentiment ranking Table 3.1: Sentiment scorer rankings
From Table 3.1, we can see that for all the scorers Github ranks as the lowest for the mean and Reddit being the highest and Twitter being in the middle. Since the relative ranking results are consistent across all scorers, this indicates to us that indeed there is a consistent discrepancy between the different datasets, rather than it being an anomaly of a specific scorer. In order to more clearly see the sentiment distributions, they have also been plotted on histograms as can be seen below in Figures 3.1 to 3.2.
In order to correctly compare the different distributions, we need to first verify whether they can be said to be from independent distributions. Two tests which can be used to do this are the Mann-Whitney U-test and the Kolmogorov-Smirnov test. The Mann-Whitney U-test first ranks all the values from low to high, and then computes ap-value that depends on the discrepancy between the mean ranks of the
(a) Github sentiment content (b) Reddit sentiment content
(c) Twitter sentiment content
Figure 3.1: Sentiment content scored by VADER
two groups. The Kolmogorov-Smirnov test compares the cumulative distribution of the two data sets, and computes a p-value that depends on the largest discrepancy between distributions. The Kolmogorov-Smirnov test is sensitive to any differences in the two distributions. Substantial differences in shape, spread or median will result in a small p-value. In contrast, the Mann-Whitney U-test is mostly sensitive to changes in the median. In addition, the Mann-Whitney U-test can in general handle ties better than the Kolmogorov-Smirnov test.
Both the Mann-Whitney U-test and Kolmogorov-Smirnov test were run on the different distributions and all tests showed that each distribution was distinct, as can be seen in Table 3.2.
Since we can verify that indeed the datasets are from different distributions, we can confirm that, according to a variety of generic sentiment scorers, Github does have overall lower sentiment content compared to Reddit and Twitter (and others
(a) Github sentiment content (b) Reddit sentiment content
(c) Twitter sentiment content
Figure 3.2: Sentiment content scored by Opinion Lexicon
such as stack overflow). This result does seem to agree with our overall intuition, and also agrees with findings found in previous study performed by Islam et al. [22], which found that majority of the sentiment content in Github commit messages were neutral. We are posed with the question of whether this is truly the case, or if it is simply an inability of generic sentiment scorers to extract the sentiment from the Github dataset.
3.1.1
Further sentiment dimensions
Several influential factor analysis studies have shown that the primary dimensions of word meaning are valence, arousal, and dominance (VAD) according to Osgood et al. [44]. Valence is considered the positive or negative dimension, arousal is the active or passive dimension and dominance is the powerful or weak dimension. While the
KS p-value MW p-value Reddit, Twitter <0.001 <0.001 Twitter, Github <0.001 <0.001 Github, Reddit <0.001 <0.001
Table 3.2: Mann Whitney and Kolmogorov-Smirnov tests results
primary concern of this project was looking at the valence component, the arousal and dominance components were also analyzed. In order to do so, the NRC VAD Lexicon was used, which is a lexicon of words ranked by each of the three VAD dimensions, created by the National Research Council of Canada.
The same Github, Reddit and Twitter datasets were scored on the dominance and arousal sentiment dimensions and the rankings are shown in Table3.3. Similar to the valence scoring, Reddit ranks the highest for both dominance and arousal, while Github ranks the lowest for both dimensions. The values were also plotted on histogram as shown in Figures 3.3 and 3.4. However, unlike the valence scores, the difference between the datasets on the dominance and arousal dimensions are a lot closer together. Overall the dimensions appear to have a significant correlation between each other which is also attested to by the work in Mohammed et al. [37], the author of the lexicon. As a result, for the rest of the analysis only the valence dimension was looked at, since we can assume that the other dimensions will more or less follow.
Rank Dataset Mean Std. Dev.
1 Reddit 0.44 0.21
2 Twitter 0.42 0.15
3 Github 0.42 0.17
(a) Dominance ranking
Rank Dataset Mean Std. Dev.
1 Reddit 0.43 0.21
2 Twitter 0.41 0.15
3 Github 0.40 0.17
(b) Arousal ranking Table 3.3: Arousal and Dominance rankings
(a) Github arousal content (b) Reddit arousal content
(c) Twitter arousal content Figure 3.3: Arousal content
3.2
Analysis
As can be seen from the histograms of the sentiment distribution shown in Figure
3.1 and 3.2, there is a large number of posts which are classified as having no or close to no sentiment content. When the log value of the distribution is taken, the neutral values become far more evident as can be seen in Figure3.5. By using this technique we can identify the neutral posts in a dataset and show the percentage of neutral posts for each dataset as shown in Table3.4.
Since the generic sentiment scorers are designed and trained for generic datasets, it does stand to reason that they would not be able to extract all the sentiment out of a more technical dataset. An example of this would be the term “merge”, which in the context of a pull request could be a term with a lot of sentiment content. The notion of merging a pull request is generally very positive. Another example is using
(a) Github dominance content (b) Reddit dominance scored
(c) Twitter dominance scored Figure 3.4: Dominance content
Neutral posts Github 51.20% Reddit 40.19% Twitter 28.50%
Table 3.4: Percentage of neutral posts
the term “indentation” as a comment in a pull request. This is typically used to indicate some sort of action, typically a call to fix indentation. In a programming context, even just the standalone comment of “indentation” makes it clear that it is a call to action. In a generic context, the term indentation alone is not considered to be an action item or a word which contains much sentiment. There are a whole host of other words which can contain more sentiment in specific contexts or sub
(a) Github log sentiment (b) Reddit log sentiment
(c) Twitter log sentiment
Figure 3.5: Log sentiment scored by VADER
communities that are not captured by generic sentiment scorers.
Another factor may be that simply due to the nature of the different networks, there actually is overall lower sentiment being expressed. Github projects can be considered to be more of a professional context and could be less likely to express strong sentiment as compared to the typical user of platforms such as Reddit or Twitter. Such networks are primarily not professional and the typical user may speak more freely and informally which will could result in a higher sentiment level. It is also possible that sentiment may be expressed on Github in a more contextual manner. More context may be needed in order to determine the sentiment content of a post, such as previous posts in a thread or the impression of the author of a post that the reader may have. For example, if the reader of the comment has the impression that another person is generally more rude and authoritative, posts that would otherwise seen neutral may come across as more harsh. Similarly if a person
typically wrote longer posts with a kinder tone, a short post from this person may come across as curt or rude.
The social network structure of the networks themselves may also play a role into the type of communication that transpires and the sentiment content. Posts could be classified as either being specifically addressed to no one in particular, or rather the overall network (broadcast), addressed to one specific person (transactional, one-on-one), or addressed to multiple people (group-post).
For Github, the opening pull request post could be classified as a broadcast post, since it is posted to the overall project, addressed generally to one one in particular. Comments within a pull requests can be addressed to a specific person by mentioning a specific username with the at (@) prefix. These posts were classified as a direct one-to-one post. Post replies in a pull request thread which were not addressed to anyone in particular, or with multiple usernames mentioned were considered to be a group post, since it could be inferred that such a message was addressed to everyone or multiple people in the group. For Reddit and Twitter similar classifications were used, based on how many usernames were addressed in a post, since they also support addressing posts to users via username mention. The mean sentiment score of these interactions are shown in the Table3.5. We see that direct replies have a higher level of sentiment content compared to multi replies for all datasets. The effect seems to be especially pronounced in the Reddit dataset but it is currently unclear as to why this is, potentially due to the inherent differences between the networks.
Direct Reply Multi Reply
Github 0.15 0.13
Twitter 0.16 0.16
Reddit 0.18 0.13
Table 3.5: Mean sentiment of classified posts
Another source of sentiment content available in Github is by means of “reac-tions”. Github provides the feature where a post, such as a pull request or a comment can be responded to with one of a limited set of emojis, referred to as reactions. An example of a post with reactions is shown in Figure 3.6. These reactions have an inherent sentiment content, with them being able to be easily classified into positive or negative categories. These reactions not only are a source or sentiment content, but they also act as a form of indirect data labeling, which can be used to identify sentiment. This technique is known as Distant supervision, and has been used by
Mohammed et al. [38]. Distant supervision is a method of supervised text classifi-cation wherein the training data is automatically generated using certain indicators present in the text.
Figure 3.6: Screenshot of a Github post with reactions
Utilizing distant supervision based on Github reactions has not been performed before, and it should be possible to replicate similar results that Mohammed et al.[38] obtained using this technique with Twitter data. As a result it may be possible to extract sentiment content in the large number of neutral posts found in Github.
Chapter 4
Distant Supervision Learning of
Github Reactions
As previously described, the techniques used to analyze the sentiment content of the different social media datasets depends on knowledge transfer from a generic area to a more specific one. In order for a generic sentiment scorer to be effective across many different types of datasets, it has to sacrifice the ability to identify parts of information which are specific to the particular application. In the case of Github, the vocabulary used is likely to be quite different from typical vocabulary used on Twitter. Github is primarily used for technical content and therefore inherently the type of language used will be different. In addition since it primarily deals with coding, there is another level of specificity of the vocabulary. There are also terms used specifically to the platform of Github itself. For example the term “pull request” or the abbreviation “PR” has a very specific meaning in the context of Github, but would not have much meaning outside of it.
As part of our research, previous attempts had been made to reach out to Github users in order to ask them to manually provide information about the sentiment of their posts and comments, but it was met with little or no response. This could have been pursued further but it would be unlikely that enough people would have responded or that we would be able to obtain a sufficient size of information. People may be reluctant to respond for a number of reasons, anonymity being one of them, or simply not wanting to reveal personal emotional information.
Utilizing the reaction information however gives us access to a large set of pseudo labelled data. Previous work looking at this was done by the DeepMoji project [13] which attempted to link the emoji used in a tweet with the textual information. The
ways in which people can use arbitrary emojis can be quite varied and different on Twitter, and as such the data set was considered to quite noisy. With the case of Github reactions, there is a limited set of emojis which are used for reactions, and the nature of their usage makes it less likely for them to be used in nonstandard ways. In a tweet, an emoji can be used to replace a word, or even just for the aesthetic use of the emoji rather than for the actual meaning or content of it, such as when creating a form of text art. For reactions on Github, the reaction used is almost exclusively used to indicate the reaction towards a post.
It is important to note that the reaction provided by the user does not necessarily reflect exactly how the user actually felt towards the post. It is possible that the reaction provided is what the user feels like they should portray to other people. This also brings up the question of what is important or necessary when performing sentiment extraction, especially in a project such as Github. We have to consider whether we want to know what the intrinsic sentiment of a statement is, what the author of a post intended the sentiment to be, or how other people react to the post. By looking at the reaction data on Github, we are attempting to look at how other people react or perceive a post. It is also possible that the reaction that a user provides may not necessarily correspond to the content of post itself, but rather depend more on the user’s own emotional state.
4.1
Reaction Data
Github provides a limited set of emojis which can be used as ’reactions’ towards some specific posts. The reactions which can be used are shown in Table 4.1. The type of posts which can receive a reaction are a pull request, an issue, and a comment on either a pull request or a comment. By using sites such as Github Trending and RepoReaper [40], we were able to extract a list of the top Github repositories, from which all the comments from pull requests and issues which had reactions associated with them were scraped. This resulted in a dataset consisting of 1.5 million posts with reactions, across 1700 projects with a set of 800,000 unique users.
With this data we want to test whether prior interaction between users plays a role in influencing reactions, and more broadly if there is non-textual information that can influence what type of reaction is received.
Firstly we categorize our reactions into positive and negative. Considering the list of reactions, the +1, heart, laughing and hooray reactions are all unambiguously positive. The rocket emoji depicts a rocketship and is typically used to indicate
Figure 4.1: Table of possible Github reactions
the phrase “ship it”, which means to deploy, launch or merge something, a phrase commonly used in software development communities. As a result, rocket is classified as a positive sentiment reaction. The -1 and confused reactions can be considered to be unambiguously negative. The last reaction are the eyes emoji, which is not totally clear whether it is negative or positive. Based on manual assessment it is sometimes used positively, or negatively, or in the sense of “take a look at this”. Based on the reaction distribution this is the least used reaction, and as a result, we decided to leave out this reaction from the analysis, due to the ambiguity of it.
The first question is whether or not the history of interactions between the user who makes a post and the person who reacts to it influences what sort of reaction is created. In order to determine this, we decide on two basic ideas of what counts to a previous interaction. The first type of interaction we chose is where two users who have participated in the same pull request or issue. If they have both commented in one of these, then we can consider this as both users “seeing” each other, and count it as in interaction. A second form of interaction is when one user specifically includes the username of another user in their post, which will be referred to as mentioning another user.
The first step of the analysis is looking at the percentage of positive reactions and the corresponding Standard Error for different subgroups as shown in Table4.1.
We can see that users who have had no previous interactions apart from reacting to a post, had the lowest percentage of positive reactions at 93.63%. Users who had both commented in the same issue or pull request, but had not mentioned each other by username specifically, is indicated in the table as “Seen but not mentioned”. They had a positive reaction ratio of 94.54 %, which is higher than set of users who had never interacted before. For users who have at the minimum both posted in the same pull request or issue have a positive reaction ratio of 96.47% and users who have mentioned another has the highest positive reaction ratio at 97.62%. We also performed a Mann-Whitney U-test or Wilcoxon test for each of the interaction subsets, using each project as an observation, and found that the p-values for each of the tests was below 0.05, confirming that these were different distributions. This same test was repeated for each subsequent analysis, and all were confirmed to have ap-value of less than 0.05.
No Interactions Only Seen Mentioned Overall
Percent SE Percent SE Percent SE Percent SE
Positive Reactions 93.62% 0.01% 94.54% 0.03% 97.66% 0.02% 94.64% 0.01%
Table 4.1: Positive reactions percentage based on user interaction
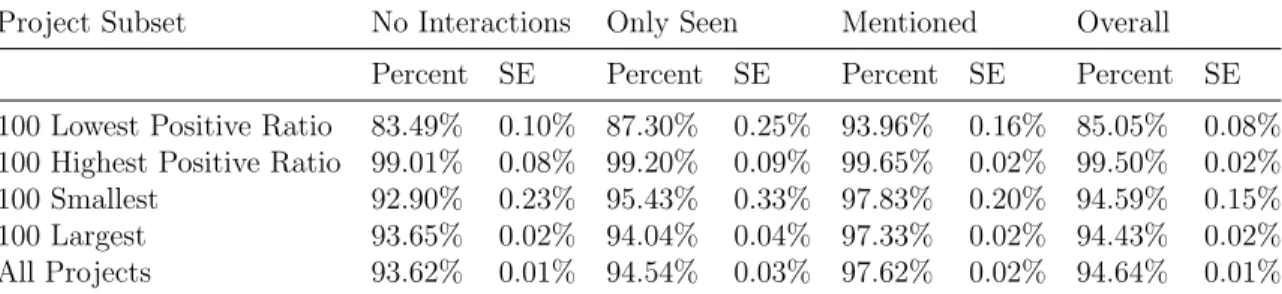
These results seem to support the notion that users who have interacted with each other will have more positive reactions between each other. The first issue that we might have with this analysis is that different projects are likely to have different repository characteristics, such as the ratio of positive reactions or the amount that users interact with each other. It is therefore possible for there to be a few projects which skew the overall dataset in way which is not representative of the standard behavior in the majority of projects. The first way we can try to account for this is to have a form of sanity check by selecting different subsets of projects, running the same analysis and seeing if the same relationships hold. We decided to look at the top 100 largest projects and smallest projects as well as the top 100 projects with the highest and lowest positive reaction ratio. The same analysis as performed on the overall dataset was performed on each of these datasets, with the results shown in Table4.2.
We see that the same characteristics hold for all the different different sets of projects. For each project subset we see that users who have not interacted with each other apart from leaving a reaction show the lowest percentage of positive reactions, and users who have mentioned each other have the highest percentage of positive reactions. It also does seem to confirm the notion that mentioning a user is
Project Subset No Interactions Only Seen Mentioned Overall Percent SE Percent SE Percent SE Percent SE 100 Lowest Positive Ratio 83.49% 0.10% 87.30% 0.25% 93.96% 0.16% 85.05% 0.08% 100 Highest Positive Ratio 99.01% 0.08% 99.20% 0.09% 99.65% 0.02% 99.50% 0.02% 100 Smallest 92.90% 0.23% 95.43% 0.33% 97.83% 0.20% 94.59% 0.15% 100 Largest 93.65% 0.02% 94.04% 0.04% 97.33% 0.02% 94.43% 0.02% All Projects 93.62% 0.01% 94.54% 0.03% 97.62% 0.02% 94.64% 0.01%
Table 4.2: Positive reactions percentage based on user interaction for project subsets
considered a stronger form of interaction between two users rather than merely both commenting in the same pull request or issue, as users mentioning each other leads to a higher percentage of positive reactions. This effect is seen least the subset of projects with the highest positive ratios, which is to be expected since there would not be much of an opportunity for an increase in the percentage of positive reactions. Despite this, the same behavior of increasing positive percentage due to interactions is observed.
We can define auserpair as consisting of a user who creates a post, known as the post user and a user who reacts to this post, known as the reaction user. For each unique userpair, we calculate the ratio of positive reactions, calculated with Laplace smoothing, which enforces a non-informative prior probability. It is calculated as shown in Formula 4.1 where p is the number of positive reactions in a userpair and
n is the number of negative reactions in a userpair. This gives a Bayes posterior estimator for the probability of a subsequent reaction being positive for a specific userpair. This value is referred to as theuserpair ratio.
userpair ratio= p+ 1
(p+ 1) + (n+ 1) (4.1)
We then performed the same analysis as before but now looking at the mean userpair ratios, the results of which are shown in Table 4.3. From these results we can see that interaction between users increases the mean ratio of positive reactions between these users, across all projects as well as all the different project subsets. The effect of interactions can be more clearly seen when using the probability metric as compared to simply a positive reaction ratio, as can be seen in the 100 Highest Positive Ratio project subset. In the 100 Highest Positive Ratio subset, the overall positive ratio shown in Table 4.2 do not seem to increase much from 99.01% to 99.66%, however we see a greater increase in the mean userpair ratio in Table 4.3
Project Subset No Interaction Only Seen Mentioned Entire Dataset Mean SE Mean SE Mean SE Mean SE 100 Lowest Positive Ratio 0.62 0.0004 0.64 0.0011 0.68 0.0015 0.62 0.0003 100 Highest Positive Ratio 0.67 0.0004 0.69 0.0008 0.75 0.0008 0.71 0.0004 100 Smallest 0.65 0.0008 0.66 0.0014 0.70 0.0016 0.66 0.0007 100 Largest 0.66 0.0001 0.67 0.0002 0.72 0.0003 0.66 0.0001 All Projects 0.66 0.0001 0.67 0.0001 0.71 0.0002 0.66 0.0001
Table 4.3: Mean userpair ratio based on user interaction
from 0.67 to 0.75.
The second shortcoming of this approach is that it does not take into consideration the number of times a pair of users has seen each other. We want to determine if repeated interactions between users increases the chance of a subsequent positive reaction. In order to investigate this we can investigate what sort of correlation there is between the number of interactions between a userpair and the positive reaction ratio. We look at the Spearman’s rank correlation coefficient between the number of interactions and the userpair ratio. This measures how well two variables are in a monotonic relationship, which means that if one value increases the second one increases as well. It does not simply look for strictly linear correlation as it is non-parametric and is more tolerant of outliers than other correlation co-efficients such as the Pearson correlation coefficient.
Project Subset Seen Mentions 100 Lowest Positive Ratio 0.13 0.14 100 Highest Positive Ratio 0.50 0.47
100 Smallest 0.27 0.27
100 Largest 0.19 0.21
All Projects 0.20 0.22
Table 4.4: Spearman correlation coefficient of userpair ratio and number of interac-tions
As we can see in Table 4.4, for all project subsets we can see that there is a positive monotonic correlation between the positive reaction ratio of a userpair and the number of interactions between the users, whether it is mentioning the user or just participating in the same issue or pull request. The p-values for all the correlations
Project Subset Seen Mentions 100 Lowest Positive Ratio 0.14 0.30 100 Highest Positive Ratio 0.27 0.44
100 Smallest 0.16 0.35
100 Largest 0.21 0.36
All Projects 0.20 0.36
Table 4.5: Spearman correlation coefficient of userpair ratio and number of interac-tions for users who have already interacted with each other
being below than 0.05 also indicates that we can be fairly certain that the results are reliable.
What this indicates is that the greater the number of interactions that a userpair has, the higher the probability that a subsequent reaction will be positive. In addition this effect is stronger for mentioning, which can be seen considered a more direct form of interaction as can be seen in Table 4.5.
We used different project subsets as a sanity test to try and mitigate factors from specific projects from dominating and skewing results. We can investigate further to see if this holds for all projects in general. For this we repeat the correlation tests for all 1700 projects and then consider the mean and standard deviation of these results, which is shown in Table4.6.
Seen Mentions Mean 0.25 0.25 Std Dev 0.20 0.19
Table 4.6: Spearman correlation distribution over all projects
As can be seen, the mean for the correlations of each project individually is similar to the correlation we get for all projects overall. In addition the standard deviation for both metrics are lower than the mean, giving us a coefficient of variation of less than 1, indicating that there is not a very wide range of variation between these results. This can further lead us to the conclusion that this sort of correlation is more or less project independent.
In order to further visualize the results, we can observe the relation between the userpair ratio and both the number of times seen as a scatterplot and boxplot shown
Figure 4.2: Scatterplot of userpair ratio and number of times user seen
Figure 4.4: Scatterplot of userpair ratio and number of times user mentioned
in Figure 4.2 and Figure 4.3. The middle line of the boxplot indicates the median, with the box edges indicating the 25th and 75th percentiles. Here we can clearly see that the mean userpair ratio increases as the number of times a pair of users encounter each other. Similarly we can also observe the same relationship between mentions and ratio as scatterplot and boxplot shown in Figure4.4 and Figure 4.3.
4.2
Graph metrics
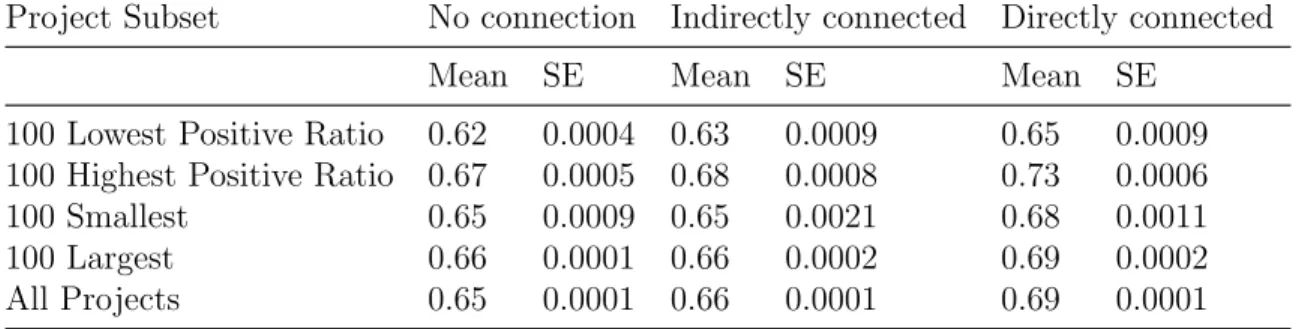
By recording which users have interacted with each other, we effectively generate a graph of users activity throughout a project. For users who have not had direct interaction, via participating in the same pull request or issue, we can still judge how close they are to another user based on the shortest path in the interaction graph. The shortest path value for each userpair was then run through the same analysis as in the earlier section. As shown in Table 4.7, we can see that for almost all project subsets, we see that there is a higher percentage of positive reactions among userpairs that are not directly connected but have a form of indirect connection. This effect is also seen in the mean userpair ratio in Table 4.8. For all project subsets, the progression of an increasing mean userpair ratio from no connection to direct connection is observed.
Project Subset No connection Indirectly connected Directly connected
Percent SE Percent SE Percent SE
100 Lowest Positive Ratio 83.39% 0.10% 85.05% 0.23% 90.71% 0.15% 100 Highest Positive Ratio 98.84% 0.10% 99.28% 0.13% 99.60% 0.02%
100 Smallest 92.90% 0.25% 92.77% 0.58% 96.87% 0.18%
100 Largest 93.35% 0.02% 94.69% 0.04% 96.07% 0.02%
All Projects 93.30% 0.02% 94.79% 0.03% 96.47% 0.01%
Table 4.7: Percentage of positive reactions based on graph of user’s seeing each other
Project Subset No connection Indirectly connected Directly connected
Mean SE Mean SE Mean SE
100 Lowest Positive Ratio 0.62 0.0004 0.63 0.0009 0.65 0.0009 100 Highest Positive Ratio 0.67 0.0005 0.68 0.0008 0.73 0.0006
100 Smallest 0.65 0.0009 0.65 0.0021 0.68 0.0011
100 Largest 0.66 0.0001 0.66 0.0002 0.69 0.0002
All Projects 0.65 0.0001 0.66 0.0001 0.69 0.0001
Table 4.8: Mean userpair ratio based on user seen graph connection
This same interaction graph was constructed for users mentioning, and the same analysis was run. We observe similar results as the previous section, with the differ-ence being that once again mentioning a user shows to be a stronger indication of
interaction. Indirect mention connections prove to be a stronger predictor of positive reactions. The results for this analysis is shown in Tables4.9 and 4.10.
Project Subset No connection Indirectly connected Directly connected
Percent SE Percent SE Percent SE
100 Lowest Positive Ratio 83.71% 0.09% 89.27% 0.25% 95.15% 0.18% 100 Highest Positive Ratio 99.17% 0.05% 99.65% 0.06% 99.63% 0.03%
100 Smallest 93.42% 0.19% 97.95% 0.38% 98.29% 0.20%
100 Largest 93.54% 0.02% 95.73% 0.04% 97.58% 0.03%
All Projects 93.65% 0.01% 96.04% 0.03% 97.92% 0.02%
Table 4.9: Percentage of positive reactions based on graph of users mentioning each other
Project Subset No connection Indirectly connected Directly connected
Mean SE Mean SE Mean SE
100 Lowest Positive Ratio 0.62 0.0004 0.65 0.0013 0.69 0.0019 100 Highest Positive Ratio 0.68 0.0005 0.70 0.0009 0.75 0.0010
100 Smallest 0.65 0.0007 0.68 0.0021 0.71 0.0020
100 Largest 0.66 0.0001 0.68 0.0002 0.73 0.0004
All Projects 0.66 0.0001 0.68 0.0002 0.72 0.0002
Table 4.10: Mean userpair ratio based on users mentioning each other
Project Subset Seen shortest path Mentioned shortest path 100 Lowest Positive Ratio -0.15 -0.20
100 Highest Positive Ratio -0.20 -0.24
100 Smallest -0.17 -0.17
100 Largest -0.18 -0.26
All Projects -0.17 -0.23
Table 4.11: Spearman correlation of shortest path metrics and userpair ratio As can be seen in 4.11 we can see we do see a negative monotonic relationship for all project subgroups, which indicates that the greater the shortest path between two users are, the lower their userpair ratio is. This holds for the graphs generated
by seeing user or by mentioning a user, with the effects of mentioning being more prominent.
4.3
Following
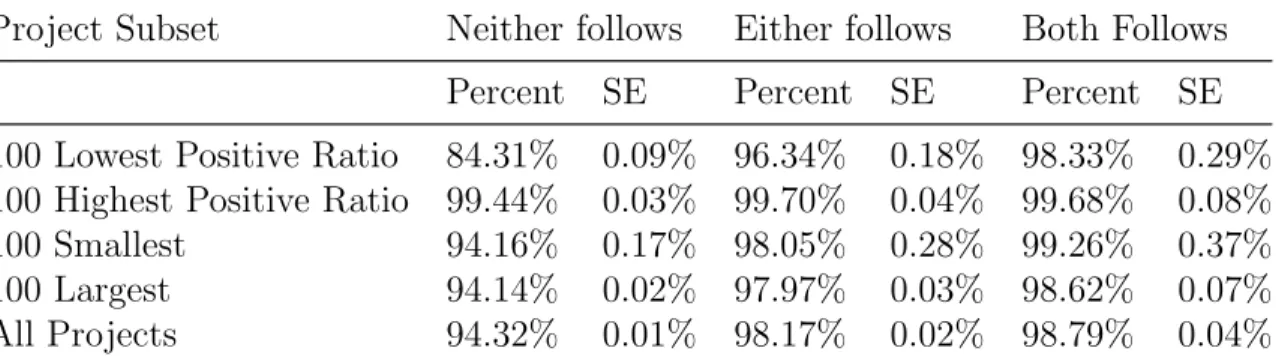
Github provides the ability for users to be able to follow one another, a feature common to many social networks such as Reddit or Twitter. It should be noted that following a user is a one way interaction and need not be reciprocal, therefore one user may follow another but the reverse may not be true. We repeat the same analysis basing the cases on whether a userpair is not following each other at all, if one of the users are following the other, or if both are following each other. It is expected that the level of prior interaction between each progresses from neither following being the least, to both following being the most. The results of this analysis is shown in Table 4.12, which confirms again our expectation. In all project subsets, we see that if at least one user in the pair follows the other, the positive reaction percentage increases, and in almost all subsets, both users following each other further increases this percentage. Once again we see this effect more clearly when we look at the mean userpair ratio, as seen in Table4.13.
Project Subset Neither follows Either follows Both Follows Percent SE Percent SE Percent SE 100 Lowest Positive Ratio 84.31% 0.09% 96.34% 0.18% 98.33% 0.29% 100 Highest Positive Ratio 99.44% 0.03% 99.70% 0.04% 99.68% 0.08% 100 Smallest 94.16% 0.17% 98.05% 0.28% 99.26% 0.37% 100 Largest 94.14% 0.02% 97.97% 0.03% 98.62% 0.07% All Projects 94.32% 0.01% 98.17% 0.02% 98.79% 0.04%
Table 4.12: Positive reaction percentage based on users following each other
4.4
User-specific features
We now move our focus onto features that are specific to the poster who receives reactions, independent from the relationship a user has with the specific user who provides a reaction.
Project Subset
Neither follows
Either follows
Both Follows
Mean
SE
Mean
SE
Mean
SE
100 Lowest Positive Ratio
0.62
0.0003
0.69
0.0014
0.70
0.0032
100 Highest Positive Ratio
0.70
0.0004
0.75
0.0017
0.77
0.0041
100 Smallest
0.66
0.0007
0.70
0.0025
0.71
0.0054
100 Largest
0.66
0.0001
0.71
0.0004
0.72
0.0010
All Projects
0.66
0.0001
0.71
0.0003
0.72
0.0007
Table 4.13: Mean userpair ratio based on users following each other
4.4.1
Contributions
Contributions are a measure of the number of code commits that a user makes to a project. We separate the dataset into users who have not contributed at all and have made at least one contribution. The results in Table 4.14 show that users who have contributed receive a higher percentage of positive reactions, and Table 4.15
confirms that this effect also holds true when considering the mean positive reaction ratio.
Project Subset No Contributions At least one contribution Percent SE Percent SE
100 Lowest Positive Ratio 83.87% 0.11% 86.98% 0.13% 100 Highest Positive Ratio 99.14% 0.08% 99.56% 0.02%
100 Smallest 92.90% 0.24% 96.49% 0.18%
100 Largest 94.18% 0.02% 94.72% 0.02%
All Projects 94.30% 0.02% 95.03% 0.02%
Table 4.14: Positive reaction percentage based on user contributions
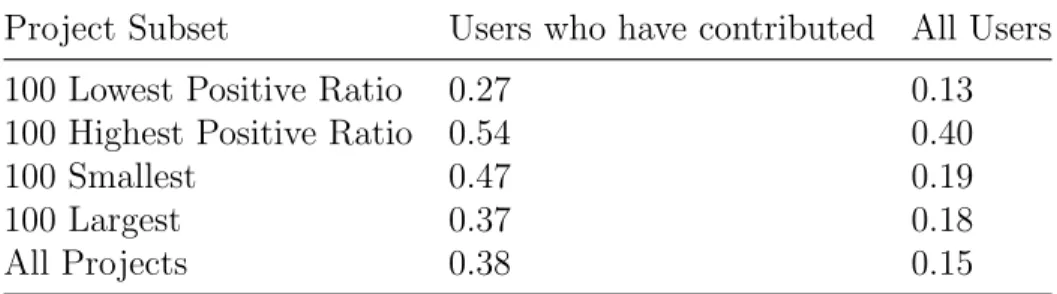
We also consider the Spearman’s correlation of the number of contributions and the positive reaction ratio, which is seen in Table4.16. Here we see that as expected there is a strong positive correlation between the number of contributions a user provides to a project and the ratio of positive reactions they receive.
Project Subset No Contributions At least one contribution
Mean SE Mean SE
100 Lowest Positive Ratio 0.69 0.0017 0.78 0.0034 100 Highest Positive Ratio 0.73 0.0014 0.80 0.0019
100 Smallest 0.71 0.0023 0.76 0.0031
100 Largest 0.76 0.0004 0.84 0.0009
All Projects 0.75 0.0002 0.80 0.0005
Table 4.15: Mean positive reaction ratio based on number of contributions Project Subset Users who have contributed All Users
100 Lowest Positive Ratio 0.27 0.13
100 Highest Positive Ratio 0.54 0.40
100 Smallest 0.47 0.19
100 Largest 0.37 0.18
All Projects 0.38 0.15
Table 4.16: Spearman correlation of user positive reaction ratio and number of con-tributions
4.4.2
Closes
A user is able to close an issue or a pull request if they have privileges in the project to close issues or if they are the creator of the issue itself. We repeat the same analysis in the previous section with contributions and find similar results as can be seen in Table 4.17 and 4.18. Once again we see a positive Spearman’s correlation between the number of closes a user makes and their positive reaction ratio, as seen in Table4.19.
Project Subset No Closes At least one close Percent SE Percent SE 100 Lowest Positive Ratio 85.58% 0.10% 83.87% 0.15% 100 Highest Positive Ratio 99.26% 0.06% 99.56% 0.02%
100 Smallest 93.58% 0.22% 95.78% 0.20%
100 Largest 94.62% 0.02% 94.10% 0.03%
All Projects 94.73% 0.01% 94.51% 0.02%
Table 4.17: Positive reaction percentage based on number of closes Project Subset No Closes At least one close
Mean SE Mean SE
100 Lowest Positive Ratio 0.69 0.0016 0.73 0.0042 100 Highest Positive Ratio 0.74 0.0012 0.82 0.0023
100 Smallest 0.72 0.0021 0.76 0.0037
100 Largest 0.77 0.0004 0.82 0.0013
All Projects 0.75 0.0002 0.78 0.0005
Table 4.18: Mean user positive reaction ratio based on number of closes
4.4.3
Number of Followers and Following
While we previously considered whether users in a userpair were following each other, we now take into consideration the total number of followers and people following a user has in general. As shown in Tables 4.20 and 4.21, having even one follower increases the ratio of positive reactions a user receives.
We see a similar effect for users who follow at least one person, as shown in Tables
4.22 and 4.23, however it is noted that this effect appears to be less pronounced. We also compare the Spearman’s correlation for the number of followers and following with the ratio of positive reactions in Table 4.24. We can see that while there is a positive correlation for both of them, the correlation is more apparent with the number of followers a user has compared to the number of people that a user is following.
Project Subset Users who have closed items All Users
100 Lowest Positive Ratio 0.21 0.05
100 Highest Positive Ratio 0.56 0.37
100 Smallest 0.44 0.18
100 Largest 0.36 0.10
All Projects 0.34 0.09
Table 4.19: Spearman correlation of user positive reaction ratio and number of closes Project Subset No Followers At least 1 Follower
Percent SE Percent SE 100 Lowest Positive Ratio 73.13% 0.34% 86.28% 0.08% 100 Highest Positive Ratio 98.94% 0.16% 99.52% 0.02%
100 Smallest 91.19% 0.60% 94.96% 0.15%
100 Largest 91.82% 0.07% 94.64% 0.02%
All Projects 92.49% 0.04% 94.83% 0.01%
Table 4.20: Positive reaction percentage based on number of followers Project Subset No Followers At least 1 Follower
Mean SE Mean SE
100 Lowest Positive Ratio 0.60 0.0040 0.72 0.0016 100 Highest Positive Ratio 0.73 0.0030 0.77 0.0013
100 Smallest 0.70 0.0054 0.73 0.0020
100 Largest 0.73 0.0010 0.78 0.0004
All Projects 0.72 0.0005 0.76 0.0002
Table 4.21: Mean user positive reaction ratio based on number of followers
4.4.4
Centrality
Since we built graphs based on user interaction, which is considered to be seeing a user or mentioning them, we can also look at the centrality of a given user in these interaction graphs. The higher their centrality score, the more connected they are within the graph.
Project Subset Following no one Following at least 1 person Percent SE Percent SE
100 Lowest Positive Ratio 83.26% 0.16% 85.84% 0.10% 100 Highest Positive Ratio 99.44% 0.04% 99.52% 0.03%
100 Smallest 92.48% 0.36% 95.27% 0.16%
100 Largest 94.40% 0.03% 94.44% 0.02%
All Projects 94.48% 0.02% 94.69% 0.01%
Table 4.22: Positive reaction percentage based on number of following
Project Subset Following no one Following at least 1 person
Mean SE Mean SE
100 Lowest Positive Ratio 0.70 0.0040 0.71 0.0016 100 Highest Positive Ratio 0.77 0.0030 0.77 0.0013
100 Smallest 0.73 0.0054 0.73 0.0020
100 Largest 0.77 0.0010 0.78 0.0004
All Projects 0.76 0.0005 0.76 0.0002
Table 4.23: Mean user positive reaction ratio based on number of following
Project Subset Num of Followers Num of Following 100 Lowest Positive Ratio 0.23 0.10
100 Highest Positive Ratio 0.18