Western Washington University Western Washington University
Western CEDAR
Western CEDAR
WWU Graduate School Collection WWU Graduate and Undergraduate Scholarship
2011
The first pre- and post-wildfire charcoal quantification using
The first pre- and post-wildfire charcoal quantification using
peroxide-acid digestion
peroxide-acid digestion
Melissa R.A. PingreeWestern Washington University
Follow this and additional works at: https://cedar.wwu.edu/wwuet
Part of the Environmental Sciences Commons
Recommended Citation Recommended Citation
Pingree, Melissa R.A., "The first pre- and post-wildfire charcoal quantification using peroxide-acid digestion" (2011). WWU Graduate School Collection. 122.
https://cedar.wwu.edu/wwuet/122
This Masters Thesis is brought to you for free and open access by the WWU Graduate and Undergraduate Scholarship at Western CEDAR. It has been accepted for inclusion in WWU Graduate School Collection by an authorized administrator of Western CEDAR. For more information, please contact [email protected].
The First Pre- and Post-Wildfire Charcoal Quantification using
Peroxide-Acid Digestion
By Melissa R.A. Pingree
Accepted in Partial Completion Of the Requirements for the Degree
Master of Science
Moheb A. Ghali, Dean of the Graduate School
ADVISORY COMMITTEE
Chair, Dr. Peter Homann
Dr. Michael Medler
MASTER’S THESIS
In presenting this thesis in partial fulfillment of the requirements for a master’s degree at Western Washington University, I grant to Western Washington University the non‐exclusive royalty‐free right to archive, reproduce, distribute, and display the thesis in any and all forms, including electronic format, via any digital library mechanisms maintained by WWU.
I represent and warrant this is my original work, and does not infringe or violate any rights of others. I warrant that I have obtained written permissions from the owner of any third party copyrighted material included in these files.
I acknowledge that I retain ownership rights to the copyright of this work, including but not limited to the right to use all or part of this work in future works, such as articles or books.
Library users are granted permission for individual, research and non‐commercial reproduction of this work for educational purposes only. Any further digital posting of this document requires specific permission from the author.
Any copying or publication of this thesis for commercial purposes, or for financial gain, is not allowed without my written permission.
Melissa R.A. Pingree
The First Pre- and Post-Wildfire Charcoal Quantification using
Peroxide-Acid Digestion
A Thesis
Presented to
The Faculty of
Western Washington University
In Partial Fulfillment
Of the Requirements for the Degree
Master of Science
by
Melissa R.A. Pingree
May 2011
iv
Abstract
In the summer of 2002, the 200,000-ha Biscuit Wildfire consumed a portion of the 150-ha Long-Term Ecosystem Productivity (LTEP) experiment in the Siskiyou National Forest, Oregon. The wildfire burned previously established 100-year-old conifer control and thinned experimental units, which allows comparison with prescribed burn and unburned units. This research evaluates the O horizon and mineral soil charcoal, a key fire-related soil component that affects physical and chemical properties. Charcoal C was quantified by a peroxide-acid digestion method developed for forest soils. Charcoal C was 17% of the organic C for a reference Australian Vertisol soil and 9% for a German Chernozem, which are similar to published values from a dichromate digestion method. The charcoal C of the Siskiyou LTEP soils was quantified in hand-sorted charcoal from the O horizon and in the <4-mm fraction of the A (0-3 cm depth) and B1 (3-15 cm depth) mineral soil horizons. The mineral soils contained substantial amounts of charcoal C and no changes were detected as a result of prescribed or wildfire. Concentrations were 10 g charcoal C/kg in A horizon and 7 g charcoal C/kg in B1 horizon and areal masses
averaged 1,860 kg charcoal C/ha in A layer soils and 5,260 kg charcoal C/ha for B1 layer soils. Charcoal C in the O layer averaged 18 kg charcoal C/ha prior to the fire and was increased by a factor of 5 by both prescribed fire and wildfire. The effect of thinning on wildfire-induced charcoal C changes was non-significant. Charcoal was formed at a rate of 0.5 – 6.0% of surface woody fuels consumed in the wildfire. Long-term soil C
sequestration in the Siskiyou – LTEP soils is greatly influenced by the contribution of charcoal C, which makes up 20% of mineral soil organic C. The significant effect of recent fire on the O layer soils demonstrates the significant short-term effects of the
v
Biscuit Wildfire and the dynamic nature of the O layer. This research reiterates the importance of wildfire and prescribed fire to soil C in a Southwestern Oregon coniferous forest ecosystem.
vi
Acknowledgements
This study was funded partially by the Fund for the Enhancement of Graduate Research awarded by the Western Washington University Vice-Provost for Research, the Huxley College Small Grants for Graduate Research and the aid given by the Biogeochemical Initiative. This work was also supported by the Long-term Ecosystem Productivity Study, USDA Pacific-Northwest Research Station, Corvallis, OR. I would like to thank my committee chair, Dr. Peter Homann for all the help, advice and recommendations he has given me, without him, this project would not have been possible. I would like to thank my committee members Dr. Michael Medler and Dr. Ruth Sofield for their
recommendations and insight. I would like to thank Bernard Bormann, Brett Morrissette, and Robyn Darbyshire for access to archived soil samples. I would like to thank Diane Peterson, Sally Elmore, Dorene Gould, Scott Wilkinson, Clint Burgess and George Mustoe for their technical and administrative advice and for use of their equipment and time resources. I would like to thank Thomas H. DeLuca for his advice. Lastly, I would like to thank Sara De Sitter and Ben Soderquist for removing charcoal from forest floor samples.
vii
Table of Contents
Abstract ... iv Acknowledgements ... vi List of Figures ... ix List of Tables ... x 1.0 Introduction ... 1 2.0 Research Questions ... 6 3.0 Background ... 7 3.1 Fire, Black Carbon, and Charcoal ... 7 3.2 Function of Charcoal in Soil ... 9 3.3 Techniques to Measure Black Carbon ... 11 3.4 Quantifying Fire Influence on Charcoal ... 17 3.5 Pre‐ and Post‐fire Research ... 18 4.0 Methods ... 20 4.1 Study site ... 21 4.2 LTEP Experimental Design ... 22 4.3 Charcoal C Experimental Design ... 24 4.4 Siskiyou – LTEP and Biscuit Wildfire Soil Samples ... 25 4.5 Laboratory Charcoal and Reference Materials ... 26 4.6 Charcoal Quantification by Peroxide‐Acid Digestion ... 27 4.7 Carbon Analysis ... 28 4.8 Data Analysis ... 29 4.9 Statistical Analysis ... 30viii 5.0 Results ... 33 5.1 Charcoal C of Reference and Other Materials ... 33 5.1.1 Reference Soils ... 33 5.1.2 Reference Chars ... 34 5.1.3 Laboratory and Siskiyou – LTEP Chars ... 35 5.2 Quantification of Siskiyou – LTEP Soils ... 37 5.2.1 Charcoal C Across Experimental Units from 1992 and 1995 Samples ... 37 5.2.2 Charcoal C Across Experimental Units from 2003 Samples (post‐fire) ... 40 5.2.3 Effects of Fire Type on Charcoal C Masses ... 43 5.3 Changes in O Layer Charcoal C vs. Wood Burned ... 46 6.0 Discussion ... 48 6.1 Charcoal C of Reference and Other Materials ... 48 6.1.1 Reference Soils and Chars ... 48 6.1.2 Siskiyou – LTEP Charcoal Particles ... 49 6.1.3 BC Continuum Model ... 51 6.2 Siskiyou‐LTEP Soils Pools and Concentrations ... 52 6.2.1 O Layer Charcoal C ... 52 6.2.2 Mineral Soil Charcoal C ... 53 6.3 Siskiyou‐LTEP Soils Change in Soil Charcoal C ... 58 6.3.1 Effect of Fire Type on Charcoal C Masses ... 58 6.3.2 Effects of Thinning on Charcoal C Response to Wildfire ... 59 6.4 Changes in O Layer Charcoal vs. Wood Burned ... 60 7.0 Conclusions ... 62 8.0 References ... 65
ix
List of Figures
Figure 1: Fire types that burned experimental units of the Siskiyou long-term ecosystem productivity study, Rogue River–Siskiyou National Forest, Oregon. ... 24 Figure 2: Charcoal C concentrations determined for reference soils, Vertisol (left)
and Chernozem (right). ... 33 Figure 3: Charcoal C concentrations determined for reference grass (left) and wood
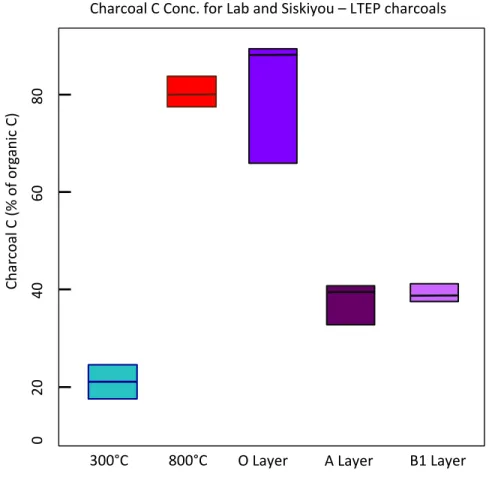
(right) chars. ... 34 Figure 4: Charcoal C concentrations determined for 300°C lab generated chars,
800°C lab generated chars, and Siskiyou – LTEP charcoal using the peroxide-acid digestion method. ... 36 Figure 5: Charcoal C concentrations, prior to the Biscuit Wildfire, for the A and B1
mineral soil layers (< 4 mm fraction). ... 38 Figure 6: Charcoal C masses, prior to the Biscuit Wildfire, for the O layer (<20-mm
charcoal) and the A and B1 mineral soil layers (< 4 mm fraction). ... 39 Figure 7: Charcoal C concentrations, following the Biscuit Wildfire, for the A and
B1 mineral-soil layers (<4-mm fraction). ... 41 Figure 8: Charcoal C masses, following the Biscuit Wildfire, for the O layer
(<20-mm charcoal) and the A and B1 layers of mineral soil (<4-(<20-mm fraction). ... 42 Figure 9: Change in charcoal C mass from 1992 or 1995 compared to 2003
x
List of Tables
Table 1: Biscuit Wildfire – LTEP experimental units and associated % of area burned and conifer mortality (expanded from Bormann et al. 2008), and BAER burn severity ratings (Azuma et al. 2004). ... 23 Table 2: Two-way ANOVA table for comparison of fire type in Siskiyou – LTEP
and Biscuit Wildfire soils. ... 31 Table 3: Three-way ANOVA table for comparison of thinning treatments in
Siskiyou – LTEP and Biscuit Wildfire soils. ... 32 Table 4: Statistical comparison of charcoal C masses (kg C/ ha) in pre- and post-fire
types. ... 44 Table 5: The statistical comparison of charcoal C masses (kg C/ ha) pre- and post-
wildfire for burned mature-control and mature-thinned treatments. ... 46 Table 6: Increase in O layer charcoal C mass compared with and woody fuel C loss
1.0 Introduction
Fire is ubiquitous in forested ecosystems. While evidence of fire dates back to the extinction of the dinosaurs (Venkatesan and Dahl 1989, Wolbach et al. 1988) it remains a largely misunderstood ecological disturbance and underutilized forest management tool (Agee 1993, Pyne 1982, Stephens 2005). Wildfires are predicted to become more prevalent and severe in the Western United States as climate conditions shift towards warmer and drier fire seasons (McKenzie et al. 2004), indicating the need to better understand their impacts. Prescribed fire is often used as a tool for forest restoration; however, these fires rarely reach high temperatures and are not sufficient to be considered proxies for wildfire events (Certini 2005, Stephens and Ruth 2005). Charcoal, a
byproduct of wildfires and prescribed fires, incorporated into a forest soil system contributes to the long-term C sequestration and numerous physical and chemical properties. Despite the importance, there is a lack of substantial scientific research on charcoal in forest soil systems.
Charcoal is defined in this study as any partially combusted organic material from biomass that is incorporated into the forest floor or mineral soil and can be identified as a black carbon (BC) particle or residue with a C-enriched, N-depleted, aromatic structure. This recalcitrant structure makes charcoal highly resistant to physical and biological degradation while the porous, non-polar qualities affect soil physical and chemical properties (DeLuca and Aplet 2008, Glaser et al. 2001, Liang et al. 2006, Preston and Schmidt 2006, Schmidt and Noack 2000). Previous publications demonstrate increased soil water holding capacity, increased cation exchange capacity, increased pH, and
2
reduced bulk density as a result of charcoal additions into forest mineral soils (Glaser et al. 2002, Liang et al. 2006, Sander and Pignatello 2005, Schmidt and Noack 2000, Zhu and Pignatello 2005).
Charcoal in forest soils can also affect nutrient storage and cycling. For example, Amazonian “terra preta” soils rich in charcoal from historic agricultural burning show increased nutrient retention and availability (Glaser et al. 2001, 2002). Charcoal
incorporation into forest mineral soils also influences nitrogen (N) cycling in boreal and temperate forest soils by increasing net nitrification (Berglund et al. 2004, DeLuca et al. 2006, 2009). Plant available phosphorus (P) also increases under the presence of charcoal (Knoepp et al. 2005, Tyron 1948) and charcoal may have similar affects on other soil nutrients although no studies have directly addressed this interaction (DeLuca et al. 2009). The presence of charcoal in soil litter layers changes belowground microbial community composition and increases ectomycorrhizae hyphae infection (Makoto et al. 2010,
Pietikäinen et al. 2000). Clearly, the presence of charcoal in forest floor and mineral soils changes soil physical, chemical, and biological properties.
The BC continuum model attempts to explain the range of variability in C observed in partially combusted vegetative material or fossil fuels. Original material, before pyrolysis, begins with precursor biomass or fossil fuels that often contain high H and O concentrations. As the formation temperature increases, the H and O is volatilized and the remaining aromatic C-skeleton structure becomes more condensed to form combustion residue and then combustion condensates depending on the original material (Gundale and DeLuca 2006, Preston and Schmidt 2006, Schmidt and Noack 2000, Schmidt et al. 2001, Seiler and Crutzen 1980). The C-skeleton collapses to form a larger
3
honey-combed lattice structure as formation temperature increases, which lends to the stability and recalcitrance of the BC particle in forest soils (Schmidt and Noack 2000). The pyrolysis temperature of charcoal particles dominates the degree to which they are condensed, with greater temperatures causing greater condensing. Pyrolysis temperature directly affects where charcoals fit on the BC continuum (Gundale and DeLuca 2006, Preston and Schmidt 2006).
Current published values for the contribution of charcoal to C pools in forest soil are prevalent in literature; however, it is difficult to draw comparisons between many methods used to measure different fractions of the BC continuum. A study by Hammes et al. (2007) attempted to standardize BC quantification methods by independent
measurements from several laboratories using pre-established reference materials
(Schmidt et al. 2001). One method not included in that study is a peroxide-acid digestion that provides an inexpensive, simple, and relatively accurate method for charcoal
quantification in forest mineral soils (Kurth et al. 2006). Although the peroxide-acid method has been applied in multiple forest soils (e.g. Ball et al. 2010, Bélanger and Pinno 2008, Kurth et al. 2006, MacKenzie et al. 2008) there is no comparison available to reference materials used by Hammes et al. (2007).
The charcoal present in soils has been quantified with the peroxide-acid method for forests in Montana (Ball et al. 2010, Kurth et al. 2006), Californian Sierra-Nevada mountains (MacKenzie et al. 2008), and Canadian boreal zone (Bélanger and Pinno 2008). These studies give researchers and land managers a glimpse of how much charcoal can contribute to the forest soil C pool, but direct measurement of charcoal production, transformation, and fate of this charcoal is still unknown. Since direct measurements of
4
charcoal C input into the soil from a fire are absent, it is difficult to determine the contribution of wildfire or prescribed fire to the long-term soil C pool in forest ecosystems.
Published studies have evaluated charcoal production rates for prescribed fires and laboratory experiments but not for wildfire events,, which often reach higher temperatures of 700 – 800°C and have a broad range of temperatures (Certini 2005). Prescribed fires often do not reach the high temperatures experienced during a wildfire or have broad temperature ranges similar to wildfires (Certini 2005). Higher temperatures are associated with higher tree mortality, which is a source of charcoal (Van Wagner 1973, 1977). However, high intensity experimental fires in boreal and temperate regions, that reach temperatures similar to wildfire temperatures, are reported to produce 1.5 – 3.1% BC residues as a percentage of consumed C in biomass (Clark et al. 1998, Czimczik et al. 2003, Lynch et al. 2004). A broader estimate of charcoal production from biomass consumed ranges 1 – 10% (DeLuca and Aplet 2008, Forbes et al. 2006, Lynch et al. 2004, Tinker and Knight 2000, Preston and Schmidt 2006). These reported values involve a high degree of variability and a number of assumptions that are associated with the different methodologies. It is, therefore, difficult to accurately compare the many studies that measure charcoal production because of the inherit variability in fire events,
sampling procedures, and estimations made for an individual study.
No previous research has evaluated charcoal content of forest floor or mineral soils before and after a wildfire, probably because wildfires are highly unpredictable. However, just this opportunity was afforded in the summer of 2002 when the Biscuit Wildfire burned a portion of the Long-Term Ecosystem Productivity (LTEP) experiment
5
in the Siskiyou National Forest, OR (Bormann et al. 1994, Bormann et al. 2008, Homann et al. 2008). Subsequent research from the LTEP – Siskiyou site directly quantified how fuel treatments alter the effects of wildfire on overstory mortality and how fire-induced loss of soil C and N are related to woody fuels, thinning, fire type, and fire severity (Raymond and Peterson 2005, Bormann et al. 2008, Homann et al. (in review)). Previous to the Biscuit Wildfire, two studies evaluated wildfire induced changes in soil nutrients (Johnson et al. 2007 and Murphy et al. 2006), however, neither mentions the presence or absence of charcoal.
6
2.0 Research Questions
This research takes advantage of the unique Siskiyou – LTEP study and pre-established black carbon (BC) reference materials to evaluate charcoal, a key fire-related soil component. The study addresses the following questions:
1. Does the peroxide-acid charcoal C quantification method yield results similar to other published methods?
2. What is the quantity of charcoal C in the Siskiyou – LTEP soils?
3. Do wildfire and prescribed fire differ in their effects on the amount of charcoal C in soil?
4. Does thinning alter wildfire’s effect on the amount of charcoal C in soil?
5. How much charcoal is produced in comparison to wood consumed during wildfire and prescribed fire?
7
3.0 Background
3.1 Fire, Black Carbon, and Charcoal
Paleoecological records reveal the prevalence and impact of historical fire events worldwide. Peaks in organic carbon deposits associated with massive global vegetative burning date to the Cretaceous/Tertiary period boundary, 65.5 Ma, suggest wildfires are associated with the extinction of the dinosaurs (Venkatesan and Dahl 1989, Wolbach et al. 1988). Naturally ignited wildfires represent a key ecological disturbance that
continues to mold the diversity and age-class of vegetation in forest and grassland regions (Agee 1993, Zackrisson 1977). Worldwide data collected from charcoal records, fire-scarred trees, tree ring analysis, pollen records, and ice cores suggest higher frequency of wildfires in the past 6,000 – 10,000 years, since the beginning of the Holocene due to warmer, drier conditions (Agee 1993, McKenzie et al. 2004).
From 1940 to 2000 the area burned by wildfires significantly increased in the Western U.S., with the exception of California and Alaska (Stephens 2005). Data made available by the National Interagency Fire Center support an increase in total area burned by wildfires from 1960 to 2010 (www.NIFC.gov). High-severity wildfires are
increasingly common in the western United States as a result of sustained fire
suppression and silviculture practices that result in dense accumulation of fuels (Stephens and Ruth 2005, Pyne 1982). Current climate predictions point towards drier conditions in the west, which may lead to longer fire seasons and more extensive burning (McKenzie et al. 2004). Predicted climate conditions suggest an increase in high-severity wildfires in
8
the western U.S, which have the potential to drastically affect above and below ground ecological processes.
Wildfires result in a heterogeneous incorporation of charcoal into forest soils. Scientists traditionally viewed charcoal as a relatively inert form of carbon in soils (Schmidt and Noack 2000). This attitude can be explained by charcoal’s super-passive and highly recalcitrant structure, allowing it to be sequestered in forest soils for thousands of years (DeLuca and Aplet 2008, Law et al. 2001, Preston and Schmidt 2006). Soil charcoal is defined here as any partially combusted organic material from wood, bark, or leaves that is incorporated into the forest floor or mineral soil and can be characterized by a C-enriched, N-depleted, highly aromatic molecular structure.
Larger amounts of charcoal are more likely to be found in the mineral soils than forest floor. In an unmanaged Pinus ponderosa/Pseudotsuga menziesii forest, Kurth et al. (2006) found 10-30 times more charcoal in the top 10 cm of mineral soil compared to similar study by Brimmer (2006) measuring charcoal quantities in the forest floor.
Brimmer (2006), however, did find the forest floor charcoal content was more affected by multiple burns than mineral soils. Presence of charcoal on the forest floor may provide charcoal as a long-term input into mineral soils. Once incorporated into mineral soil, charcoal contributes to a pool of highly weather resistant, long-term soil C (DeLuca and Aplet 2008, Law et al. 2001, Preston and Schmidt 2006).
Forest floor charcoal content in a Pinus ponderosa/Pseudotsuga menziesii forest contained 10 -330 kg charcoal C/ha (Brimmer 2006) and 140 – 1620 kg charcoal C/ha in a boreal forest floor dominated by Pinus sylvestris (Zackrisson et al. 1996). In
9
comparison, the upper 10 cm of the Pinus ponderosa/Pseudotsuga menziesii forest ranged from 450 to 780 kg charcoal C/ha (Ball et al. 2010), the upper mineral soil layer of a boreal forest in Saskatchewan contained 4,000 – 11,700 (Bélanger and Pinno 2008), and surface (6 cm) mineral soils evaluated in a Sierra Nevada ecosystem yielded 1,000 to 4,600 kg charcoal C/ha (MacKenzie et al. 2008).
3.2 Function of Charcoal in Soil
Soil organic material (SOM) can be modeled by three general pools: an active fraction that responds quickly to environmental changes, an intermediate pool that responds to changes within years or decades, and a passive pool with hundreds to
thousands of years residence time (Knicker 2007). BC is considered a passive SOM pool that is able to resist decomposition and persist in soils much longer than non-BC material (Preston and Schmidt 2006). Mean residence time for charcoal can reach over 10,000 years, whereas humic acids may prevail for only 3,000 years (DeLuca and Aplet 2008, Law et al. 2001, Preston and Schmidt 2006).
In addition to long-term C sequestration, charcoal also has the potential to influence chemical, physical, and biological properties of soils. These properties are likely to change with increasing wildfire or prescribed fire temperatures. Higher
temperatures induce combustion of organic functional groups and condensation of the C-skeleton, thus changing the structure and biological degradability of charcoal particles (Baldock and Smernick 2002, DeLuca and Gundale 2006, Preston and Schmidt 2006, Schmidt and Noack 2000). Charcoal sorption capacity is directly influenced by formation
10
temperature and, to a lesser extent, original wood material (Gundale and DeLuca 2006, Keech et al. 2005).
A suite of studies indicates that charcoal may influence nitrogen transformations in boreal forest soils (DeLuca et al. 2002, Keech et al. 2005, Wardle et al. 1998,
Zackrisson et al. 1996) as well as temperate forest soils (Brimmer 2006, DeLuca et al. 2006, MacKenzie 2004, MacKenzie and DeLuca 2006). Charcoal has been found to increase net nitrification in temperate and boreal forests that otherwise exhibit no net nitrification (Berglund et al. 2004, DeLuca et al. 2006). Contrastingly, charcoal additions have not been found to increase ammonification (DeLuca et al. 2009). These studies suggest that net nitrification is increased by charcoal sorption of phenolic compounds (DeLuca et al. 2009). Inhibitory compounds, such as polyphenols, have the ability to affect composition and activity of microbial communities in soils that are responsible for converting ammonium (NH4+) to nitrate (NO3-)via nitrification (Hättenschwiler and Vitousek 2000).
Increased plant available phosphorus (P) in the presence of charcoal in forest soils is likely due to multiple mechanisms. Direct release of P from pyrolysis of woody
material is well known and straightforward. The volatilization temperature of P (700°C) is much higher than organic C (100°C - 200°C), thus pyrolysis breaks organic P bonds resulting in soluble P salts (Certini 2005, Knoepp et al. 2005, Tyron 1948). Indirect mechanisms are, however, less understood. Presently there is a lack of research investigating charcoal’s influence on cation and anion exchange capacity that interact with P and the influence of charcoal on pH in acidic soils (DeLuca et al. 2009).
11
Fire directly decreases the size and changes the composition of microbial communities (Bååth et al. 1995, Pietikäinen and Fritze 1995, Prieto-Fernández et al. 1998). The deposition of charcoal hinders microbial recovery of certain communities and can form a new habitat for other microbial communities (Pietikäinen et al. 2000).
Charcoal adsorbs and absorbs organic compounds that percolate from the litter layer above; the new microbial community utilizes the adsorbed compounds as substrate (Pietikäinen et al. 2000). A study by Makoto et al. (2010) reports the vertical distribution of charcoal is a significant factor in plant growth and ectomycorrhizae infection. This study suggests the diameter of external hyphae from ectomycorrhizae is small enough to utilize the nutrients adsorbed onto charcoal particles (Makoto et al. 2010). Scientists are only beginning to explore the mechanisms and processes interacting between charcoal and biological components of the soil system.
3.3 Techniques to Measure Black Carbon
Black carbon (BC) is the C in any partially combusted fossil fuel or vegetative material. Charcoal C, which is produced by combustion of vegetative material, is one form of BC.The wide range of variability in BC structure is often described by a
continuum from less condensed BC, such as charred biomass, to more condensed, such as soots and graphite (Preston and Schmidt 2006, Schmidt and Noack 2000, Schmidt at al. 2001, Seiler and Crutzen 1980). Biomass contains highly ordered functional groups comprised mainly of H and O that are volatilized by pyrolysis. With increasing temperature and pressure, benzene ring structures collapse and form a larger honey-combed lattice sheet made of C (Schmidt and Noack 2000). The continuum attempts to explain the variability found in BC that is largely a function of the conditions of BC
12
particle formation (Gundale and DeLuca 2006, Preston and Schmidt 2006). The defining characterization that separates non-BC carbon from BC is the formation of these benzene rings and the degree to which the structures condense with increasing temperature
(Preston and Schmidt 2006).
The difficulty in comparing studies that quantify charcoal in mineral soils is the diversity of methods used for charcoal quantification. A plethora of charcoal
quantification methods differ drastically in terminology, expense, equipment, and risk of error, which challenge any efforts to compare studies. Furthermore, charcoal
quantification methods that differ slightly in techniques, chemicals, and oxidations also differ in the fraction of BC they are able to determine, which is not often addressed in the study (Preston and Schmidt 2006, Schmidt and Noack 2000, Schmidt at al. 2001, Seiler and Crutzen 1980).
Schmidt et al. (2001) reaffirm the BC continuum model and consequential difficulty in quantifying charcoal in soils. Schmidt and colleagues measured the BC content in eight Australian soils with two thermal oxidation methods, two chemical-thermal oxidation methods, chemical oxidation molecular markers method, and high-energy UV photo-oxidation with 13C MAS NMR (magic angle spinning nuclear magnetic resonance) spectroscopy. The BC quantities from the different methods varied over 2 orders of magnitude for the individual samples. BC materials lack clear boundaries from one end of the continuum to the other, thus complicating how to define what forms of BC are quantified by a specific method and whether there are interfering materials.
13
Schmidt et al. (2001) also support the need for BC reference materials to compare methods, an idea formed after the 1999 Geochemical Society meeting and fulfilled thereafter (Hammes at al. 2007). The reference materials consist of five BC-containing environmental matrices, three laboratory-produced BC-rich materials, and four
potentially interfering materials. The reference materials were suggested by Schmidt et al. (2003) and were later analyzed in Hammes et al. (2007) by seventeen different laboratories with variations of seven different methods. Those methods are chemo-thermal oxidations at 375°C (CTO-375), benzene polycarboxylic acids (BPCA), acid dichromate oxidations (Cr2O7), thermal/optical transmittance and reflectance (TOT/R),
thermogravimetry and differential scanning calorimetry analysis (TG-DSC), sodium hypochlorite oxidation (NaClO), and UV photooxidation (UV). The BC materials consisted of two chars (solid residues from combustion of chestnut hardwood (Castanea sativa) and grass (Oryza sativa) at 450°C for 5 hours) and one n-hexane soot formed from n-hexane under high temperatures (500°C - 800°C).
The CTO-375 method allowed for reliable distinction between soots and chars and is then best for reporting highly condensed chars. This method may adequately detect highly condensed chars but will not detect low condensed chars. Furthermore, this
method risks positive bias, or overestimation of BC, due to possible charring during thermal oxidation (Hammes et al. 2007). Another method uses benzene polycarboxylic acids (BPCA) as indicators for concentrations of specific compounds associated with BC (Poot et al. 2009). The BPCA method is best suited for BC components in solution and BC markers can be related to source and formation conditions of the material analyzed. This method reported positive biases in non-BC material and requires further
14
standardization due to inconsistent variations in laboratory results. Low soot and char quantities imply that this method does not recover the larger and more condensed BC fractions (Hammes et al. 2007).
Cr2O7 is less expensive than most methods and requires less equipment, but
assumes all carbon remaining after oxidation by Cr2O7 is BC, which has been proven
invalid (Song et al. 2002, Masiello 2004). Additionally, the reproducibility is low for soil samples and reported BC concentrations varied by a factor of three between the labs. The TOT/R method thermally differentiates BC but is only reported adequate for atmospheric matrices. TG-DSC method was overly sensitive to impurities and may have
overestimated BC in most sediment and soil samples compared to values derived from other methods. The NaClO method effectively identified soots but this method is still underdeveloped, lacks replication in this study, and is somewhat expensive. Lastly, the UV method detects a wider range of BC than chemical oxidation methods; it has been used for soil matrices, but is not easily used due to specialized equipment, time commitment, and expense.
Hammes et al. (2007) reiterates the BC continuum model and the related
difficulty in determining total BC quantities when employing methods that identify BC only from within ranges of the continuum. Comparing different methods, materials, and matrices will assist in determining the proper BC definition and purpose for a given BC study. Variation in BC values reported can be explained by method detections of different BC types and inaccurate estimates of BC due to methodological variations (Hammes et al. 2007). This report asserts the importance for investigators to define the type of BC they are measuring and to define the purpose of the study.
15
A subsequent investigation by Kuo et al. (2008) also supports the BC continuum model by determining the applicability of using levoglucosan as a molecular marker, produced by hemicellulose/cellulose combustion, to characterize and quantify different BC materials. Levoglucosan was only detectable in low-temperature char samples (150-350°C) in contrast to acid dichromate oxidation that detected mid- and high-temperature chars (≥350°C). Levoglucosan, therefore, may not be applicable to char found in
naturally occurring soils due to the greater variation in char types. Results from Kuo et al. (2008) encourage researchers to thoroughly evaluate BC quantification methods in
relation to the BC continuum.
Leifeld (2007) investigated the thermal stability of black carbon with oxidative differential scanning calorimetry (DSC). Using BC reference materials investigated by Hammes et al. (2007), Leifeld found evidence supporting the BC continuum. The thermal stability of samples increased with charring and was not dependent on aromaticity, as previously thought, but positively correlated with degree of molecular order measured by DSC and compared to NMR data in Hammes et al. (2007). As shown by Leifled (2007), the DSC method can measure BC materials that span the entire BC continuum,
distinguish higher temperature BC regions, and quantify charcoal and soots in soils with BC content in soils above 3%. As mentioned by Hammes et al. (2007), when mineral contaminants are present DSC may overestimate BC content and may require additional techniques to determine impurity fractions.
Gundale and DeLuca (2006) evaluated the importance of formation temperature and source material, resulting in another example of the BC continuum. Wood and bark samples from two conifer species (Pinus ponderosa and Pseudotsuga menziesii) were
16
charred at a low temperature (350°C) and a high temperature (800°C), then incubated with glycine to measure charcoal influence on nitrogen (N) transformations and analyzed for polyphenol sorption onto the charcoal. Formation temperature was the most important factor in differentiating charcoal characteristics, such as N mineralization, N nitrification, sorption capacity, pH, electrical conductivity, and extractable PO43- and NH4+. Data from
Gundale and DeLuca (2006) show the variation in physical and chemical characteristics within the charcoal fraction of the BC continuum.
Perhaps the most promising method of charcoal quantification in forest soils is the peroxide-acid digestion for its gentle oxidation of non-char organics, high recovery of charcoal, and low variability demonstrated by Kurth et al. (2006). This study also inadvertently produced evidence of the BC continuum model after analyzing the
effectiveness of two charcoal-quantification chemical-oxidation approaches. Kurth et al. (2006) compared the Walkley-Black organic C method, which uses potassium
dichromate and sulfuric acid digestions to three variations of nitric acid (HNO3) and
hydrogen peroxide (H2O2) digestions. The Walkley-Black method resulted in 80%
recovery of added charcoal in samples containing 0.5 to 5% C on a weight basis.
However, the method recovered only 45% of charcoal in soils containing less than 0.5%. Methods using peroxide-acid digestions proved more promising than the Walkley-Black, nitric acid alone, and peroxide alone for forest soils. Nitric acid digestions using 11.1 M
(concentrated) nitric acid completely digested non-char organics and some lower
temperature forms of BC. Hydrogen peroxide digestion yielded nearly 100% recovery of charcoal; only 50% of the organic matter was removed. The authors combined peroxide and weak nitric acid digestions to effectively recover more charcoal with less variation
17
than the Walkley-Black method. Regression analysis demonstrates the peroxide-acid method is more effective in samples containing 0.05 to 5% charcoal without digesting away considerable amounts of charcoal. The variation found in this investigation assert the importance of defining the fraction of BC measured, clearly stating the purpose of the study, and appropriately selecting the methods that will provide the proper analytical window.
3.4 Quantifying Fire Influence on Charcoal
Charcoal production rates have been estimated across ecosystem types using many different techniques in laboratory and field experiments (Forbes et al. 2006, Preston and Schmidt 2006). As explained by Forbes et al. (2006), despite procedural differences charcoal production is typically estimated by comparing prefire biomass C to post-fire residue C. Biomass fuel consumption during a fire and collection of residues after a fire can be gravimetric or volumetrically determined by comparing pre- and postfire plots or using adjacent plot comparisons. Postfire residues are identified and quantified visually or chemically after collection. Chemical quantification requires a clear definition of the type of BC that is being quantified in the study (Forbes et al. 2006, Preston and Schmidt 2006). High intensity experimental fires, which differ from prescribed fires in that they are expected to reach higher temperatures, in boreal and temperate regions are estimated to produce 1.5 – 3.1% C in BC residues as a percentage of consumed C while tropical rainforests cleared by fire produce 2.9 – 7.8% (Forbes et al. 2006). These estimates provide a general approximation of charcoal production derived from many different methods with their associated uncertainties and variability.
18
Published research quantifying charcoal directly post-fire is limited to the fraction of charcoal deposited on the forest floor after experimental fires, prescribed fires, and agricultural burning. Experimental fire research is often focused on charcoal dispersal, particle size, and distribution is compared to sediment charcoal records (Clark et al. 1998, Eckmeier et al. 2007, Lynch et al. 2004, Ohlson and Tryterud 2000). Pre-fire charcoal records are derived from lake sediment cores or not at all, which renders a lack of information relating pre- to post-fire charcoal measurements (DeLuca and Aplet 2008, Forbes et al. 2006, Preston and Schmidt 2006). Measurements of woody debris, or fuels, consumption and subsequent production of charcoal are few and vary in methodology. Lynch et al. (2004) estimated charcoal particle production using extrapolations from particle traps while fuel consumption rates were based on a previous study. Conversely, a study by Tinker and Knight (2000) estimated charcoal production by assessing burned logs after a prescribed fire but took no account of charcoal deposited onto the forest floor. Currently, published research does not address pre-fire charcoal concentrations in forest floor soils before an experimental, prescribed, agricultural, or wildfire event.
3.5 Pre- and Post-fire Research
Comparing pre- and post-fire soil characteristics for wildfire events is rare because of the unpredictable nature of wildfires. Weather, fuels, and ignition sources are constantly fluctuating, which greatly hinders the ability to predict where and when a wildfire will occur, thereby preventing soil measurements prior to the wildfire. By
happenstance, in the summer of 2002 the Biscuit Wildfire burned through a portion of the 150-ha Long-Term Ecosystem Productivity (LTEP) experiment in the Siskiyou National Forest (Bormann et al. 1994, Bormann et al. 2008, Homann et al. 2008). Multiple
19
lightning strikes sparked small fires on 12 July 2002, which merged into the Biscuit Wildfire that eventually burned 202,000 ha (Raymond and Peterson 2005). The Biscuit Wildfire is the largest recorded fire in Oregon history and one of the largest to occur on US Forest Service land (Raymond and Peterson 2005). The Siskiyou – LTEP and Biscuit Wildfire continues to provide land managers and researchers with a unique opportunity to directly quantify fire effects on above and below ground forest processes.
Previous findings from the LTEP – Biscuit Wildfire experiment resulted in direct quantification of fuel treatments, fire severity, and influences on forest soil nutrient pools. Raymond and Peterson (2005) used pre- and post-wildfire measurements to quantify the relationship between fuels and fire severity. Their study led to a number of conclusions; fire damage and mortality was higher in thinned plots than untreated stands and lowest in plots treated by thinning in addition to prescribed burning due to fine fuel loading. Raymond and Peterson recommend applying a multiple fuel arrangement for the most effective reduction of hazardous fuels (2005). Thinning and prescribed burning treatments that add or remove fuels may have substantial influences on charcoal production in these plots as well; however, this aspect has not yet been evaluated.
The Biscuit Wildfire caused substantial losses of soil C and N across a range of prefire treatments (Bormann et al. 2008). Nutrient losses were determined by comparing pre- and post-fire soil measurements and accounted for post-fire structural changes and erosion with a comparable-layers method (Bormann et al. 2008). Losses were of sufficient magnitude in intensely burned areas to be of concern for future forest productivity (Bormann et al. 2008). This research did not quantify the pre-fire soil charcoal or evaluate the input of charcoal into C pools and, therefore, may have
20
overlooked a substantial, long-term source of C in the forest soils. DeLuca and Aplet (2008) estimated charcoal content of coniferous forest mineral soil might range from 1 – 43% of the total mineral soil C.
In addition to the LTEP – Siskiyou research, two other published studies have evaluated wildfire-induced changes by comparing pre- and post-fire soil. Johnson et al. (2007) and Murphy et al. (2006) measured C and N before and after the Gondola fire that burned previously established plots in the Lake Tahoe basin, Nevada, USA. The loss nutrient from burned woody material and forest floor material consisted of 10 Mg ha-1 C
and 142 kg ha-1 N (Johnson et al. 2007, Murphy et al. 2006). Decreases in mineral soil C and N determined by a fixed-depth approach to 100-cm after the Gondola fire were not observed (Johnson et al. 2007, Murphy et al. 2006). Neither study addressed the presence or production of charcoal on the forest floor or in mineral soils.
21
4.0 Methods
4.1 Study siteThe Long-Term Ecosystem Productivity (LTEP) program was established on the Rogue River – Siskiyou National Forest in 1992 on homogeneous stands and soils naturally regenerated after a wildfire in 1881 (Little et al. 1995, Bormann et al. 2008). The study site is located about 25 km southeast of Gold Beach, OR at an elevation ranging from 750 to 900 m above sea level. Based on 1971 to 2000 values, mean January temperature is 5°C, mean July temperature is 19°C, and annual precipitation is
approximately 400 cm, of which only 30 cm falls between June and September (PRISM Climate Group 2011).
Forest composition is dominated by Douglas-fir (Pseudotsuga menziesii var.
menziesii (Mirb.) Franco) with knobcone pine (Pinus attenuata Lemmon) and some sugar pine (Pinus lambertiana Dougl.). Hardwoods dominate the second story as tanoak
(Lithiocarpus densiflorus (Hook. & Arn.) Rehd.), giant chinquapin (Chrysolepsis chrysophylla (Dougl. ex Hook.) Hjelmqvist var. chrysophylla), and madrone (Arbutus menziesii Pursh.) (Bormann et al. 2008).
Soils are Typic Hapludults and Typic Dystrochrepts developed on a parent
material from weathered sandstone and schist–phyllite (Bormann et al. 2008, Homann et
al. 2008, 2011). As measured by Bormann et al. (2008) the mean C horizon depth is about 35 cm. The total soil inorganic material size class is comprised of 56% < 2 mm, 7% is 2 – 4 mm, and 37% is > 4 mm. Total inorganic material > 2 mm is distributed as 26% clay, 37% silt, and 36% sand.
22
4.2 LTEP Experimental Design
The original design of the LTEP project evaluates two experiments with randomly assigned treatments. The first experiment designated three treatments on 7-ha
experimental units, replicated in two experimental blocks (blocks A and B). Each block contains a mature-control; mature-thinned, low-coarse woody debris (CWD)
implemented in 1996; and mature-thinned, low-CWD implemented in 1996 that underwent prescribed burning in fall 2001. In the second experiment seven vegetation and CWD treatments were applied to 7-ha experimental units within each of three blocks . (Bormann et al. 2008, Homann et al. 2011, Raymond and Peterson 2005). Of relevance to the current study are three experimental units of block I: the control; mature-thinned, low-CWD; and mature-mature-thinned, moderate-CWD experimental units on which treatments were implemented in 1996 (Table 3). Mature-control units were unmanaged and contained 80- 110-year-old Douglas-fir (~1000 trees ha-1), some knobcone pine and an understory of tanoak. Mature thinned, low-CWD forests had a relative density of ~240 trees ha-1 and all CWD removed from the forest floor. The mature thinned,
moderate-CWD was maintained 15% of the harvest on the ground as woody debris. This was accomplished with several management activities. Thinned logs greater than 3 m in length and greater than 5 cm in diameter at the small end were yarded by helicopter in the winter of 1996. Ground vegetation and tree crowns were removed during thinning
operations except on prescribed fire sites. Finally, prescribed burn treatments were
fulfilled in the fall of 2001 with light surface fire and no fire reaching into the tree crowns (Raymond and Peterson 2005).
23
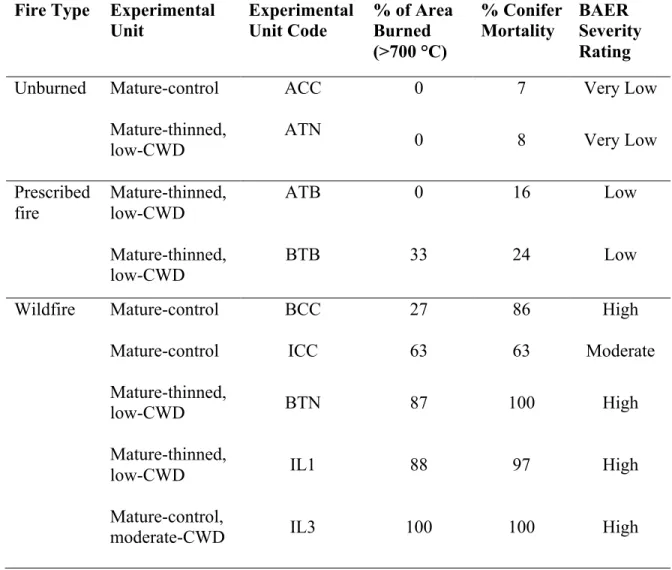
The temperatures, conifer mortality, and severity rating of unburned units, prescribed fire units, and wildfire burned units are displayed in Table 1. Melted aluminum tags denoting sampling points on the experimental units plots indicated the percentage of area that burned above 700°C (Bormann et al. 2008). Conifer mortality was based on pre- and post-fire measurements in five 18- by 18-m tree-measurement plots in each experimental unit (Bormann et al. 2008). BAER burn severity ratings correspond to conifer mortality.
Table 1: Biscuit Wildfire – LTEP experimental units and associated % of area burned and conifer mortality (expanded from Bormann et al. 2008), and BAER burn severity ratings (Azuma et al. 2004).
Fire Type Experimental Unit Experimental Unit Code % of Area Burned (>700 °C) % Conifer Mortality BAER Severity Rating
Unburned Mature-control ACC 0 7 Very Low
Mature-thinned, low-CWD ATN 0 8 Very Low Prescribed fire Mature-thinned, low-CWD ATB 0 16 Low Mature-thinned, low-CWD BTB 33 24 Low
Wildfire Mature-control BCC 27 86 High
Mature-control ICC 63 63 Moderate
Mature-thinned,
low-CWD BTN 87 100 High
Mature-thinned,
low-CWD IL1 88 97 High
Mature-control,
24
4.3 Charcoal C Experimental Design
The 2002 Biscuit Wildfire burned across block B on August 15 and block I on August 16 (Homann et al. 2011). Raymond and Peterson (2005) note that the Biscuit Wildfire burned around the low-CWD prescribed fire treatment but did not burn the plot itself. They assume this is due to fuel conditions within the treatment and not lack of ignition sources, changes in weather, or physical barriers. This study will rely on the same assumption and justify the decision with evidence from extreme weather conditions (8% relative humidity, winds from the northwest 4 km h-1 and maximum temperatures of 26° C) and extreme observed fire behavior (archived data at
www.fs.fed.us/land/wfas.html). This study investigated 5 wildfire-burned experimental units, 2 prescribed burn units, and 2 unburned units (Fig. 1).
Figure 1: Fire types that burned experimental units of the Siskiyou long-term ecosystem productivity study, Rogue River–Siskiyou National Forest, Oregon. Squares = unburned units, diamonds = units burned by prescribed fire in 2001, and triangles = units burned by Biscuit Wildfire in 2002. a = mature-control; b = mature-thinned, low-CWD; c = mature-thinned, moderate-CWD.
25
4.4 Siskiyou – LTEP and Biscuit Wildfire Soil Samples
Soil samples for the current study were obtained from the LTEP soil archives, Corvallis, OR, where air-dried or oven-dried soil samples are stored in plastic bags at room temperature. As described by Homann et al. (2008, 2011) and Bormann et al. (2008), soil samples were collected at 13 points in each experimental unit before and after fire. Sampling before the fires occurred between July and October in 1992 on block I and in1995 on blocks A and B. Sampling after the fires occurred in 2003 on all blocks. Within each treatment unit is a central 2 ha measurement area surrounded by a 4 ha buffer. Measurement areas are further arranged into a 25 m by 25 m permanent grid system. Sampling points were proximal to the grid intersections within each plot. The measurements from 2003 were ~3 m from 1992 and 1995 points. Where protrusions, usually in the form of trees, rocks, logs, or roots, prohibited sampling access two additional attempts were made 1 m from the sampling point.
Soil samples were taken perpendicular to the slope, and slope angle was measured. At each point, the O layer was collected with a 30- cm diameter ring in 1992 and 1995 or with a 21- cm diameter ring in 2003, one year after the Biscuit Wildfire. On burned plots, litterfall accumulation from after the fire event was identified and separated during field sampling. The mineral soil was sampled with a 10 x 15 cm soil corer to a depth of 30 cm. The mineral soil from the corer was extracted and separated into the soil horizon layers.
The A layer from 1992 and 1995 sampled from 0 to a varied depth of 1.5 – 5.0 cm (average of 3.6 cm), but remained fixed in 2003 at 0 – 3.0 cm. The B1 layer was
hand-26
sorted into >4 mm rocks, wood >6.4 mm diameter, and remaining soil material. Mineral soil samples were sieved into the <4 mm soil fraction and >4 mm fraction, which contained rocks and roots. Then the fractions were oven-dried at 70 °C and weighed. Slope-corrected soil masses (kg ha-1) were calculated for each layer. Within each experimental unit, a composite of the soil fraction was made for each layer. This composite was mass-weighed from the individual sampling points.
Charcoal particles were separated from the O-layer soil composites following the methods described by Brimmer (2006). The O layer composites were split into
subsamples if the entire sample mass was more than 200 g, filtered through a 1-mm sieve if <1-mm particles were abundant, then spread out on a white tray to be hand separated with the aid of supplemental light. For 2003 block B, charcoal particles between 4 – 20mm were hand-separated from A and B1 layers from individual sampling points.
4.5 Laboratory Charcoal and Reference Materials
The laboratory-produced charcoal was formed using equipment from the Huxley Environmental Sciences Department of Western Washington University (WWU). Dead debris and live limbs from Douglas-fir (Pseudotsuga menziesii) were collected in the Spring of 2009 from the Chuckanut recreation area south of Bellingham, WA. Barked wood of about 3 cm diameter was cut into 3 cm pieces of roughly 3 cm diameter by Scientific Technical Services Department at WWU, then dried for 48 hr at 60°C
(Brimmer 2006, Gundale and DeLuca 2006). The wood pieces were placed in crucibles, and covered with silica sand with lids resting atop. Crucibles were put into a muffle oven and heated at 300°C or 800°C for 2 hr. The muffle oven was allowed to reach
27
temperature for the entire 2 hr duration and samples were cooled overnight. Charcoal samples were then transferred to a mortar and pestle, ground to a fine powder, and stored in glass containers.
BC Reference Chars were acquired from Dr. Michael W.I. Schmidt, University of Zurich, Switzerland. The chars were formed from grass straw (Oryza sativa) and chestnut wood (Castanea satvia) and were collected in southern Switzerland. The chestnut wood was debarked and grass bundled and at original fuel moisture before pyrolysis. Under N2
atmosphere (flow 500 L h-1), the straw and wood were brought from room temperature to
200°C (300 K-1) and then charred at 450°C (50 K-1) for 5 hr. After cooling (8 hr), charcoal was ground in a mechanical crusher, milled in a ball mill to a fine powder, and stored in a cool, dry place in aluminum containers. The H/C, O/C ratios, organic carbon content, and other chemical and physical characteristics of the chars are reported in Hammes et al. (2006, 2008). BC reference soils were acquired from Dr. Evelyn Krull, CSIRO Land & Water, Australia. The Australian Vertisol is a sandy clay soil sampled at 0 – 10 cm depth at Urrbrae, South Australia, containing 37% clay (Hammes et al. 2007). The German Chernozem soil is a light sandy clay soil sampled at 20 – 60 cm depth in the Hildesheim-Braunschweig region, Harsum, Germany, and consists of 19% clay (Hammes et al. 2007).
4.6 Charcoal Quantification by Peroxide-Acid Digestion
This study followed the method as first reported by Kurth et al. (2006). All charcoal materials and soils were dried for 24hr at 60°C and then exposed to the
peroxide-acid digestion, as follows. One gram of mineral soil sample and 0.5 g char was ground to <0.76µm and placed into a 125 ml Erlenmeyer flask in which 20 ml of 30%
28
H2O2 and 10 ml of 1 M HNO3 were added and occasionally swirled at room temperature
over a 30-min period. The flask was then heated in a water bath to 90°C for 16 hours. After digestion, the suspensions were filtered through Whatman #2 filter papers, filter papers were dried at 60°C for 24 hours and weighed. Papers had been weighed prior to filtration and mass of residual material was determined as the difference in mass before and after filtration. Residual material was ground with mortar and pestle. Digestions were replicated on two different days. Charcoal particles < 20 mm in size were used in the Siskiyou – LTEP char digestions after visual determination and separation from composited 2003 block B plot samples.
4.7 Carbon Analysis
Total carbon concentrations of original materials and digested materials were determined on a Thermo-Electron Flash EA NC analyzer available in the Environmental Sciences Department, WWU. Chernozem and Vertisol reference materials were
measured against standard curves created with atropine, which consisted of 70.6% carbon. Wood and grass reference chars and laboratory chars were measured against an aspartic acid + sugar curve (41.23% C). Soils were measured against the atropine standard curve (70.6% C). Total C of the chars and soils before digestions were assumed to represent organic C concentration based on low inorganic C (Bormann et al. 2008). Total C after digestion is reported as charcoal C and assumes that all non-charcoal organic C is consumed during the peroxide-acid digestion.
29
4.8 Data Analysis
Charcoal C concentrations of soil samples were determined with the following calculation:
g charcoal C
kg soil = M1 g * C1 % * 10
M2 (g)
where M1 = mass of digested sample, C1 = C concentration of digested sample and M2 = mass of original sample.
Charcoal C as a percentage of organic C was calculated with the following formula:
charcoal C % of organic C = g charcoal C kg soil ÷
g organic C
kg soil * 100
Charcoal C concentrations for O layer soils were calculated with the following formula: g charcoal C kg O layer soil = C1 g charcoal C kg charcoal *M1 g charcoal kg O layer soil 1000 where C1 = charcoal C concentration and M1 = hand-separated charcoal mass.
The A layer soils collected in 2003 were measured to a slope-corrected depth of 3.1cm, however, 1992 and 1995 depths varied. Therefore, to compare concentrations in pre- and post-fire A layer soils a synthesized A layer for 1992 and 1995 was developed using a depth-weighted formula:
g charcoal C kg soil = 3.1 cm ‐ D1 (cm) *C2 ( g C kg soil) + D1 (cm) *C1 ( g C kg soil) ÷ 3.1 cm
30
where D1 = depth of A layer mineral soil, C1 = concentration of A layer mineral soil, D2 = depth of B1 layer mineral soil, and C2 = concentration of B1 layer mineral soil.
Charcoal C masses were determined by the following equation:
kg charcoal C ha = C1 g C kg * M1 kg m2 * 10
where C1 = charcoal C concentration and M1 = soil mass, slope corrected.
To compare areal masses in pre- and post-fire A layer soils, a synthesized A layer was created for 1992 and 1995 samples using a mass-weighted formula:
kg charcoal C ha
=
M1 (
kg m2) *C1 (
g C kg soil)
+
M2
kg m2– M1 (
kg m2)
*C2 (
g C kg soil)
*10
where M1 = 1995 A layer mass, M2 = 2003 A layer mass, C1 = concentration of A layer mineral soil, and C2 = concentration of B1 layer mineral soil.
Subtracting the 1992 or 1995 values from the 2003 values determined changes in charcoal C masses.
4.9 Statistical Analysis
The Biscuit Wildfire disrupted the original LTEP experimental design, but
replicate experimental units allow examining effects of fire type and thinning on charcoal C masses of O, A, and B1 layers. An alpha level of 0.1 was used in order to better
balance the probability of committing type I and type II errors rather than the conventional α = 0.05 (Zar 2010).
31
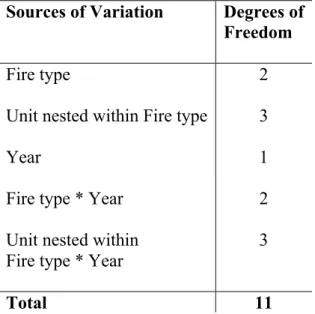
For each of O, A, and B1 layers, charcoal C masses were evaluated with respect to two factors, fire type (unburned [units ACC and ATN], prescribed burn [units ATB and BTB], and wildfire [units BCC and BTN]) and year (1995, 2003). Experimental unit was nested within fire type because each unit was measured in each of the two years. The two-way nested ANOVA table (Table 2) describes the sources of variation and degrees of freedom involved with this comparison (Underwood 1997). This analysis does not incorporate the original blocking because of the disruption by the wildfire.
Table 2: Two-way ANOVA table for comparison of fire type in Siskiyou – LTEP and Biscuit Wildfire soils.
Sources of Variation Degrees of
Freedom
Fire type 2
Unit nested within Fire type 3
Year 1
Fire type * Year 2
Unit nested within Fire type * Year
3
Total 11
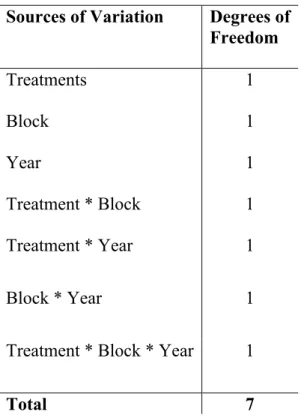
The effects of thinning on wildfire-influence charcoal C masses were analyzed with a fully crossed three-way ANOVA of thinned (BTN, IL1) and unthinned (BCC, ICC) units (Table 3). The analysis incorporates the blocking effect of the original LTEP experimental study design.
32
Table 3: Three-way ANOVA table for comparison of thinning treatments in Siskiyou – LTEP and Biscuit Wildfire soils.
Sources of Variation Degrees of
Freedom Treatments 1 Block 1 Year 1 Treatment * Block 1 Treatment * Year 1 Block * Year 1
Treatment * Block * Year 1
Total 7
The effect of fire type and thinning on changes in charcoal C mass was evaluated with a one-way ANOVA. Effect of thinning on changes in charcoal C mass was
evaluated with a randomized block ANOVA with the blocking from the original LTEP design. Tukey’s Honestly Significant Differences pair-wise comparisons were applied to significant ANOVA tests using an α = 0.1.
33
5.0 Results
5.1 Charcoal C of Reference and Other Materials 5.1.1 Reference Soils
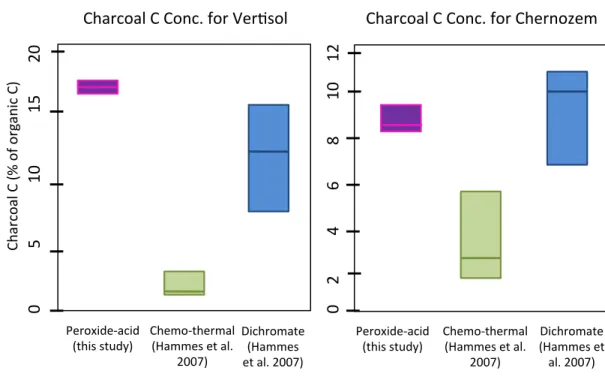
Charcoal C, as a percentage of organic C, was used to compare the peroxide-acid method to other published oxidation methods. For both the Vertisol and Chernozem reference soils, the peroxide acid charcoal C concentrations (Fig. 2) were greater than chemo-thermal oxidation values. Peroxide-acid digestion values were greater than dichromate-oxidation values reported for the Vertisol soil but were similar for the Chernozem soil (Hammes et al. 2007).
Figure 2: Charcoal C concentrations determined for reference soils, Vertisol (left) and Chernozem (right) (n=3 for peroxide-acid). The bars represent highest and lowest value. The box represents 50% of the data above and 50% of the data below the data median line in the middle of the box. Hammes et al. (2007) includes data from multiple labs.
!""""""""""""""#""""""""""""""$!"""""""""""""$#""""""""%!" &'()*+(,"&"-."+/"+)0(12*"&3" 45)+62758(*27" -9'2:":9;7<3" &'5=+89'5)=(,"->(==5:"59"(,?" %!!@3" A2*')+=(95" ->(==5:" 59"(,?"%!!@3" 45)+62758(*27" -9'2:":9;7<3" &'5=+89'5)=(,"->(==5:"59"(,?" %!!@3" A2*')+=(95" ->(==5:"59" (,?"%!!@3" !"""""%""""""""""B"""""""""C"""""""""D"""""""""$!"""""$%" &'()*+(,"&"&+1*?"/+)"E5)F:+," &'()*+(,"&"&+1*?"/+)"&'5)1+G5="
34
5.1.2 Reference Chars
The grass char had an average of 580 g organic C / kg char (SE ± 3) and an average of 109 g charcoal C / kg char (SE ± 2) by the peroxide-acid method, yielding an average of 19% of organic C is charcoal C (Fig. 3). The wood char averaged 731 g organic C / kg char (SE ± 4), but no charcoal C was detected because no material was recovered following the peroxide-acid digestion.
Figure 3: Charcoal C concentrations determined for reference grass (left) and wood (right) chars (n=2 for peroxide-acid). The bars represent highest and lowest value. The box represents 50% of the data above and 50% of the data below the data median line in the middle of the box. Hammes et al. (2007) includes data from multiple labs.
!"#$%&#'(!(!&)%*(+&$(,&&-(!"#$( ./$&01-/2#%1-( 34"15(546-78( !"/9&24"/$9#'(3:#99/5(/4(#'*( ;<<=8( <(((((((((((((;<((((((((((((><((((((((((((?<((((((((((((@<( !"#$%&#'(!(!&)%*(+&$(A$#55(!"#$( ./$&01-/2#%1-( 34"15(546-78( !"/9&24"/$9#'(3:#99/5(/4(#'*( ;<<=8( B1%"$&9#4/( 3:#99/5( /4(#'*(;<<=8( <(((((((((((((C<(((((((((((;<(((((((((((((D<((((((((((((><( B1%"$&9#4/( 3:#99/5( /4(#'*(;<<=8( !"#$%&#'(!(3E(&+(&$F#)1%(!8(
35
5.1.3 Laboratory and Siskiyou – LTEP Chars
O layer <20-mm charcoal particles averaged 338 g charcoal C /kg charcoal (SE ± 51), and mineral soil 4-20 mm charcoal particles averaged 200 g charcoal C/kg charcoal (SE ± 61) for A layer samples and 153 g charcoal C/kg charcoal (SE ± 8) for B1 samples, based on n = 2 for each layer. In those particles, organic C concentrations were 474 g organic C/kg charcoal (SE ± 54) for O layer, 603 g organic C/kg charcoal (SE ± 22) for A layer, and 518 g organic C/kg charcoal (SE ± 14) for B1 layer. The 4 – 20 mm charcoal particles averaged 0.39 g charcoal C /kg soil in the A layer and 0.10 g charcoal C/ kg soil in the B layer.. These concentrations are equivalent to 3% of the <4-mm charcoal C in the A layer and 1% in the B layer. This fraction was not considered further.
Chars created in the laboratory at different temperatures and analyzed for C content illustrate a range of C concentrations as a percent of organic C, which is
consistent with the BC continuum model. Charcoal C was 21% (SE ± 4%) of the organic C in char from wood exposed to lower temperatures (300°C) and 80% in char from wood exposed to higher temperatures (800°C). The Siskiyou – LTEP charcoal contains 74% (SE ± 15%) charcoal C/organic C in the O layer, 34% (SE ± 5%) charcoal C/organic C in the A layer, and 39% (SE ± 2%) charcoal C/organic C in the B1 layer (Fig. 4).
36
Figure 4: Charcoal C concentrations determined for 300°C lab generated chars, 800°C lab generated chars, and Siskiyou – LTEP charcoal using the peroxide-acid digestion method, (n=2). The bars represent highest and lowest value. The box represents 50% of the data above and 50% of the data below the data median line in the middle of the box.
!!"!!!!!!!!!!!#"!!!!!!!!!!!!!!!!!!!!!!$"!!!!!!!!!!!!!!!!!!!!!!%"!!!!!!!!!!!!!!!!!!!!!!&"!
'()*+,)-!'!./!,0!,*1)23+!'4!
5""6'! &""6'! 7!8)9:*! ;!8)9:*! <=!8)9:*! '()*+,)-!'!',2+>!0,*!8)?!)2@!A3BC39,D!E!8FGH!+()*+,)-B!
37
5.2 Quantification of Siskiyou – LTEP Soils
5.2.1 Charcoal C Across Experimental Units from 1992 and 1995 Samples
Pre-wildfire charcoal C concentrations in the < 4 mm mineral soil fractions
contained 11 (SE ± 1) g C/kg in the A layer and 6 (SE ± 0) g C/kg in the B1 layer (Fig. 5). These values represent 16% and 20% of the organic C in the mineral soils, respectively.
Areal masses of charcoal C contained an average of 18 (SE ± 5) kg C/ha in the O layer soils, 1830 (SE ± 89) kg C/ha in the A layer, and 6470 (SE ± 518) kg C/ha in the B1 layer soils (Fig. 6). O layer charcoal C masses have a high relative variability (CV = 92%). Charcoal C masses varied substantially in the O layer soils compared to the A and B1 layers.
38
Figure 5: Charcoal C concentrations, prior to the Biscuit Wildfire, for the A and B1 mineral soil layers (< 4 mm fraction) across 9 experimental units of the
Siskiyou – LTEP study. Subsequent experimental treatments and fire exposure
are indicated: * unburned, † prescribed burning, and § wildfire. The first three
units are block A, the second three units are block B, and the remaining units block I. !" #" $" %" &" '!" '#" '$" '%" !"#$%&#'(!(%&)%*)+$#,&)(-.!/0.(1(
2(3#4*$(
!" '" #" (" $" )" %" *" &" +" ,-./0-12" 345..678"1-9" ,:;2" 345..678"1-9",:;<" ,-./0-1=" 345..678"1-9",:;=" 345..678"1-9",:;<" ,-./0-1=" >-760?/6"345..678" ,:;=" 345..678"1-9" ,:;=" !"#$%&#'(!(%&)%*)+$#,&)(-.!/0.1(56(3#4*$(
39
Figure 6: Charcoal C masses, prior to the Biscuit Wildfire, for the O layer (<20-mm charcoal) and the A and B1 mineral soil layers (< 4 mm fraction) across 9 experimental units of the Siskiyou – LTEP study. Subsequent experimental
treatments and fire exposure are indicated: * unburned, † prescribed burning,
and § wildfire. The first three units are block A, the second three units are block B, and the remaining units block I.
!" #!!!" $!!!" %!!!" &!!!" '!!!" (!!!" )!!!" *!!!" +!!!" ,-./0-12" 345..678"1-9" ,:;2" 345..678"1-9",:;<" ,-./0-1=" 345..678"1-9",:;=" 345..678"1-9",:;<" ,-./0-1=" >-760?/6"345..678" ,:;=" 345..678"1-9" ,:;=" !"#$%&#'(!()#**(+,-!."#/(