duplicated by you for research, private study, criticism/review or educational purposes. Electronic or print copies are for your own personal, non-commercial use and shall not be passed to any other individual. No quotation
may be published without proper acknowledgement. For any other use, or to quote extensively from the work, permission must be obtained from the
by you for research, private study, criticism/review or educational purposes. Elec-tronic or print copies are for your own personal, non commercial use and shall not be passed to any other individual. No quotation may be published without proper acknowledgement. For any other use, or to quote extensively from the work, permis-sion must be obtained from the copyright holder/s.
in systematic reviews: reporting,
reproducibility and complexity
by
Babatunde Kazeem Olorisade
A thesis submitted in partial fulfilment of the
requirements for the award of the degree of
DOCTOR OF PHILOSOPHY
KEELE UNIVERSITY
Background: Challenges in the conduct of systematic reviews have led to research into and development of support tools targeting the process or specific stages. There is a growing body of research into the use of text mining methods for citation screen-ing support. However, these studies are reported with insufficient details to support reproducibility and technical comprehensibility of the models.
Aim: To investigate transparency in the reporting of citation screening in systematic reviews particularly as it relates to reproducibility and technical comprehensibility of the models.
Method: A literature review was conducted to investigate the methods being used for citation screening support and the type of information reported about them. Con-sequently, a reproducibility assessment of studies was undertaken to systematically assess the level of reproducibility of the studies and the factors responsible. This was followed by two studies to investigate the structural complexity of the models being used. A text mining based tool was developed to support citation screening and tool support research.
Results: The review showed a growing body of research but a lack of technical in-formation about models and reproducibility enabling inin-formation. The reproducibil-ity assessment identified information essential to study reproduction and suggested a checklist. The complexity assessment and feature enrichment studies reinforced the need for complexity related information in study reports. The citation screening tool demonstrated how a tool can be useful for both practice and research.
Conclusions: Research into text mining based tool support for citation screening in systematic reviews is growing. The field has not experienced much independent validation. It is anticipated that more transparency in studies will increase repro-ducibility and in-depth understanding leading to the maturation of the field. The citation screen tool presented aims to support research transparency, reproducibility and timely evolution of sustainable tools.
I would particularly like to thank the duo of Prof. Peter Andras and Prof. Pearl Brereton for their supervision of this work. Your constant motivation, encouragement and advice are invaluable. I would also like to thank Prof. Barbara Kitchenham for her help whenever her professional advice is sought on the project and for providing one of the datasets used in this project. I would also like to thank Dr Ed. de Quincey for his support during the conduct of the literature review in this work.
I am particularly grateful to the National Information Technology Development Agency (NITDA) for the award of the PhD scholarship through its NITDEF scholarship scheme, to conduct the research activities that lead to the results presented in this thesis.
Deserving appreciation, are all the staff of the Computing and Mathematics de-partment at Keele University. Thanks to all the teaching, technical and administrative staff who have helped even in the smallest way. I would like to thank all the past and present PhD students of the department with whom I have crossed paths. Thank you all for your friendship and contributions.
Special thanks must go to my loving wife - Rasheedat Yahaya and adorable daugh-ters - Kareemah and Aneesah for your support, motivation and endurance during the course of the study; One thousand and one words are not enough to express my love for you. I would like to thank my friends who have been of immense support during the project. I would like to thank my brothers and sisters for their support and prayer. On a final note, I will like to thank my late parents - Osuolale Olorisade and Idayat Olorisade (nee Raimi), who both toiled day and night to set me on the right path, may the almighty ‘Allaah’ forgive your sins (Ameen).
Whilst registered as a candidate for the above degree, I have not been registered for any other research award. The results and conclusions embodied in this thesis are the work of the named candidate and have not been submitted for any other academic award.
In the course of the PhD, work reported in this thesis was published and presented at a number of conferences. Details of the papers that were prepared for publication, including the conference and seminar activity, are presented in this section.
Journal articles
Olorisade, B. K., Brereton, P. and Andras, P. (2017). ‘Reproducibility of studies on text mining for citation screening in systematic reviews: Evaluation and checklist’. In: Journal of biomedical informatics73, pp. 113.
Conference papers
Olorisade, B. K., Brereton, P. and Andras, P. (2017). ‘Reproducibility in Machine Learning Based Studies: An Example of Text Mining’. In: Reproducibility in Machine Learning workshop at the 34th International Conference on Machine Learning. Sydney, Australia.
Olorisade, B. K., Brereton, P. and Andras, P. (2017). ‘Reporting Statistical Validity and Model Complexity in Machine Learning based Computational Studies’. In: Pro-ceedings of the 21st International Conference on Evaluation and Assessment in Software Engineering. ACM, pp. 128133.
Olorisade, B. K., Quincey, E. de et al. (2016). ‘A critical analysis of studies that address the use of text mining for citation screening in systematic reviews’. In: Pro-ceedings of the 20th International Conference on Evaluation and Assessment in Software Engineering. ACM, p. 14.
External talks
34th International Conference on Machine Learning (ICML 2017), Reproducibility in Machine Learning workshop, Sydney, Australia, July 2017.
21st International Conference on Evaluation and Assessment in Software Engineer-ing (EASE 2017), Karlskrona, Sweden, June 2017.
20th International Conference on Evaluation and Assessment in Software Engineer-ing (EASE 2016), Limerick, Ireland, June 2016.
Internal talks
TeMACS: A transparent tool for automatic citation screening in systematic reviews,
8thComputing Postgraduate Research Day, Keele University, April 2018.
Reporting statistical validity and model complexity in computational studies, 2nd Faculty of Natural Science Postgraduate Symposium, Keele University, May 2017. Reporting statistical validity and model complexity in computational studies, 7th Computing Postgraduate Research Day, Keele University, April 2017.
Text Mining Based Support System for Citation Screening in Systematic Review,1st Faculty of Natural Science Postgraduate Symposium, Keele University, June 2016. Three-minutes thesis (3MT),Institute of Liberal Arts and Sciences (ILAS) Postgraduate Conference, Keele University, April 2016.
A critical analysis of studies that address the use of text mining for citation screening in systematic reviews, 6th Computing Postgraduate Research Day, Keele University, April 2016.
Automatic citation screening in systematic reviews using text mining based tech-niques,5th Computing Postgraduate Research Day, Keele University, April 2015.
Posters
Reproducibility in Machine Learning Based Studies: An Example of Text Mining,
Automation of the citation screening stage in systematic review, Institute of Liberal Arts and Sciences (ILAS) Postgraduate Conference, Keele University, April 2016.
Contents xi
List of Figures xvii
List of Tables xix
List of Abbreviations xxi
Glossary xxiii
1 Introduction 1
1.1 Background . . . 1
1.1.1 Introduction to EBSE . . . 1
1.1.2 Introduction to systematic reviews . . . 2
1.1.3 Systematic review process . . . 3
1.1.3.1 Planning phase . . . 3
1.1.3.2 Execution phase . . . 4
1.1.3.3 Reporting phase . . . 4
1.1.4 Systematic review experience in SE . . . 5
1.1.5 Research motivation . . . 6
1.2 Research Objectives . . . 7
1.3 Original contributions . . . 8
1.4 Thesis organization . . . 9
2 Theoretical Preliminaries 13 2.1 Machine learning overview . . . 14
2.1.1 Supervised learning . . . 15
2.1.2 Unsupervised learning . . . 18
2.2 Text mining: an introduction . . . 18
2.2.1 Data retrieval . . . 18
2.2.2 Preprocessing . . . 19
2.2.2.1 Tokenization . . . 19
2.2.2.3 Stemming . . . 20
2.2.3 Feature representation . . . 20
2.2.3.1 Binary feature . . . 21
2.2.3.2 Term frequency . . . 21
2.2.3.3 Term frequency-inverse document frequency . . . 21
2.2.3.4 Word2vec . . . 21 2.2.4 Dimensionality reduction . . . 22 2.2.4.1 Feature selection . . . 22 2.2.4.2 Feature extraction . . . 24 2.2.5 Model training . . . 26 2.3 Model assessment . . . 27
2.4 Performance reliability and improvement . . . 29
2.4.1 Cross validation . . . 30
2.4.2 Ensemble learning . . . 31
2.5 Summary . . . 33
3 Literature Review 35 3.1 Introduction . . . 36
3.2 Automation of the SR process . . . 37
3.2.1 Complete SR process automation . . . 38
3.2.2 Specific stages automation . . . 38
3.3 The mapping study . . . 39
3.3.1 Research questions . . . 40
3.3.2 Search strategy . . . 40
3.3.3 Study selection criteria . . . 41
3.3.4 Data extraction . . . 41
3.4 Results . . . 42
3.4.1 Data extraction . . . 42
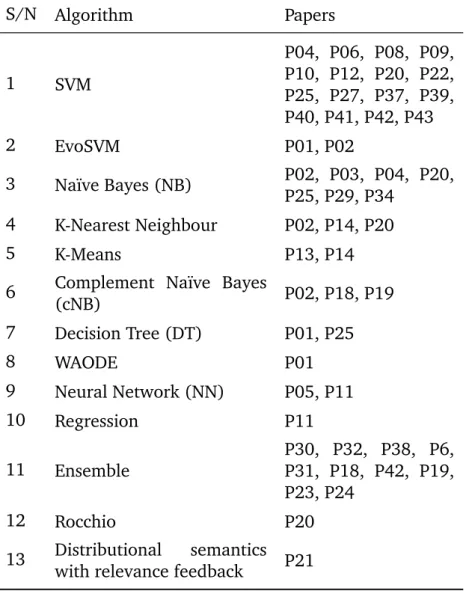
3.4.2 Algorithms: usage, information and justification . . . 46
3.4.2.1 Data size . . . 47
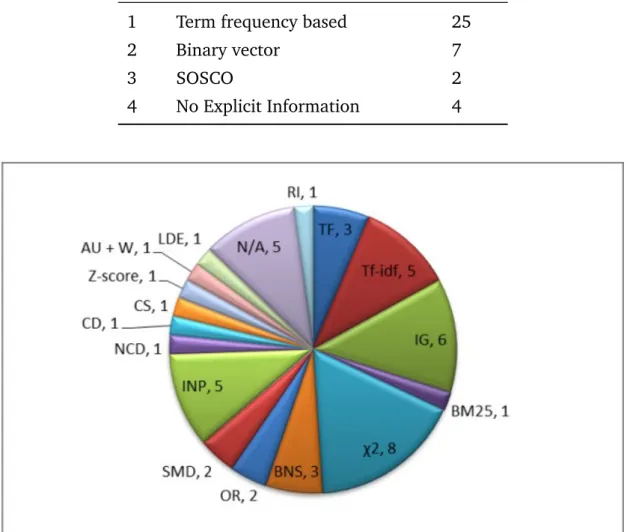
3.4.2.2 Feature representation . . . 48
3.4.2.3 Feature selection techniques . . . 48
3.4.2.4 Proposed tools and algorithms . . . 51
3.4.2.5 Third party frameworks . . . 52
3.4.3 Class imbalance and classifier performance . . . 52
3.4.4 Result comparability . . . 53
3.4.5 Threats to study validity . . . 55
3.5 Literature update . . . 56
3.6 Replication/reproduction practice . . . 58
3.8 Summary . . . 61
4 Reproducibility Assessment 63 4.1 Introduction . . . 63
4.1.1 Reproduction of computational studies . . . 64
4.2 Study reproducibility . . . 66 4.2.1 Reproduction analysis . . . 67 4.2.1.1 Data retrieval . . . 67 4.2.1.2 Preprocessing . . . 67 4.2.1.3 Feature selection . . . 68 4.2.1.4 Model training . . . 68 4.2.1.5 Model assessment . . . 69
4.2.2 Assessment framework definition . . . 69
4.2.3 Reproducibility assessment . . . 73
4.3 Results . . . 73
4.3.1 Reproduction analysis . . . 73
4.3.2 Definition of the assessment framework . . . 78
4.3.3 Reproducibility assessment . . . 79
4.3.4 Threats to study validity . . . 80
4.4 Data retrieval update . . . 82
4.5 Discussion . . . 82
4.5.1 Reproducibility checklist . . . 83
4.5.2 Checklist application . . . 85
4.5.3 Conclusions from the checklist application . . . 88
4.6 Summary . . . 90
5 Reporting model complexity in CS studies 93 5.1 Introduction . . . 94
5.2 Model selection and complexity . . . 94
5.3 Complexity in SVM classification models . . . 95
5.4 Complexity assessment . . . 96 5.4.1 Data retrieval . . . 96 5.4.2 Text preprocessing . . . 97 5.4.3 Feature representation . . . 100 5.4.4 Feature selection . . . 100 5.4.5 Parameter selection . . . 100
5.4.6 Model training and assessment . . . 100
5.5 Results . . . 102
5.6 Results analysis . . . 102
5.8 Discussion . . . 107
5.9 Summary . . . 111
6 Feature Enrichment 113 6.1 Introduction . . . 113
6.2 Mitigating class imbalance effect . . . 114
6.3 Feature enrichment study . . . 116
6.3.1 Data retrieval . . . 116 6.3.2 Feature selection . . . 117 6.4 Results . . . 117 6.4.1 Data retrieval . . . 117 6.4.2 Feature representation . . . 117 6.4.3 Dimensionality reduction . . . 117 6.4.4 Model assessment . . . 120 6.4.4.1 Performance measures . . . 120 6.4.4.2 Complexity measures . . . 123
6.5 Threats to study validity . . . 124
6.6 Discussion . . . 125 6.7 Summary . . . 126 7 TeMACS - A CS Tool 127 7.1 Introduction . . . 127 7.2 TeMACSfeatures . . . 129 7.2.1 Create project . . . 129
7.2.2 Create new model . . . 130
7.2.3 Load data . . . 131 7.2.4 Build model . . . 132 7.2.4.1 Data retrieval . . . 134 7.2.4.2 Parameter selection . . . 135 7.2.4.3 Preprocessing . . . 136 7.2.4.4 Dimensionality reduction . . . 136 7.2.4.5 Model training . . . 136 7.2.4.6 Final models . . . 136 7.2.5 Reuse model . . . 137
7.3 TeMACSreproducibility support . . . 137
7.4 Limitations of theTeMACS . . . 138
7.5 Conclusions and future direction . . . 139
8 Discussion 141 8.1 Introduction . . . 141
8.2.1 Literature review . . . 142
8.2.2 Reproducibility assessment . . . 143
8.2.3 Response to RQ1 . . . 143
8.3 Reproducibility essentials . . . 144
8.3.1 Checklist validation and update . . . 144
8.3.2 Response to RQ2 . . . 146
8.4 Complexity reporting motivation . . . 147
8.4.1 Complexity assessment . . . 147
8.4.2 Feature enrichment . . . 148
8.4.3 Response to RQ3 . . . 148
8.5 Transparent CS tool . . . 149
8.6 Threats to research validity . . . 149
8.6.1 Construct validity threats . . . 149
8.6.2 External validity threats . . . 150
8.6.3 Internal validity threats . . . 150
8.6.4 Conclusion validity threats . . . 150
8.7 Summary . . . 151
9 Conclusions and Future Work 153 9.1 Summary and conclusions of the research . . . 153
9.2 Future directions for the CS tool . . . 155
9.3 Recommendations and future work . . . 156
References 158 A Excluded Papers 177 B Explanation of Terms in Reproducibility Study 179 B.1 Tags in Table 4.7 . . . 179
B.2 Model parameters . . . 180
B.3 Some terms/phrases in Table 4.8 . . . 180
C Reproducibility Information 183 D TeMACS - Design and Development Details 185 D.1 TeMACS features . . . 185
D.1.1 Managing a user profile . . . 185
D.1.1.1 Register . . . 185
D.1.1.2 Login . . . 186
D.1.1.3 Password reset . . . 187
List of Figures xvii
1.1 Systematic review process with task interactions . . . 5
1.2 Thesis organization . . . 12
2.1 Illustration of SVM classification for linearly separable data . . . 16
2.2 Illustration of SVM classification of non-linearly separable data . . . . 16
2.3 SVM projection of non-linear data with kernel trick . . . 17
2.4 Text mining process . . . 19
3.1 Number of classifiers used in the studies . . . 50
3.2 Corpus size range used across all studies . . . 50
3.3 Feature selection/extraction techniques distribution . . . 51
4.1 Detailed TM process with intermediate output . . . 71
4.2 Distribution of studies containing information to support reproducibility 88 5.1 Normalized distribution of relevant-irrelevant candidate articles . . . . 98
5.2 Normalized size ratio of negative SVs . . . 107
5.3 Normalized size ratio of positive SVs . . . 108
5.4 Negative samples used as training and SVs . . . 109
5.5 Positive samples used as training and SVs . . . 110
7.1 TeMACS home screen . . . 129
7.2 High level information flow inTeMACS . . . 130
7.3 New project creation screen shot . . . 131
7.4 Screen shot of the new model creation page . . . 131
7.5 Screen shot of the load data page . . . 132
7.6 Screen shot of the view data page . . . 132
7.7 Screen shot of ongoing classification process . . . 133
7.8 Screen shot of complete classification process . . . 134
7.9 Screen shot of the email sent on completion of the model training and prediction . . . 135
7.10 Screen shot of folder containing the trained classification model and
feature vectors saved for future reuse . . . 137
7.11 Screen shot of the model reuse page . . . 138
D.1 Screenshot to register new user . . . 186
D.2 ER diagram for the application . . . 187
D.3 Login use-case . . . 188
D.4 TeMACS login page . . . 188
D.5 TeMACS dashboard . . . 189
D.6 Screenshot for requesting new password . . . 189 D.7 Architecture for running the classification process in the background . 190
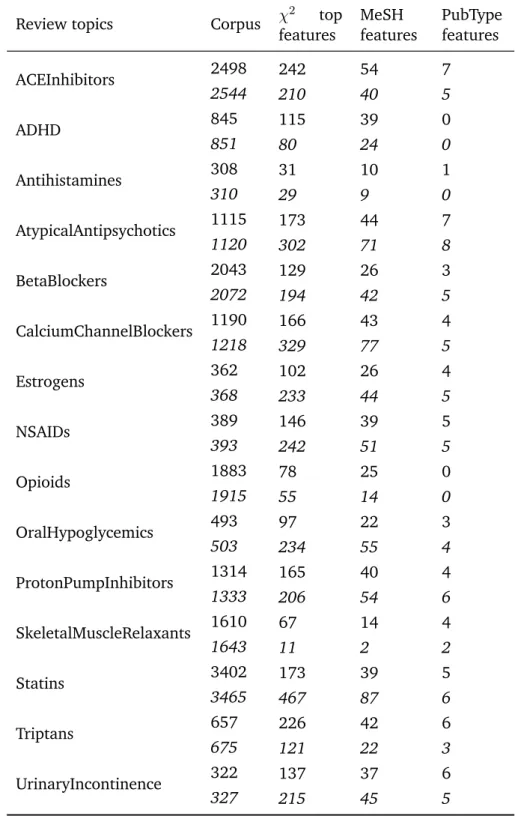
List of Tables xix 2.1 Confusion matrix . . . 27 2.2 Confusion matrix to illustrate metrics’ pros and cons . . . 30 2.3 5-fold CV illustration . . . 31 3.1 Systematic review phase managed by the tools . . . 38 3.2 List of included papers . . . 43 3.3 Classification algorithm used by year . . . 47 3.4 Classification algorithms used in different papers . . . 48 3.5 Classifier variants usage . . . 49 3.6 Feature representation techniques usage . . . 51 3.7 Studies with common dataset . . . 54 3.8 List of updated papers . . . 57 4.1 Values describing the attributes . . . 70 4.2 Summary assessment tags . . . 71 4.3 Attributes-element combination . . . 73 4.4 Retrieved corpus size(s) and number of top features α = 0.05(Cohen
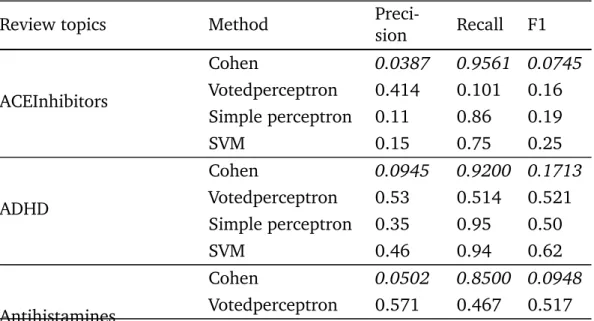
et al.’s appears in italics) . . . 75 4.5 5X2-fold CV results . . . 76 4.6 A typical assessment output of a study (see footnote for abbreviations
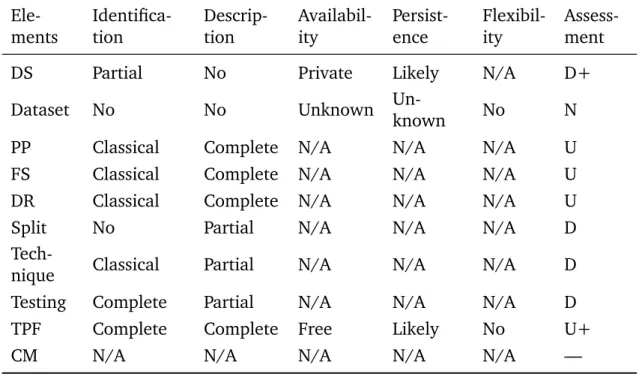
in column 1) . . . 80 4.7 Summary assessment of the reproducibility assessment . . . 81 4.8 The preliminary draft of the reproducibility enabling information
check-list for TM studies - version 1.1 . . . 84 4.9 Summary of the Assessment of 33 studies based on the checklist
(ver-sion 1.2) . . . 86 4.10 Checklist (version 1.2) application on 30 studies for essential
repro-duction information . . . 87 4.10 Checklist (version 1.2) application on 30 studies (continued) . . . 87 5.1 Corpus retrieved for each review . . . 97
5.2 Top Selected Features . . . 99 5.3 Datasets split size for cross validation . . . 101 5.4 Word2Vec Linear Kernel (W2V-L) . . . 103 5.5 Word2Vec Non-linear Kernel (W2V-NL) . . . 104 5.6 Binary Non-linear Kernel (B-NL) . . . 105 5.7 Paired t-test result for difference in number of SVs . . . 106 6.1 Number of references retrieved per study . . . 118 6.2 Class distribution of retrieved references . . . 119 6.3 χ2 selected top features . . . 121 6.4 Binary feature non-linear kernel . . . 122 6.5 Word2vec feature with linear SVM kernel . . . 123 6.6 Word2vec feature non-linear kernel . . . 124 8.1 Validation of checklist with nine review update studies . . . 145 A.1 List of excluded papers . . . 178 B.1 SVM parameters settings . . . 180 B.2 Perceptron parameters settings . . . 180 C.1 Software information . . . 184
AHRQ Agency for Healthcare Research and Quality. BD2K Big Data to Knowledge.
BOW Bag-of-Words.
CLEF Conference and Labs of the Evaluation Forum. CS Citation Screening.
CV Cross Validation.
DERP Drug Evaluation Review Program. DM Data Mining.
EASE Evaluation and Assessment in Software Engineering. EBSE Evidence-Based Software Engineering.
EPC Evidence-based Practice Center.
ESEM Empirical Software Engineering and Measurement. FAIR Findable, Accessible, Interoperable and Reusable. HTML Hypertext Markup Language.
http Hypertext Transfer Protocol. IE Information Extraction.
IR Information Retrieval.
KDD Knowledge Discovery in Databases. LDA Latent Dirichlet Allocation.
LSI Latent Semantic Indexing.
MDL Minimum Description Length. MeSH Medical Subject Heading. ML Machine Learning.
NIH trans-National Institute of Health. NLP Natural Language Processing.
NTCIR NII Testbeds and Community for Information access Research. PCA Principal Component Analysis.
PMID Pubmed Identification. SE Software Engineering.
SGML Standard Generalized Markup Language. SQL Structured Query Language.
SR Systematic Review. SV Support Vector.
SVD Singular Value Decomposition. SVM Support Vector Machine. tf term frequency.
tf-idf term frequency-inverse document frequency. TM Text Mining.
TREC Text REtrieval Conference. URL Universal Resource Locator. WSS Work Saved over Sampling. XML eXtended Markup Language.
Some of the terminologies used in this work has been derived from multiple discip-lines. The glossary does not represent formal definition but an attempt to quickly familiarise the reader to the concepts.
class — A set of specific target output attributes/groups/categories of the data. classifier — Refers to a model created through the implementation of a classification
algorithm, that maps input data to a set of output categories.
conclusion validity — This type of limitation to the validity of a study concerns the relaibility of the conclusions of the study.
construct validity — This type of validity limitation raises questions on how well the design choices for the study is able to address the research questions. external validity — This concerns limitations regarding whether the outcome of a
study can be genaralised to other situations.
feature — In text mining, this is a feature (or term) refers to an individual distinct word/text unit that collectively compose the body of text.
fit — The process of creating a simplified representation (model) of a dataset in a way that it can be generally used successfully given new data. For example, to identify data similar to the one it was trained on.
internal validity — This is a type of validity limitation introduced by other bias factors or conduct of the study.
learning — The mastering of the underlying distribution/pattern of a dataset and the mapping of each data input to some target attribute.
model — An abstract representation of the real distribution of a dataset. It is the artefact produced as a result of the training process.
negative class — Name used to represent the output category of no interest in a dataset during classification.
over-fitting — Describes a situation when the model too close to the reality. That is, it ended up learning both the detail and the noise in its training data to the detriment of its performance on new data.
pickle — A module in Python that implements binary protocols for serializing and de-serializing a Python object structure. Pickling in Python refers to the process of converting an object to byte stream for storage purposes and un-pickling is the opposite..
positive class — Name used to represent the output category of interest in a dataset during classification..
predict — Describes the process where a trained machine learning model attempt to suggest the class of a new data given its underlying dataset’s classes.
scrape (scraping/web scraping) — The process of using automatic software to gather specific (textual) information from websites.
stemming — The process of removing inflection (suffixes, prefixes and affixes) from words to return them to their original root (stem) forms.
training — The process of providing a machine learning model with a set of data to learn from.
weight — The value assigned to data points (or class of data) during weighting. weighting — The process of assigning a multiplication ‘cost’ to data points in
ma-chine learning to empasize the importance or otherwise of the data (sometimes used as class, term, feature or sample weighting).
Introduction
T
his thesis presents a set of studies undertaken to investigate experimental transparency in studies reporting the use of text mining techniques for auto-matic citation screening in systeauto-matic reviews in relation to reproducibility and un-derstanding of complexity of the text mining models. The work leads to the de-velopment of a ‘transparent’ text mining based tool to support citation screening in systematic reviews and set the stage for cross-team research collaboration.This chapter describes the focus of the thesis, which concerns experimental trans-parency, reproducibility and structural complexity of the models used in text mining studies relating to automatic citation screening in systematic reviews. Reproducibil-ity in this work implies the abilReproducibil-ity to reproduce study results through the replication of their processes while complexity refers to the hypothesis the techniques utilize in making the classification decisions. A brief introduction to evidence-based software engineering, the systematic reviews process with an emphasis on citation screening and the challenges of the method are provided. The research questions of the work are outlined and the work’s motivation and objectives are explained. The novelty of the thesis and its contribution to knowledge are pointed out. The chapter ends with an outline of the structure of the thesis.
1.1
Background
A brief introduction to Evidence-Based Software Engineering (EBSE) and the Sys-tematic Review (SR) process is presented in this section. The section also contains a highlight of the SR process.
1.1.1
Introduction to EBSE
Evidence-based research and practice was initially adopted and has been successfully practised in medicine (Sackett, Rosenberg, Gray, Haynes, & Richardson, 1996; McK-ibbon, 1998; Reynolds, 2008). The success has lead to its adoption in other research
areas like nursing, sociology, education, psychology etc. (Kitchenham et al., 2009; on Evidence-Based Practice, 2006) and eventually Software Engineering (SE) (Kit-chenham, Dyba, & Jorgensen, 2004).
In 2004, Kitchenham et al. (2004), suggested an evidence-based research ap-proach, EBSE, to the SE community in order to bridge the gap between research and practice. The objective of EBSE is to make available, empirical evidence to as-sist practitioners make informed decisions when adopting SE techniques and prac-tices (Dyba, Kitchenham, & Jorgensen, 2005). In consistency with evidence-based medicine, EBSE requires the following five steps to execute (Dyba et al., 2005):
i) Convert a relevant problem or information need into an answerable question. ii) Search the literature for the best available evidence to answer the question. iii) Critically appraise the evidence for its validity, impact, and applicability.
iv) Integrate the appraised evidence with practical experience and the customer’s values and circumstances to make decisions about practice.
v) Evaluate performance and seek ways to improve it.
Steps ‘ii’ and ‘iii’ are achievable through a methodical review of the literature - SR. EBSE is therefore anchored on SR for the gathering of the right evidence. A detailed report on how to conduct SRs in the context of SE is published in Kitchenham et al. (2004) and updated in Kitchenham and Charters (2007), Kitchenham, Budgen, and Brereton (2015).
Since its introduction and adoption, EBSE has continue to grow considerably in different topics of SE. In a tertiary study covering the use of SR in SE between 2004 and 2008, 20 unique studies were found by (Kitchenham et al., 2009) with addi-tional 33 in (Kitchenham et al., 2010) over the same period. By extending the tertiary study search date to 2009, Da Silva et al. (2011) found an additional 67 studies. This, in addition to at least two annual conferences with emphasis on em-pirical research and preference for SRs - the international conference on Evaluation and Assessment in Software Engineering (EASE) and the international conference on Empirical Software Engineering and Measurement (ESEM), are indicative that EBSE (and invariably SR) has become an intrinsic part of SE research.
1.1.2
Introduction to systematic reviews
Literature review is an integral component of every research activity. Traditionally, the task of searching, gathering and reviewing of literature are conducted in an ad-hoc way. This approach exposed the practice to at least two identifiable flaws:
i) exhaustive coverage of existing literature is not guaranteed. ii) the process is usually not repeatable.
The poor quality of narrative reviews increased the quest for more formal methods for producing a systematic and explicit way to provide up-to-date evidence on a subject of interest. SR (also sometimes referred to as systematic literature review (SLR)), is a literature review approach that provides a rigorous, dependable and ‘auditable’ re-view methodology with the main goal of building an impartial and complete synthesis of available empirical research evidence on a specific topic; thus, creating a focused platform on which practically useful decisions and conclusions can be made (Kitchen-ham et al., 2004; Kitchen(Kitchen-ham et al., 2015; Higgins & Green, 2011).
SR process consists of three major phases: planning, execution and document-ation (Kitchenham et al., 2004; Kitchenham & Charters, 2007; Kitchenham et al., 2015). These phases are further divided into stages. The phases, constituent stages and the interaction between each of the stages is shown in Figure 1.1.
1.1.3
Systematic review process
The SR is conducted following a laid out approach decided before the process is commenced. Figure 1.1 shows the three phases of the SR and 10 stages of activities in the phase (Kitchenham & Charters, 2007). The stages of each phase are briefly discussed in this section.
1.1.3.1 Planning phase
The goal of the planning phase is the production of a ‘protocol’ - a priori laid down plan on how the review process will be conducted, candidate studies judged and research questions to be answered by the review outcome. The planning involves three stages:
i) research question: The first stage is the definition of questions that will provide a direction to the need of the SR, the construction of the string for document search and the types of data required to satisfy the inquiry (Kitchenham et al., 2015; Kitchenham & Charters, 2007).
ii) protocol development: the second stage is the development of a review pro-tocol. The protocol contains detailed definition of the process to be adhered to during the review. This includes outlining the approach to undertake while searching and selecting the candidate studies, conditions to be met by each study for consideration in the review, the data to be extracted from each study, assessment criteria, study allocation to reviewers etc.
iii) protocol validation: This includes running a pilot review to test the understand-ing and relevance of the protocol prior to review scale application. This may lead to the revision of the protocol. The protocol can be revised at any stage when any inadequacy is identified.
1.1.3.2 Execution phase
The guidelines specified in the planning phase are applied to the five tasks identified for the execution phase. So, once a version agreed to by all members of the review team is available the execution phase can commence. The five stages involved are:
i study identification: The first stage of the execution phase is to identify candid-ate studies using the search strcandid-ategy defined in the protocol. The coverage of every possible research likely to be relevant to the review is key to the success of this stage (Kitchenham et al., 2015; Kitchenham & Charters, 2007).
ii citation screening/study selection: The second stage of the execution phase is the filtering of relevant studies from the outcome of the identification stage ap-plying the criteria for inclusion and exclusion predefined in the ‘protocol’. This is normally conducted in two steps: first, by removing the clearly irrelevant studies based on the content of their titles and abstracts while the second one is by reading the full content of the remaining studies to determine if they are actually relevant based on the conditions set out in the inclusion/exclusion cri-teria. For the sake of reliability, it is recommended that each article be screened by at least two reviewers with a chance for resolution over any disagreement. iii study evaluation: Following an agreement by the review team on a set of
qual-ified studies, their quality are assessed based on predefined criteria.
iv data extraction: Information in each study that qualifies for each data item defined in the extraction form are extracted.
v data synthesis: The concluding stage of the execution phase is the collation and aggregation of the extracted data with the intent of answering the research questions.
1.1.3.3 Reporting phase
Once the review process is concluded, then it is time to formally document and report all the processes and outcomes.
i) define strategy: At this stage the reviewers may define how the report is to be written and organised in consonance with the protocol and the research ques-tion. Further suggestions on the possible structure and contents of the report can be found in (Kitchenham et al., 2015; Kitchenham & Charters, 2007). ii) reporting and validation: The final stage is to formally write the review report
Figure 1.1: Systematic review process with task interactions
1.1.4
Systematic review experience in SE
The growing interest in empirical research and SR in particular has lead to useful feedback on the use of the SR guidelines proposed by Kitchenham (2004). Several researches have reported the guidelines as fit for purpose and have suggested areas in need of improvement based on their experiences, expertise and needs (Staples & Niazi, 2007; Brereton, Kitchenham, Budgen, Turner, & Khalil, 2007; Dyba, Dingsoyr, & Hanssen, 2007; Riaz, Sulayman, Salleh, & Mendes, 2010; Turner, Kitchenham, Budgen, & Brereton, 2008). An alternative guideline for SR in SE was proposed by Biolchini, Mian, Natali, and Travassos (2005).
A tertiary study by Kitchenham and Brereton (2013) identified about 18 areas in need of improvement suggested across experience studies. Some of these improve-ment suggestions include procedural improveimprove-ments while some advocate for tool or other forms of external support. The challenge posed by the amount of time and effort consumed by conducting a SR is common among the experiences (Riaz et al., 2010; Babar & Zhang, 2009; Zhang & Babar, 2013; Petersen, Feldt, Mujtaba, & Matt-sson, 2008; Brereton et al., 2007; Carver, Hassler, Hernandes, & Kraft, 2013). Some studies have favoured the need for a tool to support the whole (design, conduct and reporting) SR process (Zhang & Babar, 2013).
These drawbacks have positioned the processes involved in the conduct of the SR as prime candidates for automated support tools. Staples and Niazi (2007) be-lieve success in the automation may be achieved faster by targeting individual stages rather than the whole process. Data extraction, study selection and data synthesis have featured as the top areas in need of automated support (Staples & Niazi, 2007; Hassler, Carver, Kraft, & Hale, 2014; Z. Yu, Kraft, & Menzies, 2016). Study identific-ation is another area that has been identified to be manual and labour intensive that could benefit from automated tools (Carver et al., 2013).
SRs are conducted to gather evidence to improve the body of knowledge of any particular subject, therefore, they are often repeatedly conducted at intervals to up-date existing knowledge. The current rate of publications and the time it takes to complete a review may make the findings of a review become out-dated quickly. On average, a medical review takes one year from protocol development to publica-tion (Borah, Brown, Capers, & Kaiser, 2017). So, a tool that preserves the states (of each stage) of the previous review and update the states with new review exercise is potentially useful at reducing repeated activities and updating findings.
A number of studies have been published on the subject of automated tools to sup-port SR resulting in a range of tools. One of the prevailing approaches in the auto-mation is the use of Machine Learning (ML) techniques, a computational method, through Text Mining (TM). The Citation Screening (CS) stage is one of those that had attracted the greatest interest in terms of applying TM techniques for SR sup-port. More details on the current efforts at providing automated support for the whole process and individual stage of the SR is discussed in Section 3.2. O’Mara-Eves, Thomas, McNaught, Miwa, and Ananiadou (2015) reviewed 44 articles on the application of TM to support the CS stage of the SR published between 2006 - 2014. An additional 12 articles were found covering 2015 - 2018 (see Section 3.5). Only five tangible tools have so far evolved from the studies reported in the articles - AB-STRACKR (Wallace, Small, Brodley, Lau, & Trikalinos, 2012), Gapscreener (W. Yu et al., 2008), SWIFT-Review (Howard et al., 2016), Rayyan (Khabsa, Elmagarmid, Ilyas, Hammady, & Ouzzani, 2016; Ouzzani, Hammady, Fedorowicz, & Elmagarmid, 2016) and Fastread (Z. Yu et al., 2016).
Further issues associated with the use of computational methods, TM in this case is to provide automated support tool for SR processes particularly the CS stage will be further discussed in the next section.
1.1.5
Research motivation
Reporting scientific experiments in a way that the results can be understood and independently reproduced is a standard requirement of scientific reporting. It is however difficult to ensure computational experiments are well communicated and reproducible (Goecks, Nekrutenko, & Taylor, 2010). The application of computa-tional methods for building support tools for the conduct of the CS has its own draw-backs particularly in effectively reporting and communicating the research process to others. In an attempt to provide solution to some of the identified SR drawbacks through automation with TM models, the computational methods employed lead to other issues like research reproducibility and transparency, understanding and deal-ing with the models’ complexity among others. Complexity in the ML context is considered in terms of the comparative relation between the data size, the feature
vector size (see Section 2.2.2) and the size of the classification algorithm’s hypothesis space (Joachims, 1998). The lower the complexity of a model the better it has learnt to generalize over the dataset. The larger the size of a dataset the better the learning (chances) of a ML model and (possibly) the lower the model’s complexity.
The tools mentioned in Section 1.1.4 and studies reviewed in Section 3.3 have shown the potential of TM techniques to improve reviewers’ experience in the CS stage of the SR and possibly the quality of the review outcome. Specifically by re-ducing the amount of reviewer time and effort spent selecting relevant studies and reducing human bias applicable to this stage. Despite these advantages, the tools and the 56 studies reviewed in Chapter 3 on the use of TM techniques to provide automated support for the CS stage of SR have shown a lack of experimental trans-parency. Independent researchers due to the multiple complex procedures of the tools and methods are unable to independently reproduce the results or replicate the processes. Consequently, the ability of independent researchers to understand the complexity of the models which may be used to interpret their performance and propose changes or improvements to these existing tools and methods is limited.
Reproducibility of experimental outcomes is a key phase of scientific enquiry, which provides the foundation for understanding, integrating and extending exist-ing results towards new discovery (Goecks et al., 2010). In a similar way, ‘good reporting’ has been reported to be an essential component to future research devel-opment (Miguel et al., 2014). Thus, good reporting and reproducibility are critical to knowledge advancement and a shorter new discovery turnaround in an evolving
field. Only two of the tools have been reported independently evaluated, ABSTRACKR (Rath-bone, Hoffmann, & Glasziou, 2015; Gates, Johnson, & Hartling, 2018) and Rayyan (Olofs-son et al., 2017; Couban, 2016); none of the studies have their results independently reproduced.
There have been many studies published on the use of TM techniques for auto-matic CS. The field and awareness of the potential of this method is growing, ex-perimental datasets are becoming more accessible thus the number and potentials of studies are rapidly increasing. But all these are still with low levels of collabor-ative research and independently reproduced results. There is an absence of study replication and insufficient technical details in reports. Therefore an in-depth invest-igation into the usefulness of these discovery evolution and enabling issues would be beneficial to the research community.
1.2
Research Objectives
The overarching goal of this thesis is to investigate aspects of the quality of reports in studies on automatic tools for CS in SR using TM techniques. Particularly, how the information provided in the reports support reproducibility and understanding
of the quality of the models being reported vis-á-vis model complexity. The specific objectives of the thesis are to investigate:
i) transparency in TM based CS studies based on the level of information provided on the experimental procedures and the resulting models.
ii) the conditions for the reproducibility of the study results and how this is satis-fied by the studies.
iii) the need for reporting the complexity details of the TM models. Three research questions were developed to guide the focus of this project:
RQ1: What information is required to improve experimental transparency in studies reporting the use of TM techniques for automatic CS in SRs?
RQ2: What information is essential to the reproducibility of TM for CS studies? RQ3: What information about model complexity should be included in TM based CS studies?
1.3
Original contributions
This thesis reports a novel investigation into the issues surrounding experimental transparency in reporting and how it affects study reproducibility and understanding of the complexity of TM models in automatic CS studies. Specifically, the inadequa-cies of the current reporting is established, and the most important information to enhance the reproducibility of TM based automatic CS studies identified. More de-tails about how specific units of the work have contributed to knowledge in this area are enumerated below:
i) A mapping study, reported in Chapter 3 is the first in the field to investigate the issue of transparency and to assess the information provided in studies re-porting the use of TM techniques to support CS in SR. This work was presented at the20thInternational Conference on Evaluation and Assessment in Software Engineering (Olorisade, de Quincey, Brereton, & Andras, 2016).
ii) The reproducibility assessment work reported in Chapter 4 is the first to invest-igate reproducibility issues in the field. It is also the first to propose a checklist of information that may ensure studies in this area are reproducible. Its findings were reported in the Journal of Biomedical Informatics (Olorisade, Brereton, & Andras, 2017c) and a workshop paper at the34th International Conference on Machine Learning (Olorisade, Brereton, & Andras, 2017b).
iii) The complexity assessment work reported in Chapter 5 is the first to investigate complexity issues of the TM models for automatic screening of citations in SRs
and the need to report complexity metrics. It is also the first time the Word2vec will be investigated as a feature type in studies for automatic CS. The study findings were presented as a short paper at the 21st International Conference on Evaluation and Assessment in Software Engineering (Olorisade, Brereton, & Andras, 2017a) with an expanded manuscript currently been reviewed for publication in the Research Synthesis Methods journal.
iv) The feature enrichment work reported in Chapter 6 investigates the effect of adding bibliography data to article title and abstract on the performance of models and complexity. The study is the first to compare the performance and complexity of models built from the traditional title and abstract (and optional keywords) with those built by adding bibliography features to the title and abstract. As at the time of writing this thesis, the findings from the study is being prepared for a journal publication.
v) The CS tool -TeMACSpresented in Chapter 7 is a web based document classific-ation tool which aims to support reviewers in automatic screening of citclassific-ations in SRs. At the same time, it aims to support automated CS tool researchers by providing information that may help in reproducing its processes and under-standing the complexity of its models’ decision making. The CS tool is the first of its kind that support explicitly, the transparency and reproducibility of CS in SRs.
Despite the fact that this work is being conducted within a software engineering locale, SRs are used in many disciplines. Research into automated support for CS is most prevalent in the healthcare and software engineering fields. On providing support for the CS stage, more work has been undertaken in the healthcare field. Thus, the challenges highlighted and investigated through studies in this work affects studies from other domains. Therefore, the contributions of this work are not limited to software engineering but can be generalised to other domains.
1.4
Thesis organization
A short description of the chapters that constitute this thesis is presented in this sec-tion. A pictorial representation of the relationship between the chapters is presented in Figure 1.21.
InChapter 2, a brief theoretical background on ML is provided. Two major learn-ing approaches: the supervised and unsupervised learnlearn-ing were highlighted. The 1In the figure, if there are two possible paths exiting a node, different colours are used to indicate
the split. The split colours are maintained to highlight the branch path until the main path is rejoined; at which point the initial colour is again used.
chapter introduces TM with a presentation of its process. Performance metrics par-ticularly those relevant to the studies reported in this work are also presented. The background presented in the chapter provides a theoretical context for the work re-ported in other chapters of the thesis.
In the early stage of the research, a mapping study which evaluates the type and extent of information provided on the TM techniques that are being proposed for the automatic screening of citations in SRs is conducted and presented inChapter 3. The review of the background literature has been presented through a combination of SR methodology and supplementary literature search to ensure up to date information is provided. The review establishes the need for more experimental transparency in the reviewed articles and the potential to investigate support for reproducibility and model complexity issues in candidate articles.
Driven by the outcomes of the review in Chapter 3, Chapter 4 presents a repro-ducibility assessment. This study is aimed to assess the reprorepro-ducibility of selected studies, which are intended to provide automated support for the CS stage of SR. The studies cover both software engineering and medical fields. The assessment is based strictly on the information provided in the selected studies. The work identifies a set of information items that can improve transparency of studies report and its re-producibility. A checklist of these information items is proposed to guide researchers and academic review process.
In continuation of building on the outcomes of the review in Chapter 3,Chapter 5 presents a study aimed at investigating model complexity and statistical validity is-sues in TM models to support CS in SR from selected studies. The study builds Support Vector Machine (SVM) models representative of typical models in the selec-ted studies and explore their complexity through the number of Support Vector (SV)s used by the models. The complexity is used to determine whether there is enough concern to warrant its being reported beside being in compliance with scientific re-quirements. The conclusion indicated high complexity in the models.
Chapter 6 presents a study aimed at investigating how the improvement in the quality of the data with bibliography information will affect model performance and complexity. The study replicates the classification approach in the previous chapter, changing only the data content and the χ2’s α value for reducing the dimension of
the feature vector. The conclusions of this study show a strong promise at reducing complexity and increasing performance but its not definitive.
The studies reported in Chapters 4 and 5 show possible effects of the absence of critical information in TM based automatic CS study reports. Whilst maintaining transparency vis-á-vis this information in compliance with the scientific requirement for experimental transparency is useful, effectively communicating a computational study to the extent of being reproducible is challenging. InChapter 7, a novel trans-parent tool - “Text Mining based tool for Automatic Citation Screening (TeMACS)”
-for CS was introduced. TeMACS is a document classification is an open web-based tool which incorporates some of the methods and outcomes of studies from previous chapters to demonstrate how a CS tool can be developed to be useful for both SR practitioners and automatic CS researchers. The design, development and features of the tool are reported.
In Chapter 8, the findings from the different studies reported in this thesis are brought together and discussed in relation to the original research questions.
In Chapter 9, the summary and conclusions from the research undertaken are presented. Recommendations on the use TM based tools and reporting of their corresponding experiments for automatic CS and suggestions for future work are provided.
Theoretical Preliminaries
A
brief overview of the basics of ML and TM being the core of the subject of the studies in this work is presented in this chapter. The chapter presents a quick introduction to the supervised, semi-supervised and unsupervised learning approaches. The different processes involved in the conduct of TM experiments are also explained. The chapter was rounded with a discussion on model assessment and methods to improve model performance. These concepts underlie the theory behind the work in this research.In Section 1.1.4, the intensive amount of time and effort consumed by SR was presented. The application of ML algorithms is being explored to support decision making either of the whole SR process or its individual stages. The CS stage has recorded the most success in terms of SR support research with the application of TM techniques. All the studies evaluated in this research have employed one ML algorithm or another. The subject of ML and TM are not native to SR research, there-fore, the decision to present a brief overview of the concepts involved to introduce some of the techniques that are relevant to this research.
Many research areas have continued to witness the application of ML techniques to aiding their processes and methods. The case is similar with the application of TM techniques to automatically screen citations during the conduct of SRs. For this purpose, the use of TM related techniques is one of the approaches being explored. TM involves the exploration of textual documents with the aid of analysis tools and technologies to extract useful information. TM supports the “analysis of text with machine using techniques from ML, Information Retrieval (IR), Information Extrac-tion (IE), connecting them with the algorithms and methods of Knowledge Discovery in Databases (KDD), Data Mining (DM), and statistics” (Hotho, Nürnberger, & PaaSS, 2005). TM is like DM but unlike DM, the artefact explored for interesting patterns is not formalized database records but semi-structured or unstructured textual data in documents. The main logic behind the technologies used in TM is that text is turned into some form of structured numerical representation so that ML algorithms can be
applied to large document databases.
Section 2.1 will present a high level overview of machine learning with pointers to where further information can be sourced. This will be followed by a similar in-troduction to TM in Section 2.2. An inin-troduction to some model assessment metrics particularly relevant to this project is presented in Section 2.3 followed by perform-ance improvement discussions in Section 2.4. The chapter concluded with a summary in Section 2.5.
2.1
Machine learning overview
Learning can be in or through many forms. It can be through the acquisition of new knowledge or cognitive skills, effective representation of new knowledge or new fact discovery through observation and experimentation (Carbonell, Michal-ski, & Mitchell, 1983; MichalMichal-ski, Carbonell, & Mitchell, 2013). An indication that learning has taken place is the ability to remember, adapt and generalise to similar situations at a future instance (Marsland, 2015). Given this premise, ML can thus be described as being concerned with learning from data by machines basing their fu-ture decisions on previous encounters of similar situations (Marsland, 2015; Murphy, 2012).
There are three major approaches to ML, supervised, unsupervised and reinforce-ment learnings. Neither this project nor any of the studies reviewed in this thesis touched on reinforcement learning, therefore, only the supervised and unsupervised approaches will be described further in the following sections.
Reinforcement learning has found more use in dynamically interactive environ-ments (Hafner & Riedmiller, 2011; Kaelbling, Littman, & Moore, 1996; Kober, Bag-nell, & Peters, 2013). It involves mapping of input to a set of output like the super-vised learning (as will be presented in Section 2.1.1) but unlike supersuper-vised learning it is not aided by a list of output to learn from since in its case there is often too many possibilities than could be exhausted and often not known ahead. Also, unlike the unsupervised learning (in Section 2.1.2) it does not learn the underlying distribution of the data. The task being addressed by studies contained in this work is a basic binary classification problem which, following from the explanation presented, may have been considered relatively trivial to apply a reinforcement learning algorithm. Also, in reinforcement learning, there is a delayed feedback indicating the goodness of a series of decisions, however this scenario does not fit the SR/ CS context where decisions on inclusion/exclusion criteria are independent and based in principle on a priori set criteria; reinforcement learning could therefore be considered applicable if the inclusion/exclusion criteria would not be pre-set and the aim would be to learn these as well. However, this is not appropriate in the context of SR. These reasons (and may be more) might account for why the reinforcement learning approach was
not found used in any of the work evaluated.
A possibly fourth type of learning approach is referred to as semi-supervised learn-ing. Semi-supervised learning is a combination of both the supervised and unsuper-vised learning. The model is trained with a limited number of input-output mappings and it use the knowledge to project the output class of the rest of the data (Zhu, 2006; Hady & Schwenker, 2013).
2.1.1
Supervised learning
Supervised learning is the process of creating a classifier that learns a set of rules from provided instances to generalize to new ones (S. B. Kotsiantis, Zaharakis, & Pintelas, 2007). In the process, a general inductive process, called the learner is fed with some training set of documents D that have been labelled according to their pre-defined classes C. The goal is to learn a mapping from input dto target outputc
given the input-output pairs (Equation 2.1) (Murphy, 2012).
Φ ={(di,cj)}Ni=j;DXC → {T, F} (2.1)
The learner will generate a model (classifier) based on its observed characterisation of the constituents of the different categories. Then, the classifier can be used to determine the class of previously unseen documents based on the provided categor-ies. In its simplest setting, each training inputdi is a n-dimensional vector of number representations of the features. Whencj is categorical, the learning problem is called
classificationand it is calledregression when the target output is real-valued.
The Support Vector Machine (SVM) is an example of a supervised ML technique and as will be shown in Section 3.4.2, it is the most used algorithm among the studies on automatic CS. A SVM is a supervised learning technique applicable to both classification and regression. It is based on the structural risk minimization theory introduced by Cortes and Vapnik (1995). In its simplest (linear) form, it is a binary classification model that seeks an optimal separation margin (optimal separating hyperplane) between the positive and negative examples (see Figure 2.1), where margin refers to the minimal distance from the separating hyperplane to the closest data points (Hearst, Dumais, Osuna, Platt, & Scholkopf, 1998; S. B. Kotsiantis et al., 2007; Murphy, 2012).
Given a training set of input-output pair (xi, yi), i = 1,· · · , l where xi ∈ Rn and
yi ∈ {1,−1}, the SVM requires the solution of the optimisation problem in Equa-tion 2.2 (Cortes & Vapnik, 1995).
min w,b,ξ 1 2w Tw +C l X i=1 ξi (2.2)
Figure 2.1: Illustration of SVM classification for linearly separable data
subject to (yiwTxi+b)≥1−ξi, ξi ≥0
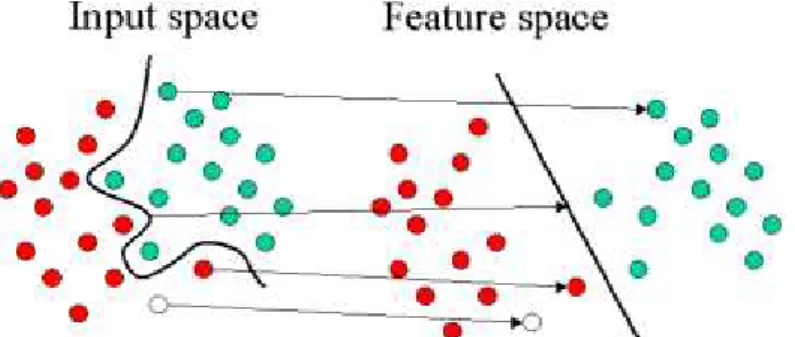
To classify non-linear data (Figure 2.2), the SVM transforms the input vector into a very high dimensional feature space using non-linear transformation func-tions (called the “kernel trick”), where the data points can be separated linearly (Figure 2.3). In the non-linear case, the solution in Equation 2.2 is solved subject to
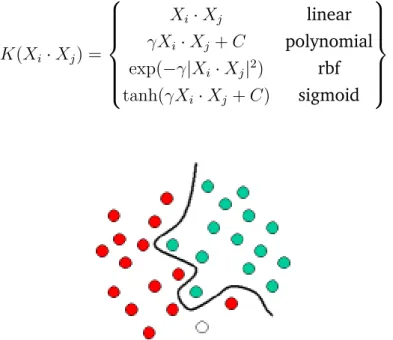
(yiwTφ(xi)+b)≥1−ξi, ξi ≥0. Examples of some popular kernels: linear, polynomial, radial basis function (rbf) and sigmoid are presented below:
K(Xi·Xj) = Xi·Xj linear γXi·Xj +C polynomial exp(−γ|Xi·Xj|2) rbf tanh(γXi·Xj+C) sigmoid
Figure 2.3: SVM projection of non-linear data with kernel trick
The SVM’s decision is based only on data points closest to the margin called Sup-port Vector (SV)s (A. Khan, Baharudin, Lee, & Khan, 2010; S. B. Kotsiantis et al., 2007). The SVM have some other parameters apart from the kernel whose values must be tuned to obtain optimal performance from the algorithm. Key of these para-meters are the ‘C’ and gamma parapara-meters.
‘C’ is a regularisation parameter which maintains the trade-off between achieving a low error on the training data and minimising the norm of the weights - better generalisation. As the value of ‘C’ increases the complexity of the model increases which may lead the model to over-fitting its data. Given the objective function in Equation 2.2, if ‘C’ is too large, the optimisation algorithm will try to reduce |w| as much as possible leading to a hyperplane which tries to classify each training data correctly (Alvarsson et al., 2014). This process will lead to the algorithm overfitting. On the other hand, if the value of ‘C’ is too small, the objective function will take the affinity to increase it a lot which will result in a large training error and by implication, underfitting (Cherkassky & Ma, 2004a; Alvarsson et al., 2014).
The gamma parameter defines the extent of the reach of influence of a single training data where ‘low’ values signifies ‘far’ and ‘high’ value signifies ‘close’. Gamma can be seen as the inverse of the radius of the data samples selected as SVs (Alvarsson et al., 2014). This means if the radius is too large, the region of influence of the SV only includes the SV itself and regularisation with ‘C’ cannot prevent overfitting that results. When the gamma is very small, the region of influence of any selected SV covers the whole training data (Cherkassky & Ma, 2004a).
Following from the above discussion, it is clear that setting ‘C’ and gamma to optimal values is key to the performance of the SVM algorithm. Some of the studies reported in other parts of this thesis (Sections 4.2.1.4,5.4.6 and 6.3.2) explore the use of SVM models in text classification.
2.1.2
Unsupervised learning
Clustering is a prime example of unsupervised learning. In unsupervised learning, the learner is provided with no predefined classes (C), only the input documents (D). The goal is for the learner to explore characteristics of the instances and discover “interesting patterns” that it will use to partition the instances into a finite number of clusters (K) ensuring that members of a cluster share more similarities than those of other clusters in the data (Fahad et al., 2014; Verma, Srivastava, Chack, Diswar, & Gupta, 2012). According to Murphy (2012), this usually involves two steps. The first step involves the estimation of the distribution over the number of clusters, p(K|D)
which is approximated as shown in Equation 2.3.
K∗ = argmax
K
p(K|D) (2.3)
The second step involves the estimation of the cluster each data pointibelongs to as shown in Equation 2.4.
zi∗ = argmax
k
p(zi =k|di,D) (2.4)
where, zi is a latent variable explored by the model andzi ∈ {1, . . . ,K} denotes the cluster assigned to data pointi. There are several types of clustering techniques and algorithms, the main ones and their examples are reviewed and explained in (Fahad et al., 2014; Murphy, 2012).
2.2
Text mining: an introduction
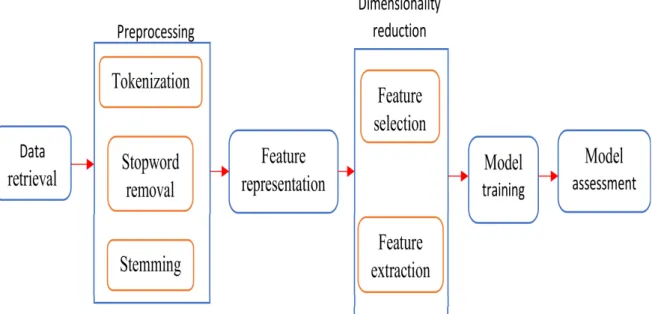
The goal of TM is to exploit vast amounts of information from multiple documents and sources by using automated means to categorise and characterise them into a fixed number of (pre-defined) categories, where each documentdcan be in none, one or more categories (Inzalkar & Sharma, 2015; Joachims, 1998; K. Sharma, Sharma, Joshi, Vyas, & Bapna, 2017). The discussion on TM in this thesis will focus more on text classification. The text classification process involves text retrieval, prepro-cessing, dimensionality reduction, model training (or development) and assessment. These steps are depicted in Figure 2.4 and discussed in more detail in the following sections.
2.2.1
Data retrieval
In this age of big data, the data required for a TM task are often located in some remote locations or may need to be retrieved from multiple sources e.g. websites. Therefore, it is important to capture the source(s), nature and portion of the data and the method used to retrieve them. The data may be stored in a database which will
Figure 2.4: Text mining process
then require a retrieval method as simple as a Structured Query Language (SQL) or located in multiple websites where the retrieval method will involve writing scripts to automatically scrape the websites and extract targeted information from them. The dataset may also be stored in an original format (e.g. json or eXtended Markup Lan-guage (XML)) that may require writing of scripts to reformat and/or extract portions of interest. In essence, the description of the data structure, storage and retrieval method is always a good practice and essential to the TM process.
2.2.2
Preprocessing
Texts cannot be handled by the ML algorithms, thus they need to be converted into a numerical format that can be processed and managed by algorithms. After retrieval, the different words in all the documents of interest are separated into individual words (tokenization) and collated in a single entity, a feature vector called Bag-of-Words (BOW) (Lebanon, Mao, & Dillon, 2007). The BOW approach did not take the semantic context of each word into consideration. Other Natural Language Pro-cessing (NLP) approaches utilising the semantic context of each word exist but will not be explored in this report. The preprocessing step involves tokenization, stop-words removal and stemming or any other chosen NLP activities. The advantage of undertaking preprocessing in text classification was reported in (Uysal & Gunal, 2014). These tasks are further discussed in the following sections.
2.2.2.1 Tokenization
Tokenization refers to the process of cleaning, extracting and separating individual (unique) words in all the documents and storing them (usually) as independent
terms (Miner, Elder IV, & Hill, 2012). 2.2.2.2 Stopwords removal
Another task sometimes undertaken in pre-processing is the removal of commonly appearing ‘non-informative, non-content’ words in categories of prepositions, aux-iliary verbs, articles, conjunctions, special characters and numbers. An example of these stopwords is given in (Fox, 1989). These words are considered to convey no particular meaning or are not useful to discriminate between documents. The effect of removing them has been evaluated (Srividhya & Anitha, 2010). This has become a common practice in TM studies.
2.2.2.3 Stemming
Stemming is a language normalization step in text preprocessing (Miner et al., 2012). A stemming algorithm removes inflection (suffix, prefix, or any other transformation) from the different words and reduces each to its original root. This is to create uniformity among similar words and reduce unnecessary duplicity. For example, words like “going and gone” will both be reduced to “go”. It should be noted, that despite being useful, this method has a downside of merging two or more words with the same sound (homonyms) and spelling (homographs) but different meanings and root as being the same e.g. book (noun), book (verb) and booking (present participle of verb book), bookings (noun) four words of three categorical meaning will all be reduced to “book”. The most widely used stemming algorithm is the “porter stemming algorithm” (Porter, 1980).
2.2.3
Feature representation
After the text has been preprocessed, it is then encoded or weighted in numerical form and stored in a data structure (feature vector) ready for the learning algorithm. This step is called feature representation. The feature vector relies on the Vector Space Model (VSM), an algebraic model for representing text documents. In VSM, each document is mapped against the words that it contains using frequency based schemes like term frequency (tf) or term frequency-inverse document frequency (tf-idf). Given a documentD, it can be represented with a vector as expressed in Equa-tion 2.5,
D = (di1,d12,· · ·,din); dij =⇒ weight of the jth term (2.5)
These representations are combined in a high dimensional term-document matrix know as the Bag-of-Words (BOW). The BOW is the most commonly used vector to represent a corpus prior to classification or clustering. The BOW is an orderless rep-resentation of a document as the multi-set of its constituent words without regard for
grammar but reflecting the importance of the word to the document (Korde & Ma-hender, 2012). Some of the most commonly used feature representation techniques (binary, term frequency (tf) and the term frequency-inverse document frequency (tf-idf)) are briefly introduced below. For more details on feature representation or term weighting and the different approaches and types, see (Ikonomakis, Kotsiantis, & Tampakas, 2005; Sebastiani, 2002; Leopold & Kindermann, 2002).
2.2.3.1 Binary feature
The presence of a featuref in a document is denoted by a ‘1’ and its absence signified by a ‘0’ in the term-document matrix irrespective of the number of times it occurred. Given a document d, the binary representation of a featuref can be expressed as in Equation 2.6 below: h(f) = 1, iff ∈d 0 otherwise (2.6) 2.2.3.2 Term frequency
This is the representation of a term in a document by the number of occurrences of such terms in the document. This can be expressed as shown in Equation 2.7:
tf(fi, dj) =
f reqij
maxkf reqkj
(2.7)
2.2.3.3 Term frequency-inverse document frequency
The frequency representation is sometimes normalized and one of the often used count normalization techniques to represent features is the tf-idf. tf-idf is expressed as the relative frequency of a term or feature f in a specific documentd normalised by the inverse proportion of the feature over the entire documentD product of the tf and the feature’s inverse document frequency. The inverse document frequency (idf) is obtained by taking the logarithm of the corpus size divided by the number of documents containing the word. Given a document collectionD, a featuref, and an individual documentd ∈D, the tf-idf off relative todcan be calculated as shown in Equation 2.8 (Robertson, 2004; Salton & Buckley, 1988):
fd=f reqf,d∗log(
|D|
f reqf,d
) (2.8)
2.2.3.4 Word2vec
The word2vec is a predictive model for learning word embedding from raw text pro-posed by Mikolov, Sutskever, Chen, Corrado, and Dean (2013). The model works