PCIS Revisited: A Visual Database for Design and
Construction
Dennis Fukai, Architect, PhD
University of Florida, USA
Ravi Srinivasan
University of Florida, USA
Abstract
This paper presents research on a piece-based construction information sys-tem called PCIS(pronounced “pieces”) first published as a visual information concept at ACADIA’96, Tucson. After more than five years of development it has evolved into a multidimensional visual information system for design and construction. It includes a piece-based anatomical construction model layered according to a work breakdown structure; a dataTheater that surrounds the model as an index to plans, elevations, sections, and details; and a dataWorld with cameras fixed to the intersections of its latitudes and longitudes to add context and perspective. A standard services matrix (SSM) controls layer vis-ibility and camera settings. PCIS can be “played” to access archived resources; support design development, analyze and resolve preconstruction conflicts, and coordinate construction activities. Current research will be used to demon-strate how PCIS might be valuable to increase the potential for technical coop-eration, collaboration, and communication by literally aligning the points of view of architectural, engineering, and construction methodology.
Keywords
Ravi Srinivasan Construction 1 Overview of the PCIS System
PCIS is a piece-based construction information system. It has three components. As shown in figure 1, the first is an anatomical construction model organized according to ASTM UNIFORMAT II (Charette 99). A construction model differs from an architectural or space visu-alization model because: 1) each piece of the con-struction is represented as a separate object, and 2) pieces are located within the informational con-text of the total assembly. The pieces are grouped into layers that correspond to the work break-down structure (WBS) used in UNIFORMAT II. The layered organization means the model can be controlled to illustrate both construction and deconstruction of an object according to the re-quirements of a particular pictorial display. In these displays, the pieces of the model act as an interface to information relationships associated with the design and construction of the structure the model represents.
A dataTheater surrounds the anatomical model (Figure 2). It sets up a combination of two and
three-dimensional planes to display plans, eleva-tions, and sections that can be hypergraphically accessed to view dimensions, construction details, and specifications. To view this information, the user clicks on the sides or sectional slices of the dataTheater. For example, the outside faces of the theater link to corresponding two-dimen-sional elevations. Clicking on the top of the cube leads to a roof plan that becomes a framing, foun-dation, or floor plan as the WBS layers of the anatomical model are adjusted and annotated. The dataWorld shown in Figure 3 has a constel-lation of cameras fixed to the intersections of its latitudes and longitudes. The cameras form an
Figure 1. A piece-based anatomical construction model is not ar-chitectural
Figure 2. The dataTheater links two and three-dimensional con-struction information to the model
Figure 3. The dataWorld sets up the cameras that contextualize the construction information
array of pre-established viewpoints above and below the anatomical model. The actual number of viewpoints and the setting for each camera are determined by the requirements of the modeled structure. The display from these viewpoints contextualizes the construction information shown in the dataTheater. The juxtaposition of context and information is similar to other imag-ing technologies where visual output is more use-ful when the base illustration is supplemented by related graphical data (Yamaguchi 98, Cohen 95). The information visible to these cameras is ad-justed using a standard survey matrix (SSM). The SSM sets the variables associated with any par-ticular point of view. These variables include a WBS layer, zoom distance, aperture size, camera angle, and the visibility for each display. The set-tings on the SSM control a software engine that polls the cameras and publishes the images to a set of directories as files that can be accessed by the hypergraphic interface. The algorithm for this engine guides current research and will be automated as its operations are finalized over the next few years.
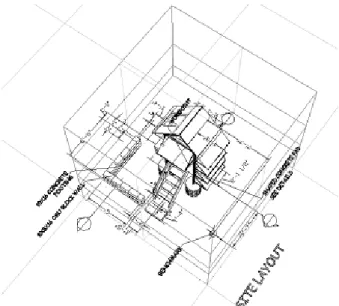
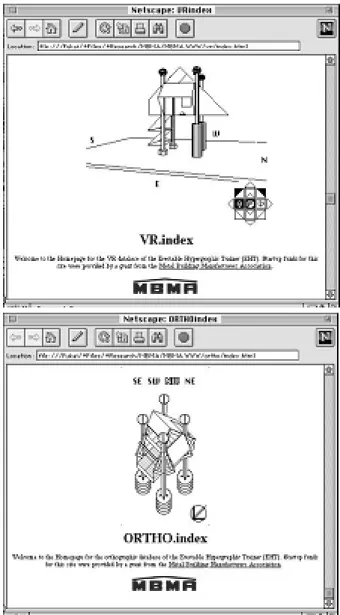
2 PCIS: A Hierarchy of Pictorial Information As shown in Figure 4, the concept of a dataWorld that organizes construction information through user interaction was first presented as a visual in-formation concept at ACADIA ’96, Tuscon (Fukai 96.1, Fukai 96.2). After more than five years of development and field tests, the original dataWorld has evolved into a multidimensional piece-based construction information system. PCIS is a visual database because, wherever pos-sible, the information it contains is represented by a hypergraphic link to underlying design and construction information.
The structure of PCIS begins by archiving pro-grammatic information discovered early in the predesign phase. This information includes pro-grammatic design requirements, social and his-torical factors, biotic and abiotic geographic data, technical specifications, procurement resources, and cost and finance information. The informa-tion is gathered and stored according to its geospecific relationship and visually indexed by the dataWorld.
The dataWorld acts as a visual interface that pic-torially frames references to the information sys-tem (Ellis 00). The graphical syssys-tem is pictorial because the design and construction information is visually indexed by the pieces of the anatomical model. Image maps overlaid on the display are linked to underlying references like dimensions, specifications, procurement sources, engineering, assembly instructions, and operation and main-tenance procedures.
The organization of the database is therefore di-rectly related to the graphical representation of the pieces of the model. The challenge is to con-trol the visibility of these pieces in a way that
re-Figure 4. Early VR and orthographic interfaces to the construc-tion informaconstruc-tion system
tains their contextual information relationships (Fukai 00, Wei 98). Any reasonably knowledge-able CAD operator can, of course, use a model for construction information by visually turning on or off the pieces of a model, but the time and tedious nature of using the model in this way would not be effective on a jobsite as a construc-tion document (Wilson 00).
The challenge is to automate these actions in an anticipatory manner in order to convey construc-tion informaconstruc-tion (Fukai 00). As shown in Figure 5, PCIS does this by organizing a constellation of cameras as a three-dimensional matrix of fixed and therefore standardized three-dimensional images. The number of cameras mounted to the dataWorld varies according to the type of objects it contains. In most cases only a few cameras are necessary to index the underlying data, however, additional cameras can be added as new informa-tion is entered into the data structure.
3 Early work and lessons learned
PCIS was initially tested using an experimental structure called the Trainer. The Trainer has the advantage of providing a deconstructible design that combines a number of different types of con-struction. Early studies used object oriented VR and VRML modeling software with proprietary interfaces to navigate around a three-dimensional model of the Trainer. Using this standard
soft-ware, the pieces of the model were linked to im-ages that provided additional information about the construction. As users navigated through the environment, they clicked on the model to access the underlying construction information. The results were mixed. Though the VRML environment was visually impressive, users were often confused by an infinite number of views of the model. It therefore took an inordinate amount of time to navigate the virtual space and under-stand the details of the construction. Qualitative surveys showed that 90% of visualization and understanding was achieved in the first few min-utes of navigation. After that, the user had to search for the information necessary to actually build the Trainer. This proved to be difficult be-cause of the technical skill required to move around in virtual space. The lack of visual refer-ences showed the importance of pictorially fram-ing information so that it became a purposeful display (Ellis 93, see also Ellis 95.1).
Another lesson learned was that the availability of software tools that could enhance the physical form with texture and color often produced im-ages that were difficult to understand. Initial at-tempts to “illustrate” the construction distracted the user and slowed down information transfer. Though some of the rendered images were inter-esting to view, they were not useful. For example, in Figure 6, a rendered detail might be largely satisfying to the model builder, but in practice it was confusing and difficult to visualize.
Construction
Figure 5. The cameras visually organize the construction infor-mation
Figure 6. Texture and color can create visual noise that makes the information difficult to understand
As a result, it became clear that the display of in-formation had to be controlled and processed to specifically emphasize the information necessary for a particular task (Tuft 97). In other words, unlike an architectural rendering or a technical illustration, construction images extracted from an anatomical model had to be anticipatory and documentary (LaCourse 90).
This means the graphical display of construction information has to be clearly task specific. Color or texture might be useful, but it has to contrib-ute to the explanation of the work as part of a construction process. As shown in Figure 7, the resulting image should quickly and efficiently transfer the informational intent of that particu-lar image. Following the mainstream of infor-mation theory, the visual explanation must there-fore be clearly and simply presented, with mini-mal color, annotations, and clutter (Tuft 90). Another important lesson was understanding the importance of the context of the information (Tuft 97). As shown in Figure 8, the context of infor-mation contains as much, if not more, informa-tion than the details of the construcinforma-tion. There are two important factors associated with this idea. First, the three-dimensional image that relates to this context must be synchronized with the con-struction activity. It has to appear to emerge from the actions of the user. This means that it has to “be there” just as a worker in the field needs the information.
Secondly, the sequence derived from this imme-diacy has to locate the information in a way that emphasizes the interrelationships of time, cost, and resource expenditures.
Interestingly, sequential contextualization is something that a computer can deliver very well. By its very nature, informational links to an im-age in a computer create an interactive environ-ment that allows the user to query the data ac-cording to his or her specific information needs. In addition, the distinct advantage of a comput-erized graphical environment is that it can ani-mate and anticipate the construction sequences missing in otherwise static views of construction information. Anticipating the sequence of con-struction means the computer can enhance effi-ciency by visually managing the construction pro-cesses.
4 Context, Anticipation, and Sequence
For an anatomical model to be useful, the infor-mation it contains has to anticipate the most likely sequence of construction. This means the infor-mation has to be timely. For example, a tradi-tional two-dimensional drawing like that shown in Figure 9, delivers information to the jobsite as an abstraction of the planned construction. As shown in Figure 10, a three-dimensional model can help to visualize that information and has been shown to be more efficient in the field (McKinney
Figure 7. Color and perspective could be used to enhance the spe-cific information transfer
Figure 8. The context of the information must orient workers to the sequence of each installation
96). Important is that both illustrations contain layers of construction information. Some of this information is necessary to the workers immedi-ately, other information is needed later, and as the work progresses most of the information has to be ignored because it is no longer useful. When the layers of information are controlled, sequen-tial images can be used to anticipate the produc-tion process. This means they provide only the information necessary for a particular task. PCIS anticipates the informational needs of the work-ers and responds to those needs as they are pre-sented.
Anticipation like this is a kind of built-in intelli-gence that has been recognized by other
research-Construction
Figure 10. Three dimensional models are informationally effi-cient, but time is again embedded in the image
ers as “task pointers” or “glances” (Wernhart 99, Pierce 99). The general idea is to post the next probable view or action in the construction pro-cess. This kind of anticipation brings the infor-mation environment to life because it clarifies the process by locating the next step within a con-tinuum of related activities. As such, it extracts time from the three-dimensional model and makes it integral to the PCIS information system. For example, in its simplest form, a key frame anima-tion can be published as a series of slides or im-ages. However, when links are added to the indi-vidual frames, the interaction categorizes the con-textual relationships, extracting the information from layers of otherwise ambiguous and often forgotten information. In this way, the model becomes the “glue” that pictorially holds the de-sign and construction process together (Aalami 98, Ellis 95.2).
5 Conclusion and Further Study
Current research differs from early object mod-els or immersive virtual information environments because the details of the anatomical model are pictorially linked to both context and construc-tion. The construction information is available through the planes of the dataTheater. This in-cludes two-dimensional layouts and dimensional relationships with further links to specifications and resources in the database. Early tests of vir-tual information environments made it clear that two-dimensional images are important to under-standing the details of the construction process. At the same time, the cameras of the dataWorld provide the contextual information necessary to support the construction information framed by the dataTheater. The dataWorld provides framed visual references to the data structure that im-proves understanding of the actual construction. The value of PCIS may ultimately be as a picto-rial database that centers and controls the per-ceptive relationships of the design and construc-tion process. Current research like that shown in Figure 11, indicates that PCIS may increase the potential for technical cooperation, collaboration, and communication by literally aligning the points of view of architectural, engineering, and con-struction methodology. Standardizing the views of a project is critical to effective communications. Ravi Srinivasan
Figure 9. Two-dimensional drawings have time embedded in lay-ers of construction information
For example, a simple plan and a few elevations, first sketched on a napkin in a casual conversa-tion, begin to immediately align the interaction and conversation of the project team with a com-mon point of view. The design depends on fu-ture development of these early graphical repre-sentations. In fact, the schematics almost always include plans and elevations, even when render-ings or three-dimensional models and animations are used. In preliminaries, scaled plans and el-evations are necessary to understand horizontal relationships, begin preliminary specifications, and analyze cost and feasibility. Throughout de-sign development and construction, these same drawings continue to act as the interface to con-struction communications. As such, they are a series of standardized pictorial displays.
When framed by the PCIS information system, cameras control the visual display of the pictorial information in much the same way as a set of tra-ditional two-dimensional construction drawings. Furthermore, the composition of these images is thought to transfer construction information more efficiently than a set of two dimensional construction drawings. The results suggest a new kind of interactive document composed of col-lections of multidimensional images that can be displayed or published on a network. Both the hypergraphic interface and a text-based search
engine access the graphical information visually indexed by the PCIS environment. This means PCIS allows a wide range of players to exchange information from a common point of view. In other words, the project team shares the same perceptive reference. In the end, the real value of this research may therefore be that it increases the potential for communication, collaboration and long-term informational relationships. Only further investigation and time will tell.
References
Aalami, Florian and Fischer, Martin, (1998). Construction Method Models: The glue between design and construction. Proceedings of the 1998 International Computing Con-gress on Computing in Civil Engineering, Boston. ASCE. p376 - 378.
Charette, Robert P. and Marshall, Harold E. (1999).
UNIFORMAT II Elemental Classification for Building Speci-fications, Cost Estimating, and Cost Analysis. NIST U.S. Department of Commerce, NIUSTIR 6389, October 1999.
Cohen, M. & Wenzel, E. M. (1995) The Design of Multidi-mensional Sound Interfaces, In W. Barfield & T. Furness III (Eds.), Virtual Environments and Advanced Interface Design, Oxford University Press, 291-346.
Ellis, Stephen E. (2000) On the design of perspective displays, Proceedings, IEA 2000/HFES2000 44th Ann. Meeting of the Human Factors & Ergonomics Society.
Ellis, S. R. (1995.1) Virtual environments & environmental instruments. In Simulated & virtual realities, K. Carr & R. EngLand, eds. Taylor & Francis, London. pp. 11-51. Ellis, S. R. (1995.2) The design of pictorial instruments. In
Human Computer Interaction & Virtual Environments, NASA CP 3320, NASA Langley Research Center, pp. 13-24.
Ellis, S. R.. (1993) Pictorial Communication: Pictures and the Synthetic Universe, Pictorial Communication in Virtual and Real Environments, 2nd ed., Taylor & Francis.
Fukai, Dennis, (1996): A WORLD of Data: An animated hypergraphic construction information system. Presentation to the Association for Computer Aided Design in Archi-tecture, Tucson, AZ, October 1996
Fukai, Dennis, (1996.1) PCIS: A Piece-based information sys-tem. Automation in Construction, v,7.
Fukai, Dennis. (2000) Beyond Sphereland: 4D CAD in Con-struction Commmunications. In the Proceedings of the Conference of American Society of Civil Engineers, June 2000, Orlando Florida.
LaCourse, Dan. (1990): How solid modeling previews the future. Design News. V46, N10, May 10, 1990, p90-92. McKinney, Kathleen, and Kim, Jennifer and Fischer, Mar-tin, and Howard, Craig. (1996): Interactive 4D-CAD. Computing in Civil Engineering. p383-389.
Figure 11. Current research indicates that standard images may align the perceptions of design and construction teams
Pierce, Jeffrey S., Conway, Matthew, van Dantzich, Marteen, Robertson, George. (1999). Toolspaces and Glances: Storing, Accessing, and Retrieving Objects in 3D Desktop Applications. In the Proceedings of the Sympo-sium on Interactive 3D Graphics 1999. p 163-168. Tuft, Edward R. (1990) Envisioning Information. Graphics
Press, 1990.
Tuft, Edward R. (1997) Visual Explanations. Graphics Press 1997.
Wakita, Osamu A. and Linde, Richard M. (1985) The Pro-fessional Handbook of Architectural Working Drawings. John Wiley and Sons 1985.
Wei, Dong and Kathleen Gibson. (1998): Computer visu-alization: an integrated approach for interior design and ar-chitecture. McGraw-Hill.
Wernert, Eric A. and Hanson, Andrew J. (1999) A Frame-work for Assisted Exploration with Collaboration. In the Pro-ceedings of the IEEE Visualization Conference 1999. p 241-248.
Wilson, John. (2000): AutoCAD2000: A Visual Approach. Autodesk Press, 2000.
Yamaguchi, Takami and Liu, Hao, (1998): Computational visualization of external and internal biological flows with fluid-wall interactions. Advances in Bioengineering, American Society of Mecahanical Engineers. Bioengi-neering Division, V39 1998. p127-128.
Construction Ravi Srinivasan