Alberta Energy and Utilities Board
Decision
2004-067
EPCOR Distribution Inc.
2004 Distribution Tariff Application
Part B: 2004 Final Distribution Tariff
ALBERTA ENERGY AND UTILITIES BOARD Decision 2004-067: EPCOR Distribution Inc. 2004 Distribution Tariff Application
Part B: 2004 Final Distribution Tariff Application No. 1306821
Published by
Alberta Energy and Utilities Board 640 – 5 Avenue SW
Calgary, Alberta
T2P 3G4
Telephone: (403) 297-8311 Fax: (403) 297-7040
Contents
1 INTRODUCTION... 1
2 LOAD FORECAST ... 1
3 OPERATING EXPENSES... 6
3.1 Inflation Related Increases to Operating Expenses... 8
3.2 Non-Inflation Related Increases in Operating Costs... 14
3.2.1 Overall Operating Costs... 14
3.2.2 Distribution Operations... 16
3.2.3 Customer Services ... 20
3.2.4 Site, Metering, Settlement and Tariff Services... 21
3.2.5 Support Services ... 22
3.2.6 Bad Debt ... 23
3.3 Employee Numbers and Compensation... 26
3.3.1 FTEs... 26
3.3.2 At Risk Compensation ... 35
3.3.3 Pension Funding ... 39
3.3.4 Vacant Position Allowance... 39
3.4 Executive Compensation... 44
3.5 Hearing Costs... 46
3.6 Donations and Community Support... 47
3.7 Corporate Affiliate Transactions... 51
3.8 Other Affiliate Transactions... 66
3.9 Affiliate Code of Conduct... 68
3.10 Benchmarking and Uniform System of Accounts ... 68
4 REVENUE OFFSETS ... 72
4.1 Water Meter Reading Services provided to EWSI ... 72
4.2 Service Connections, Jobbing, Material Sales ... 76
5 DEFERRAL ACCOUNTS ... 77
5.1 Transmission Access Charge Deferral Account ... 77
5.2 AESO Charge Deferral Account... 84
5.3 Hearing Cost Reserve Account ... 86
5.4 Self-Insurance Reserve Account... 86
6 RATE BASE ... 90
6.1 2004 Opening Balances ... 90
6.2 Capitalization Policy ... 96
6.3 Capital Additions ... 101
6.3.1 General... 101
6.3.2 Regulated Default Supply Compliance Project ... 105
6.3.3 Meter Data Management Remote Project... 112
6.3.4 Vehicles... 113
6.3.5 Other Data Processing Equipment ... 115
6.4 Customer Contributions ... 116
6.5 Working Capital... 117 EUB Decision 2004-067 (August 13, 2004) • i
7 DEPRECIATION ... 119
7.1 General ... 119
7.2 Complexity of Method ... 120
7.3 Regulatory Treatment of Net Salvage... 127
7.4 2004 Deprecation Expense... 129
7.5 Other... 136
8 RETURN ON RATE BASE ... 139
8.1 General ... 139
8.2 Cost of Equity and Equity Ratio ... 139
8.3 Cost of Debt and Debt Ratio ... 140
9 DISTRIBUTION ACCESS SERVICE TARIFF... 145
9.1 DAS Cost of Service ... 145
9.1.1 General... 145
9.1.2 Use of On-Peak Energy to Allocate Primary Distribution Costs... 150
9.2 DAS Rate Design ... 158
9.2.1 General... 158
9.2.2 Revenue to Cost Ratios... 163
9.2.3 Complexity of Method... 164
9.2.4 Customer-Specific Rates... 175
9.2.5 Lifeline Rates ... 181
9.3 Fee Schedule ... 184
9.4 Terms and Conditions ... 187
10 SYSTEM ACCESS SERVICE TARIFF... 192
10.1 SAS Cost of Service... 192
10.2 SAS Rate Design... 194
10.2.1 Complexity of Method... 194
11 FRANCHISE FEE ... 197
11.1 Board Jurisdiction ... 197
11.2 Bill Presentation... 208
11.3 Level of Method of Collection of the Fee... 210
12 REFILING PROCESS ... 211
13 SUMMARY OF BOARD DIRECTIONS RESPECTING THE REFILING... 211
14 SUMMARY OF BOARD DIRECTIONS REPECTING THE NEXT GTA... 216
APPENDIX 1 – HEARING PARTICIPANTS... 221
APPENDIX 2 – EXAMPLE OF A BASIC FORM OF SIMPLIFIED DEPRECIATION METHOD ... 223
List of Tables
Table 1. EDI 2004 Commercial Sales Forecast ... 5
Table 2. EDI 2004 Forecast Cost Escalation % from Table 3 of EDI’s GTA... 9
Table 3. EDI and CG Recommended Forecast Inflation % for 2004... 12
Table 4. EDI Per Customer O&M Expenses... 15
Table 5. EDI Support Services Costs ... 22
Table 6. EDI Accounts with Major Support Services Cost Increases ... 22
Table 7. EDI Bad Debts Related to Revenue Offsets... 24
Table 8. EUI Allocation to EDI ... 65
Table 9. EDI Allocation of IT Expense ... 65
Table 10. CG Recommended IT O&M Allocation ... 66
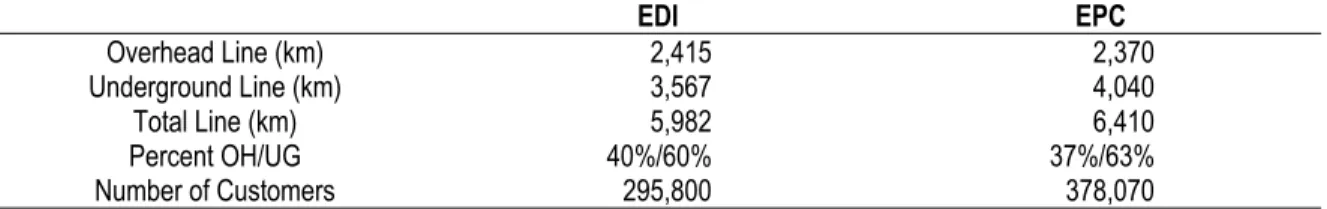
Table 11. Benchmarking of EDI and EPC ... 70
Table 12. Revenues Received from Edmonton Water Services Inc. ... 74
Table 13. EDI Comparison of Capital Asset Review and Asset Tracking System ... 91
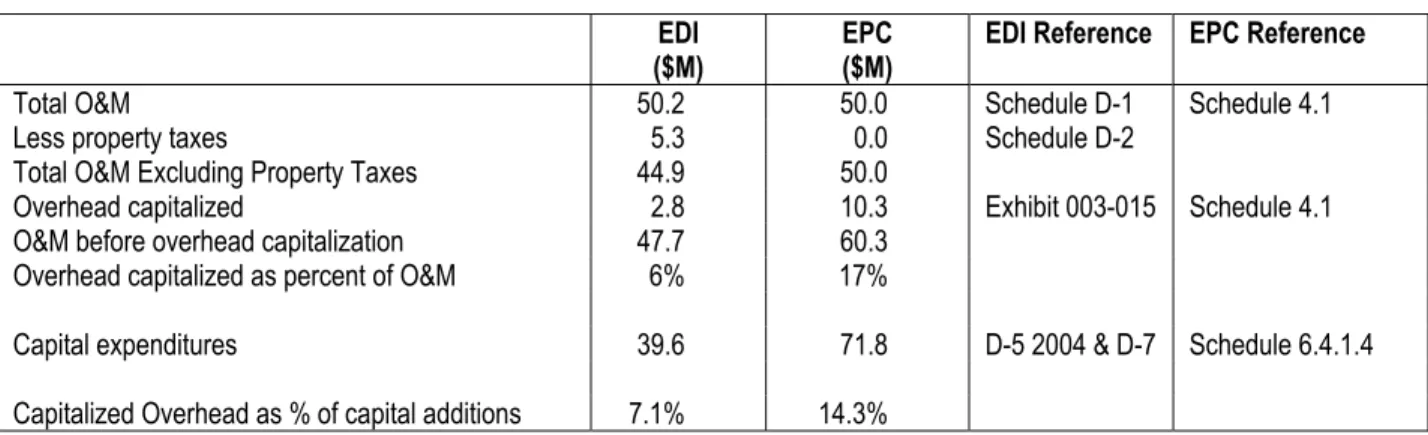
Table 14. Comparison of EDI and ECP Overhead Capitalized ... 100
Table 15. EDI Investment in Information Software Account 23127... 135
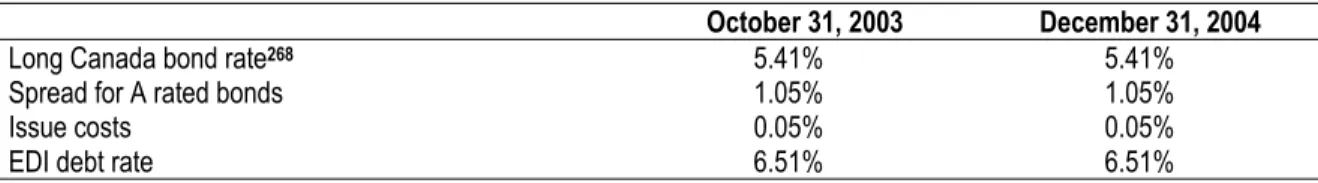
Table 16. CG Recommended EDI Debt Rates ... 143
Table 17. Minimum System Calculation ... 156
Table 18. EDI Stratified Customer Consumption ... 160
Table 19. Extraneous Price Signals in Proposed EDI per UA... 172
Table 20. General Structural Concerns with Proposed EDI Tariff per UA ... 172
Table 21. Concerns with Proposed EDI DAS Tariff per UA... 173
Table 22. Concerns with Proposed EDI SAS Tariff per UA... 194
ALBERTA ENERGY AND UTILITIES BOARD Calgary Alberta
EPCOR DISTRIBUTION INC. Decision 2004-067
2004 DISTRIBUTION TARIFF APPLICATION Application No. 1306821
PART B: 2004 FINAL DISTRIBUTION TARIFF File No. 1706-3
1 INTRODUCTION
With the passage of the new Electric Utilities Act, SA 2003, c.E-5.1 (EUA), which came into force on June 1, 2003, the municipal electric distribution systems of the Cities of Edmonton and Calgary became subject to the jurisdiction of the Alberta Energy and Utilities Board (Board). In particular, the Board became the regulatory authority for EPCOR Distribution Inc. (EDI) and ENMAX Power Corporation (EPC) for the purposes of approving distribution tariffs (DT) to be effective January 1, 2004.1The Distribution Tariff Regulation, AR 163/2003 (DT Regulation),
required EDI and EPC to apply to the Board for approval of their DTs on or before October 1, 2003.2 The DT Regulation required the Board either to approve a final DT for EDI and EPC to
take effect on January 1, 2004, or to approve an interim DT no later than November 30, 2003 to take effect on January 1, 2004.
As required by the DT Regulation, EDI filed an application on October 1, 2003, seeking interim and final approval of its 2004 DT (2004 DT Application).
The Board issued interim Decision 2003-085 on November 14, 2003 approving an interim DT to take affect January 1, 2004.
In order to approve a final 2004 DT, the Board conducted an oral hearing in Edmonton over the period March 1, 2004 to March 10, 2004, with written argument received April 26, 2004 and written reply received on May 17, 2004. The Board considers the record of these proceedings to have closed on May 17, 2004. Parties participating in the proceedings are shown in Appendix 1 to this Decision.
2 LOAD FORECAST
EDI’s 2004 load forecast was based on Dr. Stokes’ Billing Determinant Outlook report included as Appendix D to EDI’s Application (Exhibit 003-11). Additional information was provided in a number of responses to information requests,3 by EDI’s load forecast and inflation factors panel
(Tr. pp. 1764-1828), and in responses to undertakings provided by the witnesses (Exhibits 003-50, 51, 52).
1 EUA, section 102
2 DT Regulation, section 4(1).
Views of the Applicant
EDI submitted that PICA suggested that the growth rate Dr. Stokes used for average
consumption per household for 2003 was understated as it was lower than the five-year trend.4
In response, Dr. Stokes confirmed that his Billing Determinant Outlook was prepared based on the latest data available at the time his study was done, which included seven months of actual consumption data for 2003. Dr. Stokes also explained that he had used a longer rather than shorter span of historical data based on his concerns over the accuracy of more recent
consumption data due to the effects of deregulation on the data collection process (Tr. pp. 1780-85). Dr. Stokes also emphasized that in assessing the reasonableness of consumption data, the effects of “cycles” must be considered (Tr. pp. 1778-79).
EDI also noted that questions were asked respecting Dr. Stokes’ report in relation to energy consumption by industrial and commercial customers (commencing at Tr. p. 1796). EDI submitted that witnesses confirmed that Dr. Stokes’ assumptions were, if anything, conservatively biased in favour of customers.
Mr. Cowburn also confirmed that because customers above 5 MW have a
consumption-independent rate, the assumed energy growth for commercial and industrial customers in EDI’s load forecast will not affect their tariff charges, nor EDI’s revenue (Tr. pp. 1799-1800).
EDI submitted that the record demonstrates that EDI’s load forecast is based on an economic outlook and other inputs and assumptions for the EDI service area that are reasonable and appropriate, and that ensure that the forecast provides a fair and reasonable estimate of EDI’s 2004 load for ratemaking purposes.
EDI noted that the CG took issue with two narrow aspects of EDI’s load forecast, asserting that EDI’s growth rates for residential and commercial customers appear to be understated (CG Argument, pp. 1-4).
EDI provided the following additional comments in reply to the CG’s assertions.
The evidence demonstrates that there is no reasonable basis for the CG’s recommendations. For example, the CG’s recommendation that an average of the 5 and 10-year growth rates shown in PICA-EDI-69 be applied to EDI (CG Argument, p. 1, ll. 25-28) is entirely unsupported by, and is in fact completely inconsistent with, the record. Among other things, the EUB data in PICA-EDI-69 is for the whole Province of Alberta and not just for the City of Edmonton. As such, appropriate adjustments must be made to this data to reflect the growth applicable to the City of Edmonton alone, as Dr. Stokes did in providing his evidence. The CG’s recommendation also fails to take into account the hazards pointed out by Dr. Stokes with respect to the data (Tr. pp. 1780-81):
A. DR. STOKES: Well, I’m not -- it’s not safe, for example, using these numbers on a year-to-year basis, because of their construction.
One thing the deregulation has done for us is it’s destabilized the data collection process. In fact, some of the data that’s published by the Board, we had to splice it and fix it up
because it didn’t match once deregulation went into effect. If you check the AEUB data, you’ll notice. So we were awfully nervous about putting a lot of weight on it. So that’s why I used a longer –
In recent times it’s very dangerous to use this data because of all the changes. The EUB has stopped publishing data the way they used to publish it. There have been switches in the way the data has been reported.
If you look at the commercial, industrial numbers, there’s huge breaks in that data. So you get very nervous about using data that you don’t have a lot of confidence in.
EDI noted that the CG used a trend-based approach to test why consumption data in 2003 and 2004 should be different than the trend from 1998 to 2002. EDI submitted that the evidence demonstrates that this approach is clearly inappropriate. As EDI’s expert witness Dr. Stokes pointed out, the effect of “cycles” must be considered (Tr. pp. 1778-79). Yet in its Final
Argument, CG mischaracterizes the record in stating that it was EDI that “stated it had regard to the trend more than the economic cycle” (CG Argument, p. 2, l. 18). This is clearly inconsistent with EDI’s evidence, as summarized in EDI’s Final Argument.
EDI submitted that the CG’s recommendation was based on faulty conclusions and invalid assumptions and is unsupported by evidence. The Board should disregard the CG’s submissions and approve EDI’s load forecast as filed.
Views of the Interveners CG
Residential
The CG noted that EDI has used a growth rate of 0.1% for the Residential class, notwithstanding the fact that the average growth rate for the last 13 years is about 0.1788%.5
The CG noted that the more recent 5-year average, growth rate averaged 0.61% and that even taking a longer 10-year average term, a growth rate of 0.35% was indicated. The CG submitted that EDI’s rationale for the lower growth rate was as follows:
In the forecasts presented below a rate of 0.1 per cent was used for residential energy and -0.25 per cent for commercial and industrial energy. A smaller positive number for residential than the average of the past 12 years is employed as increases in prices and energy conservation are likely to begin to offset the positive effects of income growth in the future.6
The CG submitted that EDI’s 0.1% growth in Residential energy, for 2004, appeared
understated. Not only is it contrary to EDI’s own evidence provided in PICA-EDI-69, but it is also based on an assumption that the growth rate in 2003 is about 0.1% for the months of Aug to Dec 2002. When the actual growth rates for the first 7 months of 2002 were much higher.7
5 PICA-EDI-69, Attachment 6 App D, p. 4
7 Exhibit 50, Appendix p. 6 of 9
The CG submitted that EDI’s forecast of 0.1% was based in large part on a subjective assessment respecting the impact of prices and energy conservation mitigating the positive impacts of
income growth in the future. EDI stated8 it had regard to the trend more than the economic cycle
(which was not defined), where people simply consume more energy when they are doing financially well.
The CG submitted that, even using the trend as suggested, EDI’s own evidence9 suggested that
the growth rate for the period 1990-2002 (13 years) averaged 0.1788%. EDI made a number of unsupported claims to support using its lower residential growth rate to 0.1%. For example, there was no evidence on the record to support the claim that “the federal government, through its Kyoto arrangement, is promoting energy efficiency”.10 Even if EDI’s concern was merited, the
CG questioned why the initiative would only have the stated impact in 2004, and not in any of the earlier years.
Based on the foregoing, the CG submitted that an average of the 5 and 10-year growth percentages should be used for determining the 2004 forecast percent growth rate. Based on PICA-EDI-69, the 5 year rate is 0.614% and the 10-year rate is 0.34%, so that the average rate is 0.47%.
In reply CG submitted EDI only examined changes in trend, which suggested that conservation and impacts of higher prices in 2004 offset the impact of income and growth. The CG submitted that EDI’s evidence on the impact of Kyoto and higher energy prices was nebulous at best. The CG submitted that, an examination of the growth in the previous 5 and 10-year periods, is a much more stable indicator of what residential sales may be in 2004. These longer periods also have the benefit of incorporating trends as well as all other factors.
The CG submitted that EDI’s distinction between “trend” and “cycle” was arbitrary and confused the issue. The more reliable and logical evidence was that the longer term periods, either the 5 or 10-year periods, indicate a growth rate significantly higher than that used by EDI. EDI’s own evidence indicated that, based on the period 1991-2002, the average Residential growth was 0.18%, almost two times that forecast by EDI.
Notwithstanding energy efficiency programs that have been in place over the last several years, the clear indication from Response PICA-EDI-69 is that the most recent 5 and 10-year periods suggest a positive net growth of an average of 0.47%, as referenced in the CG Argument (p. 5). The CG submitted that these longer-term periods incorporate both the impacts of both trend and cycle, and should be used by the Board in the derivation of the energy sales for the residential customers in 2004. EDI has not presented any persuasive evidence that increases in prices and energy conservation will offset or mitigate the historical experienced growth.
Commercial
The CG noted that EDI forecast commercial sales having regard to growth in
commercial/industrial real GDP in Alberta. The CG submitted that EDI’s evidence was the analysis of data from 1990 to 2002 which EDI used to argue there is a decline in the energy consumption per unit of industrial/commercial real GDP:
8 Tr. p. 1779
9 PICA-EDI-69, Attachment 10 Tr. p. 1780
The average growth rates in energy per household and energy per real GDP in the commercial and industrial sectors were computed for the period 1990 to 2002. The average rate for households was 0.2 per cent per year, while that for commercial and industrial was -0.7 per cent per year.11
The CG noted that In PICA-EDI-69 Attachment, EDI provided the data used to arrive at the above conclusion and that EDI decided to use a smaller negative value of 0.25% for
commercial/industrial energy since some of the decline may reflect the trend away from energy-intensive manufacturing in the City towards less energy-energy-intensive sectors and not be
representative of “pure” efficiency effects.
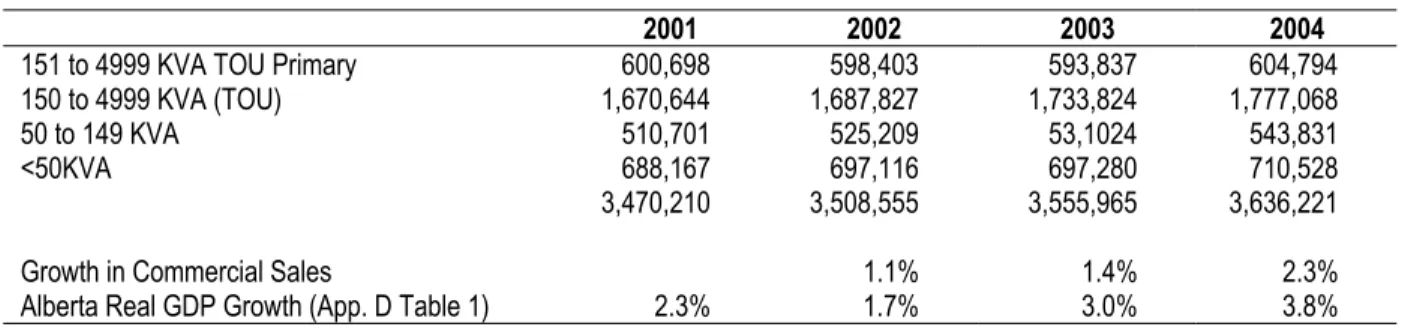
The following Table compares growth in normalized sales for EDI’s commercial customers (excluding customer specific) with growth in real GDP:
Table 1. EDI 2004 Commercial Sales Forecast
2001 2002 2003 2004
151 to 4999 KVA TOU Primary 600,698 598,403 593,837 604,794
150 to 4999 KVA (TOU) 1,670,644 1,687,827 1,733,824 1,777,068
50 to 149 KVA 510,701 525,209 53,1024 543,831
<50KVA 688,167 697,116 697,280 710,528
3,470,210 3,508,555 3,555,965 3,636,221
Growth in Commercial Sales 1.1% 1.4% 2.3%
Alberta Real GDP Growth (App. D Table 1) 2.3% 1.7% 3.0% 3.8%
The CG indicated that based on EDI’s evidence respecting the relationship between GDP and energy sales, a GDP growth rate of 3% would mean a sales growth rate of about 2.75 (3%-.25%). However, the CG noted that EDI’s forecast sales growth rate for 2003 was significantly lower at 1.4%. Similarly the CG noted that the sales growth rate for 2004 was only 2.3% whereas the CG submitted that the GDP growth rate would indicate a sales growth rate of about 3.55%
(3.8%-.25%) based on EDI’s evidence.
The CG’s took the position that the growth rates in commercial sales were understated and should be revised upwards for 2003 and 2004 to reflect growth rates that are consistent with GDP growth rates forecast by EDI. The CG recommended commercial energy sales growth rates of 2.75% in 2003 and 3.55% in 2004.
In reply CG noted that EDI stated that its industrial and commercial sales forecast was conservatively biased in favour of customers:
Questions were also asked respecting Dr. Stokes’ report in relation to energy consumption by industrial and commercial customers (commencing at T7:1796). In response, the witnesses confirmed that Dr. Stokes’ assumptions were, if anything, conservatively biased in favour of customers. (EDI Argument, p. 7)
The CG disagreed with EDI’s assessment. The CG submitted that, the forecast increase in commercial/industrial sales for 2003 and 2004 was not consistent with EDI’s stated assumptions as to the relationship between GDP growth and commercial/industrial sales.
11 Appendix D, p. 4
The CG submitted that the growth rates in commercial sales should be revised upwards for 2003 and 2004 to reflect growth rates that are consistent with GDP growth rates forecast by EDI. CG recommended energy sales growth rates of 2.75% in 2003 and 3.55% in 2004.
Views of the Board
The Board notes that the following issues were raised respecting EDI’s 2004 load forecast:
• The forecast energy use per customer for the residential rate class
• The forecast growth rate in load for the commercial rate class
With respect to the 2004 forecast energy use per customer for the residential class, EDI forecast an increase of 0.10% based upon an historical (1990 -2002) average increase of 0.17% reduced to 0.10% “as increases in price and energy conservation are likely to begin to offset the positive effects of income growth in the future”. The CG considered the increase should be 0.47% based upon an average of the experienced 5 and 10-year growth rates.
The Board has reviewed the method used by EDI to determine the forecast energy use per residential customer and considers the approach to be reasonable for the purposes of this Decision. The Board recognizes that EDI’s adjustment for price and energy conservation is an exercise in judgment into which many factors enter. The Board will accept EDI’s forecast based on that judgmental adjustment for the purposes of this Decision. However, the Board directs EDI to monitor energy use per residential customer and report on its forecast track record in this regard at the time of EDI’s next GTA.
With respect to the forecast growth in energy sales for the commercial class, EDI has forecast a 2.30% increase whereas the CG considered the increase should be 3.55% in 2004 to be more consistent with a forecast GDP growth rate of 3.80%.
The Board notes that EDI reduced the actual historical decrease of 0.74% in the energy use per commercial customer to 0.25%. In other words, if the historical data had been used, EDI would have forecast a commercial load increase lower than its 2.30% increase forecast. The Board considers that the overall increase of 2.30% strikes a reasonable balance between the forecast GDP increase of 3.80% and the higher indicated conservation decrease of 0.74%.
Accordingly the Board approves a 0.1% increase in the residential average energy use and the 2.30% increase in forecast sales to commercial customers for the purposes of the EDI 2004 load forecast.
Further the Board has reviewed and approves the remaining aspects of the 2004 EDI load forecast as set out in Appendix D “Billing Determinants Outlook”.
3 OPERATING EXPENSES
EDI indicated that its GTA cost forecast was based on EDI’s budget for 2004. EDI’s witnesses confirmed that there were no differences between EDI’s 2004 cost forecast and its budget (Tr. p. 1721).
In response to questions from the Board and various counsel, EDI’s witnesses provided a detailed explanation of the Corporation’s 2004 budgeting process (see EDI’s response to UCA-EDI-7 and Tr. pp. 1458-61, 1474-76, 1484-86 and Tr. pp. 1656-76, 1707-13, 1718-19, 1721-22, 1726-31, 1739-46). In Argument EDI summarized the process generally followed by EDI for each budget year as follows:
In developing its budget, EDI used a combination of a “bottom up” approach and a “cost trend” approach to forecasting expenditures based on expected work activity and cost levels during the forecast period.
The budget process for 2004 was initiated in March 2003. An initial meeting among the EDI management team was held to commence the process. Discussion among the management team included potential areas where forecast costs had the potential to change significantly in 2004. Personnel involved in the budgeting process went into that process with the understanding that they were expected to do their best to avoid cost increases and, in fact, to find better ways of doing things to reduce costs, and to build in cost savings and productivity improvements from the outset of the budgeting process.
For 2004 budgeting purposes, 2002 actual costs and 2003 reforecast costs (based on seven months of actuals and five months of forecast numbers) were relied on as providing a basis for the budgeting process and for determining cost trends. Known changes and any new information that could affect EDI’s costs during 2004 compared to 2002 actuals and 2003 reforecast were considered and, where necessary, were reflected in the 2004 budget.
Responsibility centre foremen, managers and supervisors provided the initial input for the
budget, and they were involved throughout the budgeting process. That input went to department managers who reviewed it and prepared a detailed budget for their respective area(s) of
responsibility. Directors reviewed their respective managers’ budgets. EDI Finance, including the Controller, reviewed all components of the budget.
The budget was first prepared in 2003 dollars on a detailed basis at the activity, general ledger or account level. This level of detail ensured that EDI Finance was able to apply the appropriate inflation factor to each budgeted amount (i.e., at the account level) to arrive at the 2004 budget. Where a specific cost for 2004 was known, the actual cost was used, rather than a forecast amount with the application of an inflation factor.
The budget was also reviewed by the President of EDI a number of times through the process and was revised on an iterative basis. Once approved by the President of EDI, the budget was presented to the Finance and Review Council of EPCOR Utilities Inc. (EUI) for review and approval, after which it was presented to the EUI Board of Directors for review and approval. The budget was approved by EUI’s Board of Directors on November 27, 2003. Neither
Edmonton City Council nor City of Edmonton staff had any input into EDI’s budgeting process.
When asked how he, as the President of EDI, assessed whether proposed cost increases in the 2004 budget over previous years were fair and reasonable, Mr. Rowes testified as follows: (Tr. pp. 1658-59)
A. Mr. Rowes: I assess that by going through the various categories with them [i.e., EDI’s managers]. For example, distribution operations – why did that change? Why did the customer services line change – and look for reasonable explanations. Certainly, I would be concerned with any cost increases whatsoever.
Q. Were you concerned with that 24 percent increase?
A. Mr. Rowes: I was when I first saw it, but I believe that the explanations that I received were reasonable and what was required to run the business.
Views of the Applicant
EDI noted that it provided extensive and detailed evidence respecting the manner in which its operations and maintenance costs were derived. EDI submitted that the record demonstrates that EDI’s cost forecast process for 2004 was logical and appropriate and, further, that it was
sufficiently rigorous and contained checks and balances to ensure that the various components of the cost forecast were reasonable.
EDI submitted that the evidence also shows that EDI’s 2004 forecast costs are just and
reasonable and are prudently required to enable EDI to provide service to retailers and end-use customers and satisfy the criteria set out in section 122(1) of the EUA for Board approval. EDI submitted that a comparison of forecast costs with previous years’ actuals, together with the detailed explanations provided by EDI in areas where its costs are forecast to increase, confirmed that EDI is prudently managing its costs in 2004. EDI also submitted that its operating record demonstrates conclusively that EDI is working hard to ensure that system reliability is
maintained at the highest level while working in a safe and environmentally sound manner. Views of the Board
The Board notes that EDI indicated that its GTA forecasts reflected its budget forecasts. The Board agrees that EDI’s overall method for forecasting costs by using budget forecasts is logical and appropriate. The Board will deal with specific concerns in EDI’s operating and maintenance expense forecasts in the sections that follow.
3.1 Inflation Related Increases to Operating Expenses
EDI indicated that it had retained Dr. Ryan, a Professor in the University of Alberta’s Economics Department, who is a highly qualified expert in the area of inflation forecasts and escalators. Dr. Ryan’s Report detailing the derivation of the inflation factors used in EDI’s budget and cost forecast was included as Appendix C to EDI’s DTA. Further detail demonstrating the
reasonableness of the inflation factors was provided in EDI’s responses to STM-EDI-3 and UCA-EDI-14. EDI noted that Dr. Ryan was not challenged in cross-examination, and no evidence was filed taking issue with his analysis or conclusions.
Table 3 on Page 8 of the GTA shown below shows the EDI’s inflation forecast for the three categories of general inflation forecasts:
Table 2. EDI 2004 Forecast Cost Escalation % from Table 3 of EDI’s GTA
Category 2004
Salaries and wages 3.4
Materials and contractors 1.4
Other (Note) 2.0
Note: The “other” category includes those costs not included in the “salaries and wages” and “materials and contractors” categories. The Conference Board of Canada forecast of the Consumer Price Index for Alberta was utilized for this category.
Views of the Applicant
EDI submitted that the record demonstrates that the inflation factors developed by Dr. Ryan and used to derive EDI’s 2004 cost forecast are reasonable. EDI submitted that it is incumbent on the Board to assess each cost area having regard for, among other things, the detailed information that EDI has provided in respect of each forecast increase.
EDI submitted that its evidence demonstrates that all increases in 2004 forecast costs are justified, and confirms the reasonableness of its 2004 operating cost levels.
In Reply EDI noted that despite the facts that no party filed evidence taking issue with EDI’s inflation factors or with Dr. Ryan’s report and that Dr. Ryan was not asked a single question in cross examination, the CG Argument makes a number of claims with respect to Dr. Ryan’s report. EDI submitted that the claims were unsubstantiated and that the CG attempted to lead new evidence in Argument.
In regard to CG’s positions EDI submitted the following:
Forecast inflation rate for wages and salaries
EDI submitted that there was no reasonable basis for the CG’s argument that the 3.4% inflation factor used for wages and salaries was too high. First, the 3.4% value is from Table 3 of Dr. Ryan’s report (EDI Application, Appendix C, p. 5). This figure was based on Conference Board forecasts for 2004 dated July 16, 2003.
EDI submitted that as EDI is located in Alberta the CG’s suggestion, to choose the average of all wage settlements in Canada as the lower bound that applies to EDI, was inappropriate. EDI’s remuneration must be competitive with comparable Alberta employers if EDI is to retain its existing workforce and attract new employees. Thus, if ATCO Gas and AE employees received a 3.3% to 3.4% increase, a similar rate of increase would be expected for EDI employees.
EDI submitted that the fact that AE and ATCO Gas were investor owned utilities rather than a municipally owned utility has absolutely no effect on the salaries that these utilities must offer. It is ludicrous to expect that a potential employee would accept a lower wage just because the employer is municipally owned rather than investor owned. The CG argument ignored the fact that employees are mobile, especially within provincial boundaries where tax regimes are the same.
EDI submitted that the CG failed to provide any reasonable basis for its recommended reduction. Instead, the evidence demonstrates that the 3.4% forecast is based on sound logic and is entirely reasonable, and should be approved by the Board.
In reply EDI noted that while the CG asserted that EDI had not met its burden of proof of
demonstrating that the base plus at-risk components of management salaries are at the median of salaries in the market, none of the interveners proffered any evidence challenging EDI’s position. Further, in response to STM-EDI-4, EDI stated that it relied on Towers Perrin market salary surveys and Watson Wyatt Canadian Salary surveys in setting its total target compensation levels for management employees, both of which are proprietary in nature and could not be filed in evidence. EDI submitted that the interveners were not able to proffer any evidence, or to put any document before the witnesses, to suggest that EDI’s forecast target total compensation for its management employees was at anything other than median in the market.
Forecast inflation rate for materials and contractors
EDI noted that the CG accepted EDI’s approach and methodology in forecasting the inflation rate for materials and contractors but recommended that the inflation factor should be reduced to reflect a 1% growth in CPI rather than the Conference Board’s forecast of 2.0% for growth in CPI.
EDI submitted that it was inappropriate on the CG’s part to attempt to lead what is essentially new and untested evidence by way of Final Argument under the guise that it is “well known” and available on a website, and to then argue that EDI’s costs should be reduced as a result. EDI has been given no opportunity to test or respond to that evidence with facts and analysis of its own. In addition, EDI submitted that CG’s approach flies in the face of the Board’s fixed forward test year approach to tariff regulation since EDI’s inflation factor forecast, like all other aspects of its cost forecast, was made at the time of its Application based on the best and most current
information available. Actuals often prove to differ from forecast, but it is entirely inappropriate for an intervener to “cherry pick” certain aspects of a forecast and argue that it should be reduced based on an actual that becomes known after the initial forecast was made (and months after the evidentiary portion of the hearing has concluded).
EDI submitted that the evidence which was properly on the record of this proceeding (and which continues to be unchallenged in any proper way by the CG or any other party) demonstrated that its forecast inflation rate for materials and contractors is entirely reasonable and should be approved by the Board. The Board should reject the CG’s attempt to lead new evidence at this point in the proceeding and disregard its argument completely.
Forecast inflation rate for “Other”
EDI submitted that, for the same reasons the CG’s requested reduction to EDI’s forecast inflation rate to 1.0% for “Other” should also be denied, and the Board should approve EDI’s applied-for rate of 2.0%.
Views of the Interveners CG
The CG submitted that EDI’s inflation forecasts for 2004 are too high and not adequately supported by the evidence for the reasons set out below:
Forecast inflation rate for wages and salaries
The CG submitted that Part 3 of Appendix C (Dr. Ryan’s report) provided several benchmarks against which to compare EDI’s inflation forecast of 3.4% for wages and salaries. Of these benchmarks the only one that exceeded 3.4% was the average wage increase in Newfoundland and Labrador for 2004. The remaining benchmarks range from 0% for B.C. Hydro’s office and technical workers to 3.4% for AE’s linemen.12 The CG submitted that EDI’s 3.4% forecast was at
the upper end of a range of forecasts that could reasonably be used in EDI’s circumstances. A reasonable lower end might be 2.01%, which is the overall average shown in Table 5 of
Appendix C. The CG proposes that the midpoint of this range, 2.7%, should be adopted for the purposes of EDI’s refiling.
The CG submitted that another test of the reasonableness of the proposed 2.7% figure is EDI’s forecast of inflation for materials and contractors (1.4%) and for “other” (2.0%). By comparison, the CG proposal appears more than reasonable. It is also worth noting that EDI’s union
employees received increases of 4% in each of 2002 and 2003 (S105-EDI-8). As might be the case with some of the benchmarks provided in Table 5, the CG submitted that there was no need for a large increase to make up for inadequate increases in prior years.
Further, the CG noted that 3.4% requested by EDI was not supported by any of its actual data arising from negotiated settlements with bargaining unit employees. EDI and other EPCOR employee groups are still in negotiations.
The CG also noted that, while EDI placed reliance on settlements involving investor owned utilities, viz. AE and ATCO Gas at 3.4% and 3.3% respectively (also presumably supported by the Conference Board, EDI is a municipally owned utility. The CG submitted that other sources referred to in Table 5 show settlements made with crown corporations, i.e. B.C. Hydro, Hydro Quebec, Toronto Hydro, etc. The CG submitted that, since the average increases demonstrated for these organizations was in the 2% range, 2.7% is generous and 3.4% is much too high. The CG also submitted that, while EDI may believe its At Risk compensation allows its
management employees to achieve compensation that is comparable to other companies, neither EDI nor EUI provided further documentation in the form of a market survey or independent special study to substantiate this claim.
The CG also submitted that EDI did not provide any reason to support the 3.4% forecast for inflation of wages and salaries, other than the fact that the forecast was originally provided by the Conference Board. To the contrary, the CG noted that Dr. Ryan provided information showing this forecast is equal to the second-highest of the 17 wage settlements in the Canadian utility industry (% increase for 2004) shown in Table 6 of Appendix C of EDI’s Application (Dr. Ryan’s report).
12 Application, Table 4 of Appendix C
In reply, the CG submitted that EDI did not provide any reason to support the 3.4% forecast for inflation of wages and salaries, other than the fact that the forecast was originally provided by the Conference Board. To the contrary, the CG noted that Dr. Ryan provided information showing this forecast is equal to the second-highest of the 17 wage settlements in the Canadian utility industry (% increase for 2004) shown in Table 6 of Appendix C of EDI’s Application (Dr. Ryan’s report).
Forecast inflation rate for materials and contractors
The CG noted in Appendix C of the Application and in response to STM-EDI-3, EDI provided an explanation of how the forecast inflation rate for materials and contractors was derived. In the end, this forecast is determined by the Conference Board’s forecast of the Consumer Price Index and Dr. Ryan’s calculations relating the CPI to the Industry Price Index for Industrial Electrical Equipment (IPIIEE). The basis for this determination is that the IPIIEE correlates strongly with the CPI.
The CG accepted EDI’s approach and methodology in forecasting the inflation rate for materials and contractors. The CG then went on to provide new evidence on the level of CPI that the Board has rejected as being inappropriately provided in Argument.
In reply CG submitted that EDI’s argument implied that EDI relied solely on Dr. Ryan to develop the inflation forecasts. Whereas, in UCA-EDI-14(e), EDI acknowledged that Dr. Ryan was engaged to provide the historical index, and it was up to EDI to approve and use the index provided. This response was provided in the context of an information request dealing with the Industry Price Index for Industrial Electrical Equipment. The CG indicated that, while it
accepted Dr. Ryan’s qualifications and his method of using the predicted CPI for forecasting the escalation of costs for materials and contractors, the CG took issue with the level of EDI’s inflation forecast.
Views of the Board
The Board notes that the CG raised concerns regarding the general inflation levels used as well as certain specific expenses as set out in other sections of this Decision.
The following table sets out the proposals of EDI and the CG respecting recommended forecast inflation levels for 2004.
Table 3. EDI and CG Recommended Forecast Inflation % for 2004
EDI CG
Category 2004 2004
Salaries and wages 3.4 2.7
Materials and contractors 1.4 1.0
Other (Note) 2.0 1.0
Note: The “other” category includes those costs not included in the “salaries and wages” and “materials and contractors” categories.
In regard to the general inflation factors, the Board has separated its findings into the three categories used by EDI as follows:
• Materials and Contractors
• Other
The Board also notes that in other sections of this Decision the value of benchmarking is
discussed. For comparability purposes, the Board directs EDI in the next GTA, to file its general inflation factors by the following categories: salaries and wages, materials, contractors and other. Forecast inflation rate for salaries and wages
The Board notes that EDI has forecast a composite (i.e. management and union) 3.4% increase to salaries and wages based on the Conference Board of Canada forecast as of July 16, 2003 for Alberta across various industries, while the CG suggested the forecast should be reduced to 2.7% to be more consistent with the average of other Canadian utility wage settlements.
The Board recognizes that a composite forecast increase in the inflation rate for salaries depends upon the relative proportion of union and management salaries and differences between the Edmonton labour markets and other labour markets in Alberta. The Board notes that the levels of compensation for the CUPE and IBEW members are negotiated between EDI management and the respective unions. Because these are arm’s length negotiations, the Board considers the compensation package for these employees to be market based for the purposes of this Application before the application of the 3.4% increase.
The Board is satisfied that the Alberta wage increases (actual 3.3-3.4% for ATCO settlement levels and the 3.4% Conference Board of Canada forecast) provide better forecast indicators than a forecast of Canadian wage increases. The Board does not consider that there is any evidence supporting the CG’s speculation that government-owned utility settlements should carry more weight than privately-owned utility settlements, as both types of utilities compete for labour in the same market.
On balance, the Board accepts that EDI’s forecast 2004 inflationary increase of 3.4% for all salaries and wages is reasonable.
To provide better support for future compensation increase forecasts, the Board directs EDI, in its next GTA, to provide an independent testable market-based assessment of the reasonableness of its compensation levels for its management, professional, CUPE, and IBEW employees. The assessment should consider each of the Exempt levels (i.e. Executive, Director, Manager, Supervisor, Non-Management, Corporate Allocated) as well as the two types of Non-Exempt (i.e. CUPE, IBEW). In addition to salaries and wages, the overall compensation packages including pension and other benefits should be assessed for each category.
Forecast inflation rate for materials and contractors
EDI submitted that CG’s approach flies in the face of the Board’s fixed forward test year
approach to tariff regulation since EDI’s inflation factor forecast, like all other aspects of its cost forecast, was made at the time of its Application based on the best and most current information available. While the Board has allowed updates prior to testimony by expert witnesses to reflect changes in general rate expectations for bonds and inflation rates in past proceedings, in this instance the CG’s evidence on inflation was provided in its argument. The Board agrees with EDI that the CG’s attempt to lead new evidence on CPI levels at the argument stage in the
proceeding is inappropriate and unfair. Accordingly the Board will disregard the CG’s submissions as they relate to updates to the CPI levels.
The Board notes that, while the CG objected to the level of the CPI forecast EDI used, the CG accepted Dr. Ryan’s method of using the predicted CPI for forecasting the escalation of costs for materials and contractors. The Board has reviewed the detailed information provided by EPC to support the reasonableness of each increase in each area of the Application, and agrees with CG that the method used appears to be appropriate. However, unlike the CG, the Board considers that the record demonstrates that the inflation factors developed by Dr. Ryan from predicted CPI and used to derive EDI’s 2004 cost forecasts were logically developed and appear reasonable. Accordingly, the Board accepts the forecast increase of 1.4% that EDI has proposed in its GTA for materials and contractors.
Forecast inflation rate for “Other”
For similar reasons, the Board rejects CG’s requested reduction to EDI’s forecast inflation for “Other” and the Board approves EDI’s applied-for rate of 2.0%.
3.2 Non-Inflation Related Increases in Operating Costs 3.2.1 Overall Operating Costs
Views of the Applicant
EDI noted that EDI’s witnesses were questioned on EDI’s operating costs which were forecast to increase from 36.3 million in 2002 to $44.9 million in 2004, a 24% increase over a two-year period (Tr. p. 1658). A number of other parties asked questions respecting specific areas in which EDI’s costs are forecast to increase from 2001 and 2002 actuals and/or 2003 re-forecast levels.
EDI submitted that, during cross-examination, interveners often appeared to seek “high-level” explanations for forecast cost increases. In responding to questions relating to forecast increases in EDI’s overall affiliate transactions costs, Mr. Cowburn emphasized the following: (Tr. pp. 1920-22)
Q. Well, I’m just interested, Mr. Cowburn, if you could put in some – I was hoping – succinct narrative form for the record here. We’re trying to understand, Is this a trend that more services are being performed, like more variety of services are being performed and charged as intercompany transactions in the existing services are rising?
A. Mr. Cowburn: I don’t believe there’s any overall characterization that’s going to be helpful. When things have to be done differently or when new requirements arise, as, for example, security, the company looks at what is the most effective way of dealing with that, both for the subsidiaries and for the company as a whole. And we consider whether it’s most effective for the parent company to undertake a program or for the subs to do their own thing. And it varies, depending on what the circumstances are.
So it’s really not a matter of providing a high-level directional, Here’s-what’s-happening explanation, but rather, you have to look at each and every one of the individual services and factors driving those services and assess whether, Is this a reasonable way of
So there is no one overall characterization that I think will fairly help to assess what’s happening. That’s why we provided this detailed information.
EDI indicated that its approach in this proceeding was to provide detailed information
demonstrating the reasonableness of each increase in each area of the Application. For example, EDI provided a detailed, account-by-account breakdown of its 2004 forecast and 2003 reforecast operating costs in Exhibit 003-83. EDI also provided detailed explanations of the year over year changes in the various components of its operating costs, including forecast increases in 2004, in its Application, responses to information requests, oral testimony and undertaking responses. In reply EDI noted that while the CG asserts that the level of increases in EDI’s operating costs in 2003 and 2004 “are excessive having regard to inflation over the 2001 to 2004 period and other regulatory changes”, the CG does not assert that the Board should disallow some portion of EDI’s overall operating costs on this basis, but instead the CG identified specific reductions it was recommending.
EDI submitted that the Board should assess the reasonableness of its cost increases based on the various rationales and drivers provided by EDI in evidence, only one of which is inflationary increases. EDI submitted that, when the Board did so, the Board would conclude that EDI has justified the increases both on an overall and individual basis.
Views of the Interveners CG
The CG submitted that the increases in O&M expense per customer from 2001 to 2004 should be assessed by the Board having regard to the reasons for the increases. The CG noted that EDI’s O&M expenses reflected significant increases in 2003 and 2004, on a per customer basis, as shown below:
Table 4. EDI Per Customer O&M Expenses
2001 2002 2003 2004
O&M per Customer [AE ED 1 Att] 142.13 146.39 155.43 169.7 Less Property Tax per customer [AE EDI 1 Att] 17.32 17.68 17.58 17.92 O&M Excluding property tax per customer 124.81 128.71 137.85 151.78
Percent increase year over year 3.1% 7.1% 10.1
EDI explained a good portion of the increase was attributable to the advent of EUB regulation in 2004 and the need to comply with load settlement requirements.
In the CG’s view the year over year increases shown above were high notwithstanding the identified drivers for the increases. An increase of approximately $27 million or 22% from 2001 to 2004 is materially higher than may be attributable to inflation over the three-year period. The CG submitted that the Board must assess the overall reasonableness of the above increases in light of the reasons provided. In the CG’s submission the level of increases are excessive having regard to inflation and other regulatory changes.
Views of the Board
The Board notes CG’s view that the year over year increases are high, notwithstanding the identified drivers for the increases (the advent of EUB regulation in 2004 and the need to comply
with load settlement requirements). The CG submitted that an increase of approximately $27 million, or 22%, from 2001 to 2004 is materially higher than may be attributable to inflation over the three-year period.
The Board notes that the overall increases as set out in EDI’s evidence were not disputed by interveners aside from specific increases that the Board will deal with in the other sections of this Decision. Specifically the Board will look at EDI’s explanations regarding O&M expenses related to:
• Distribution Operations Customer Services Site,
• Metering Settlement and Tariff Services,
• Support Services,
• Bad Debt and
• Affiliate Transactions
The Board considers that EDI has provided a logical and complete explanation of its
requirements for specific increases, aside from those listed above that the Board has dealt with in other sections of this Decision.
3.2.2 Distribution Operations Views of the Applicant
EDI indicated that explanations for increases in EDI’s distribution operations costs were provided in EDI’s response to BR-EDI-9. There the main reasons for the forecast increases in distribution operations costs from 2002 actual and 2003 reforecast levels to 2004 forecast were set out.
EDI indicated that in 2002 and 2003, lower priority work such as underground secondary maintenance, base leveling and cubicle cleaning had to be deferred due to increased levels of capital work requirements, primarily due to work that had to be performed on ETI’s underground transmission system and work that was required as a result of the growth in EDI’s URD and UID systems. The deferral of maintenance work in favour of capital work was described by EDI’s witnesses as follows: (Tr. pp. 743-45; see also Tr. pp. 1286-87)
Q. Yes. So I think there’s sort of two issues. Okay, the engineering staff, if you can give that split. But then even just your total personnel. Like, what I’m getting at is if there are -- if one year you’ve got high capital expenditures, then it may be that a lot of capital projects, the field people are going to be charging their time to that, that’s the way you’ve budgeted for it and everything. But then it may be, then, that the operating side of it is down a little bit in that year.
A. MR. BYRON: That’s correct.
Q. But in another year, the next year, it switches around. Is there any way you can give sort of an indication on that split, just on your operating people as well?
A. MR. ROWES: The best that I could add there is that, generally speaking, our capital program is made up of, generally, 50 percent refurbishment of the existing system. I’m not talking about IT; I’m talking about keep-the-lights-on type capital, and the other half is new-customer connects. Where we get into a problem from time to time is usually
when the new customer connects or customer demand goes way high on us. We then look at the priorities on our operating and maintenance accounts, and you go on something that may be a lower priority, and that might not get done in that year because you’ve diverted the resources to the capital program. The kind of resources I’m talking about diverting are like journeymen-level resources. I mean, we could easily go hire somebody to do what we refer to as “utility work” or sort of “labourer work,” but most of the -- most of the capital construction that we do, and as well as our maintenance, the driver behind that is our journeymen-type resources. And if we don’t have them available for one, we can’t get the work done.
Q. All right. What was running through my mind is if -- when you set the revenue requirement, it’s based on the operating expense budget, secondary effect through the capital, right? But –
A. MR. ROWES: That’s correct.
Q. Can there be a lot of fluctuations in this operating expense budget from year to year that’s solely due to the fact you’ve got a certain number of journeymen, but, you know, they’re just -- this year they’re spending a larger percentage of their time on capital, another year less –
A. MR. ROWES: It does happen from time to time, and we do -- we do get fluctuations from time to time.
Q. So can you give me just a rough split for 2003 and 2004 what, on your journeymen, just what the split is between operating and capital? Is that -- would that be hard to do?
A. MR. ROWES: We think we have an approximate number here. We believe in ‘04 it’s more like a 50/50 split, and then ‘03 it would have been 60 percent on capital and 40 percent on operating. And that’s just a best guess without looking up the numbers.
Distribution operations costs in 2004 are forecast to increase to enable EDI to “catch-up” on the work that was deferred during 2002 and 2003.
EDI indicated that other drivers of forecast cost increases in 200413 included changes to the
method by which EDI cleans switching cubicles (i.e., using dry ice blast cleaning techniques rather than removing the cubicle from the field which resulted in power outages for customers); increased work on the network system driven by the need to increase the use of dissolved gas in oil analysis in EDI’s network transformers; remediation of poles based on the results of EDI’s pole inspection program; and an increase of three Full Time Equivalents (FTE) to provide 24 by 7 standby capability,14 and an increase of two FTEs for a contract manager and accounting
analyst.15
In reply, EDI noted that the CG argued that “unless EDI is able to provide justification for considering the increase of $0.6 million attributable to facilities for meter installation and repair operations as an ongoing O&M item, this item ought to be disallowed” from EDI’s 2004
operating cost forecast.
13 BR-EDI-8 14 Tr. pp. 1221-22 15 Exhibits 003-49 and 68
EDI indicated that the cost of operating and maintaining the facilities relating to meter operations was included in the Operations cost category on line 1 of Schedule D-2 to EDI’s Application for 2002, 2003 and 2004. EDI submitted that, as noted by the CG, prior to 2002 the metering operations were performed by a third party contractor, and EDI was billed for the cost of meter operations, maintenance, repair and overheads, which included the cost of the facilities. As such, for 2001 the costs associated with these facilities were reflected in the metering category on Schedule D-2 as part of the contractors’ charges to EDI.
The $600,000 increase in ongoing distribution operations expense in 2002 referenced by the CG is due to EDI having taken over the metering function from the contractor and becoming
responsible for its own metering facilities. The costs associated with these facilities were shown in the distribution operations category. EDI submitted that a review of Schedule D-2 shows that metering costs decreased from $2.7 million in 2001 to $1.7 million in 2002, far more than the $600,000 increase identified by the CG. EDI submitted that the record justified the $600,000 increase questioned in the CG’s Argument, and that it should be approved by the Board.
In response to CG’s argument that EDI’s forecast distribution operations costs should be reduced by $200,000 in relation to “catch up expenditures” on distribution maintenance, asserting that “expenditures related to past years are part of the Utility’s risk,” EDI noted the evidence
describing the additional work that has to be done in 2004 in relation to underground secondary maintenance, cubicle cleaning and base leveling relative to previous years. EDI submitted that the evidence demonstrated that it is entirely appropriate that EDI include this work, which must be completed in 2004, in its cost forecast. EDI noted that the CG does not challenge the fact (and appears to concede the fact) that the $200,000 cost relates to work that will be completed in 2004.
Views of the Interveners CG
The CG noted that during examination EDI acknowledged at least $200,000 of increased maintenance reflected in the above summary relates to catch up for maintenance not undertaken in prior years.
Q. Can you tell me how much the catchup would be from 2002, 2003.
A. MR. BYRON: I don’t have a specific number. It’s -- for such items, I think we’ve used as an example in our discussions, cubicle cleaning, switching cubicle cleaning is something that we fell behind on in 2002 and 2003, and we’ve put some renewed effort in 2004, and we predict probably in 2005 we’ll have additional efforts there as well to get that cubicle cleaning or the switching cubicle cleaning back up to snuff.
Q. Can you tell me what portion of the 576 would be related to the catching up.
A. MR. BYRON: We estimate that to be in the order of $200,000.16
The CG submitted that expenditures that should have been undertaken in prior years and not carried out due to change in circumstances are part of the utility’s risk. Accordingly, such
expenditures should be excluded from the 2004 revenue requirement. The CG submitted that the $200,000 related to catch up expenditures should be disallowed.
In reply the CG disagreed with EDI’s view that EDI’s forecast operating costs for 2004 are reasonable and prudent and should be approved by the Board. The CG noted that EDI goes to great length to justify certain O&M increases in 2004 due to “catch up” resulting from higher capital activity in the prior year:
In 2002 and 2003, lower priority work such as underground secondary maintenance, base leveling and cubicle cleaning had to be deferred due to increased levels of capital work requirements, primarily due to work that had to be performed on the underground ETI’s transmission system and work that was required as a result of the growth in EDI’s URD and UID systems. (EDI Argument, p. 15)
The CG submitted that the labour expense forecast included in revenue requirement would be expected to be based on normalized levels of capital activity. If capital activity in the year is higher than normal on an actual basis, a higher proportion of the labour would be capitalized. Alternatively, if capital activity is lower than normal, a higher expense for labour would be recorded. This is the nature of the risk assumed by the utility. On that basis, the CG submitted that there was no justification for including any “catch up” expenditures related to 2002 or 2003 in the forecast O&M for 2004. This was especially so given the transition to regulation by this Board.
The CG also noted that EDI attributed a $0.6 million increase in distribution O&M to facilities for meter installation and repair operations that EDI took over from a contractor in 2002.17 The
CG submitted that, if this transaction involved replacement of ongoing contractor costs there did not appear to be any reason for the increase. Further, that it was not clear to the CG whether this item was an ongoing operating expense or a one time cost. CG submitted that, if it was a one time cost for purchase of the facilities from the contractor, then EDI should be directed to treat this item as a capital item. Alternatively, if it was a one-time expenditure in 2003, then it should not be included in the forecast for 2004.
The CG submitted that, unless EDI is able to provide justification for the proposed treatment of this expenditure as an O&M item, the $600,000 item ought to be disallowed from the distribution O&M forecast for 2004.
Views of the Board
The Board notes that the CG raised two specific concerns with the increases in EDI’s distribution O&M.
First, the CG questioned the $0.6 million increase in distribution O&M attributable to facilities for meter installation and repair operations that EDI took over from a contractor in 2002. The Board notes that EDI explained that the $600,000 increase in distribution operations expense in 2002 referenced by the CG is due to EDI having taken over the metering function from the contractor and becoming responsible for its own metering facilities.
17 BR-EDI-9
The Board considers that EDI’s explanation of the offsetting decrease in metering costs indicates that more than $600,000 was appropriately removed from metering costs when EDI moved the metering function in-house. The Board notes that the savings exceeded the costs of EDI
performing the metering function and considers that the savings were appropriately accounted for. Therefore, the Board sees no need for any other adjustment to EDI’s forecasts in regard to this matter.
Second, the CG submitted that expenditures that should have been undertaken in prior years but were not carried out due to changes in circumstances should be part of the utility’s risk and excluded from the 2004 revenue requirement. CG submitted that the $200,000 related to catch up expenditures should be disallowed. In reply, EDI noted that CG did not claim that this is work that will not or need not be done in 2004. While EDI submitted that the work will be and must be done in 2004, the Board does not consider the issue to be whether the work will or needs to be done in 2004. The Board considers that EDI’s justification of inclusion in 2004 revenue requirement simply because the work will be done in 2004, does not respond to the issue of whether the work has already been paid for by customers.
The Board notes that EDI used the term “catch-up” to refer to maintenance that EDI was not able to get to in 2002 and 2003 “due to the load-growth spurt that we experienced”.18 The Board
considers that the term “catch-up” provides a strong indicator that these operating expenditures were planned to be carried out in 2002 and 2003 and would therefore have provided the basis upon which forecast and actual results would have been measured under EDI’s performance based regulation (PBR). The Board notes that EDI is kept whole by the fact that the expenditures originally planned to be “operating” expenses were diverted to “capital” and therefore EDI will be compensated, after the test period, for these unexpected capital expenditures through rate base.
The Board agrees with CG that “catch-up” type expenditures that have formed part of EDI’s prior year maintenance budget forecast should not be allowed in EDI’s current year revenue requirement. The Board considers that lower than planned maintenance in 2002 and 2003 would have been rewarded under EDI’s PBR. Accordingly, if the Board were to allow such items in EDI’s current year revenue requirement, EDI would double recover from customers for the expenses to maintain its facilities.
Considering all of the above, the Board is not persuaded that it should allow EDI to charge for catch-up expenses relating to maintenance that should have been performed in prior years. Accordingly, the Board directs EDI, in its refiling, to reduce its revenue requirement for the $200,000 of distribution operations catch-up type expenditures.
3.2.3 Customer Services Views of the Applicant
EDI indicated that it had provided detailed evidence explaining forecast increases in its customer services costs in Section 5.1.2 of its Application and in response to IPCAA-EDI-23. EDI
submitted that customer services costs were not challenged in cross-examination and no evidence was filed taking issue with these costs.
Views of the Board
Interveners did not specifically challenge these costs. The Board has reviewed the customer services costs and considers them to be reasonable.
Accordingly the Board approves EDI’s 2004 forecast of customer services costs. 3.2.4 Site, Metering, Settlement and Tariff Services
Views of the Applicant
EDI indicated that the main forecast cost increases in the site, metering, settlement and tariff services area related to increases in the forecast number of off-cycle meter reads, increased meter field activity, and changes in the inter-corporate service agreement with EPCOR Water Services Inc. (EWSI).
As was noted in EDI’s Errata Letter (Exhibit 003-10, p. 2), the increased costs of off-cycle meter readings are offset by a revenue offset. As noted at Tr. p. 1292, increases in meter field activity are expected as EDI returns to tasks deferred during the intense construction activities of the past few years, as described in the context of distribution operations expense. Changes in the inter-corporate service agreement with EWSI are described in Appendix B-2-3 of EDI’s Application, and their justification is explained in the BearingPoint report (Appendix B-7, section 3.2.2.3, p. 37). EDI indicated that these changes are based on an analysis of costs actually incurred, and represent a fair sharing of the costs of meter reading with EWSI, to the benefit of EDI’s electric service customers.
In reply, EDI noted that the CG argued that EDI’s metering services forecast should be reduced by $0.25 million in relation to “catch up expenditures”, asserting that “expenditures related to past years are part of the Utility’s risk”. DEI submitted that for the reasons provided in respect of the “catch up” distribution maintenance work, the costs associated with “catch up” work relating to metering services is justified and should be approved (Tr. pp. 1291-92). EDI noted that the CG did not claim that this is work that will not or need not be done in 2004.
Views of the Interveners CG
The CG submitted that meter maintenance and meter verification expenditures that should have been undertaken in prior years and were not carried out due to changing circumstances are part of the utility’s risk. In the CG’s view such deferred expenditures should be excluded from the 2004 revenue requirement. The CG submitted the $250,000 related to catch up expenditures should be disallowed.
Views of the Board
The Board considers that the circumstances of the “catch-up” work on meter maintenance are similar to those of the other “catch-up” expenses dealt with earlier in this Decision.
For similar reasons as for the other “catch-up” expenses dealt with earlier, the Board directs EDI, in its refiling, to reduce its revenue requirement for the $250,000 of metering O&M catch-up type expenditures.
3.2.5 Support Services
EDI provided extensive information relating to support services. There are two broad categories of support services: services provided internally by EDI personnel, and services provided by EUI personnel. This section deals with the costs of services provided internally by EDI personnel. Views of the Applicant
EDI noted that the CG asserted that EDI’s forecast increase in internal administrative costs was unwarranted, and claimed that the Board should reduce EDI’s applied-for costs by $0.25 million in 2004 “to reflect a fair level of increase in administrative expenses for 2004 consistent with the change to EUB regulation”.
EDI submitted that the CG provided no reasonable basis, either in evidence or compelling argument, for the recommended decrease. By contrast, EDI provided evidence explaining its forecast increase in administrative costs (e.g., BR-EDI-8(a) and UCA-EDI-21(a)). Furthermore, the BearingPoint reports demonstrate the reasonableness of EDI’s 2004 forecast costs vis-à-vis the services provided in the four categories identified by the CG. EDI submitted that the
evidence shows that these cost increases are reasonable and justified and should be approved by the Board. The record demonstrates that EDI’s forecast increases in support services costs for 2004 are justified and should be approved by the Board.
Views of the Interveners CG
EDI’s support services costs are made up as follows (in Millions of dollars):
Table 5. EDI Support Services Costs
2001 Actual 2002 Actual 2003 Re-Forecast 2004 Forecast
EDI Costs 3.6 3.0 3.3 3.9
EUI to EDI Operating 5.0 5.6 5.0 5.9
EUI to EDI Capital Usage Fee 1.0 2.3 3.4 3.3
EDI to ETI -1.0 -2.0 -1.5 -1.9
ETI to EDI 0.2 0.1 0.2 0.3
EDI to ETECH -0.5 -0.6 -0.6
EDI to EESI -0.1
Total Support Services O&M 7.9 8.5 9.9 10.9
Source: Exhibit 003-083
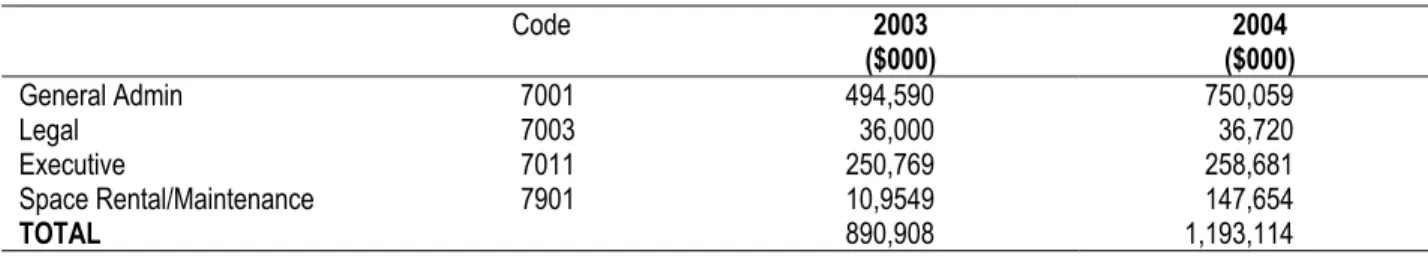
The above table shows EDI’s costs increasing by $0.3 million from 2002 actual and by a further $0.6 million from 2003 to 2004. The major portion of the increase relates to the following accounts:
Table 6. EDI Accounts with Major Support Services Cost Increases
Code 2003 ($000) ($000) 2004 General Admin 7001 494,590 750,059 Legal 7003 36,000 36,720 Executive 7011 250,769 258,681 Space Rental/Maintenance 7901 10,9549 147,654 TOTAL 890,908 1,193,114