Transforming the
electricity sector
8
Update PaperUPDATE 2011
UPDATE 2011
© Commonwealth of Australia 2011
This work is copyright. Apart from any use as permitted under the Copyright Act 1968, no part may be reproduced by any process without prior written permission from the Commonwealth. Requests and enquiries concerning reproduction and rights should be addressed to the Commonwealth Copyright Administration, Attorney General’s Department, National Circuit, Barton ACT 2600 or posted at www.ag.gov.au/ccaIMPORTANT NOTICE
This publication is produced for general information only and does not represent a statement of the policy of the Commonwealth of Australia or indicate a commitment to a particular policy or course of action. The views expressed in this paper are those of the author and do not necessarily reflect those of the Commonwealth of Australia. The Commonwealth of Australia and all persons acting for the Commonwealth of Australia preparing this publication accept no liability for the accuracy, completeness or reliability of or inferences from the material contained in this publication, or for any action as a result of any person’s or group’s interpretations, deductions, conclusions or actions in relying on this material. Before any action or decision is taken on the basis of this material the reader should obtain appropriate independent advice.
Publication and general enquiries to the
Garnaut Climate Change Review – Update 2011 can be directed to:
Garnaut Climate Change Review – Update 2011 GPO Box 854
CANBERRA ACT 2601 Tel: 02 6159 7868
Garnaut Climate Change Review – Update 2011
Update Paper eight:
Transforming the electricity sector
Ross Garnaut
TRANSFORMING THE ELECTRICITY SECTOR
Key points
• The electricity sector will respond strongly to reduce emissions with carbon pricing.
- There will be early switching of fuels, especially from coal to gas and an increasing
focus on less emissions-intensive forms of generation.
• With or without a carbon price, a significant amount of investment in generation capacity will
be required in the years ahead, reflecting the age of generation assets.
• The introduction of a carbon price is highly unlikely to threaten physical energy security.
- Nevertheless, it may be prudent to implement cost effective policy measures to
assuage concerns about energy security and to improve the regulatory functions of the energy market. These measures include:
the introduction of an Energy Security Council to implement measures to
counter energy market instability regardless of the source; and
the judicious provision of loan guarantees to high-emissions generators through
the transition to carbon pricing.
• While electricity prices will rise in coming years, the increase associated with a carbon
price is in fact smaller than recent increases.
- Increased capital costs, and rising gas and coal prices from the resources boom will
contribute to higher electricity prices in the years ahead.
• The recent electricity price increases have mainly been driven by increases in the costs of
transmission and distribution.
- There is a prima facie case that weaknesses in the regulatory framework have led to
overinvestment in networks and unnecessarily high prices for consumers.
- The upcoming review of regulatory arrangements by the Australian Energy Regulator
presents an opportunity to correct distortions in current regulations.
• There can be large gains from planning transmission for a truly national electricity market,
with greater inter-state connectivity increasing competition, resilience against supply shocks, and reducing the cost of connecting new low-emissions power sources.
- Other and more expensive power generation mitigation measures, especially the
renewable energy target and subsidies for new roof top solar, can be phased out as the carbon price rises, or feed-in tariffs replaced immediately by more efficient measures for new investments.
• Electricity price effects from the introduction of a carbon price on low- and middle-income
consumers can be offset by efficiency-raising tax and social security reform and supplementary measures.
- Other sources of price increases can probably be greatly reduced with more efficient
3
Table of contents
1. Introduction ... 5
2. Recent trends in electricity prices ... 6
2.1 Drivers of electricity prices ... 8
2.2 The costs of government policy ... 14
2.3 The future of existing mitigation policies after the introduction of a carbon price ... 15
3. The risks to energy security in the transition to a low carbon electricity sector ... 18
3.1 The transition in electricity generation ... 18
3.2 The economics of brown coal generators ... 21
3.3 Potential risks to energy security ... 22
3.4 General measures to enhance the stability of the National Electricity Market ... 25
4. Electricity infrastructure to support the transition to low emissions ... 29
4.1 The future of the transmission network ... 29
4.2 Possible future network extensions ... 31
4.3 Towards a national electricity market ... 32
5. Network regulation ... 38
5.1 The regulation of network providers in Australia ... 39
5.2 A brief assessment of the Australian regulatory regime ... 42
5.3 Steps towards a better regulatory regime ... 44
5.4 The role of distributed small scale generation technologies in networks ... 44
6. Households and electricity prices ... 47
6.1 Assisting households ... 48
7. Conclusion ... 51
List of figures
Figure 1: Real electricity prices in Australia and the seven major advanced economies, 2006 to 2009, index
in US dollars ... 7
Figure 2: Real household electricity price movements - constant 100 would mean electricity prices rising at same rate as other prices ... 8
Figure 3: Electricity costs and their contribution to current price rises in 2010 ... 9
Figure 4: Weighted average electricity spot prices ... 9
Figure 5: Total electricity network investment ... 11
Figure 6: National energy demand ... 13
Figure 7: New South Wales PV system costs per kW of installed capacity (2010 dollars, excluding rebates) 16 Figure 8: Typical Output from 1 kW of grid‐connected PV, installed at the appropriate orientation and inclination ... 17
Figure 9: ‘Uncertain World’ scenario ... 21
Figure 10: ‘Fast Rate of Change’ scenario ... 21
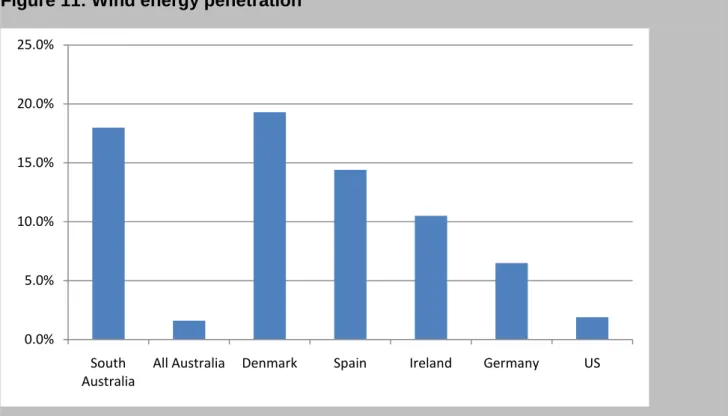
Figure 11: Wind energy penetration ... 37
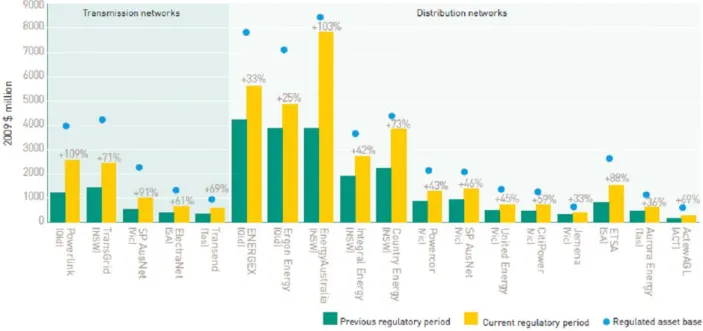
Figure 12: Electricity network investment ... 39
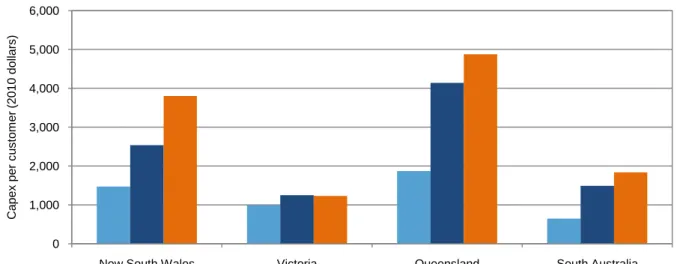
Figure 13: Real capital expenditure per customer ... 43
Figure 14: Electricity Affordability ... 48
List of tables
Table 1: Consumer Price Index - Electricity ... 7List of boxes
Box 1: 2008 indicative future wholesale gas costs ... 10Box 2: Retail price regulation ... 14
Box 3: Investments in solar photovoltaic ... 16
Box 4: A non-baseload future for brown coal-fired generators ... 20
Box 5: Emergence of electricity generation-retail integration and competition policy ... 24
Box 6: An alternative: Contract for Closure ... 28
Box 7: National Transmission Network Development Plan: scenarios of the future National Electricity Market ... 30
Box 8: Real options analysis in transmission planning ... 33
Box 9: How state-based transmission reliability standards undermine the national grid ... 35
Box 10: Integrating intermittent generation sources ... 37
Box 11: Rate-of-return versus price-cap regulation ... 40
Box 12: Smart Grid, Smart City ... 46
Box 13: Residential price elasticity ... 49
5
1. Introduction
The transmission of a carbon price through to household and business electricity prices will drive the development of low-emissions generation and, more generally, lower emissions in the electricity sector. This will involve a switch in the predominant sources of power used in generation. It will involve the building of new low-emissions generation. It will involve the closure of high-emissions generation. It will also moderately reduce the growth in electricity demand in the short term, and more strongly over the longer term as users economise on electricity use. An appropriate carbon price will drive this change and Australia’s National Electricity Market is well placed to respond to the carbon price signal.
The response of electricity suppliers to the new incentives structure will be faster and stronger, and the effect in increasing electricity prices smaller, if the carbon price is accompanied by fiscal support for research, development and commercialisation of low-emissions electricity generation, distribution and transmission technologies.
For households, the price increases associated with the introduction of a carbon price come at a difficult time, with recent and prospective large non-carbon-price-related electricity price rises. The increases have come mainly from investment in distribution. Without changes in regulatory policies, large increases in retail electricity prices can be expected for some years, greatly exceeding and creating a difficult environment for increases associated with a carbon price. The effects of the resources boom on coal and gas prices and construction costs are likely to increase substantially electricity costs and prices in the period ahead. The effects of carbon pricing will further increase costs and prices—smaller than the increase in distribution costs over recent years, but still considerable.
Any inefficiencies in the domestic energy markets or regulatory regimes warrant early analysis and correction, especially if they are leading to unnecessary price rises. Improvements to regulatory markets will both ease the adjustment to carbon-related price rises and improve the welfare of Australians. The increase in effective competition and economically efficient regulation and provision of transmission and distribution services are the main factors in limiting the rate of increase in costs. The price controls that remain in all states except Victoria should be removed in each jurisdiction once arrangements have been made to secure effective competition.
This paper discusses the impact of the carbon price on changes in electricity supply over time, and on prices. The effects of other sources of price increases are also examined—both those that are unavoidable, and those that may be the result of regulatory and structural imperfections in the National Electricity Market. There are signs that lower growth in demand is reducing the need for investment. In addition, improving the regulation of the electricity market would reduce pressures for price increases. It is possible that these developments could go a long way towards offsetting the addition to electricity prices of the introduction of a carbon price.
The National Electricity Market covering the five Eastern States and the Australian Capital Territory, as it has emerged from reform over the past two decades, has many fine features. In some ways it is the most advanced electricity market in the world. But these strengths persist alongside a few weaknesses that are at once significant in their effects on the price of electricity, on energy security and the capacity to adjust to the imperative to reduce emissions, and readily correctible. Further reform is a matter of urgency, since it would affect adjustment to a carbon price and the movement to a low-emissions economy. The most important outstanding reform relates to regulation of investment in transmission and distribution networks. Recent developments in planning of transmission can usefully be extended. The introduction of a carbon price will change the choice of fuel sources, move investment decisions toward low-emissions forms of generation and unlock the possibilities of new technologies by driving innovation. It is important to maintain confidence in security of electricity supply as the transition proceeds. Actual or perceived threats to energy security will be a stumbling block to the transformation that is to come and it is prudent to examine policies to deal with any substantial sources of concern.
Such an examination is best conducted in the context of review of the regulatory arrangements in the electricity sector more generally, as the substantial sources of concern can be present independently of
the introduction of a carbon price.1
Section 2 of this Update Paper examines recent trends in electricity prices and the drivers of these trends. Rising electricity sector network costs are found to be the main contributor to recent and prospective electricity price increases. Section 3 examines the impact of a carbon price on electricity generation and the transition to a low-emissions electricity sector. This is followed in Section 4 by an examination of developments in the electricity transmission network, with particular attention to how well existing arrangements complement the introduction of a carbon price. In Section 5, the network sector of the electricity market is examined closely and reforms suggested. Section 6 briefly comments
on measures to assist households, complementing discussion in Update Paper six (Carbon pricing and
reducing Australia’s emissions). Section 7 concludes with a discussion of the future of the electricity sector in Australia.
2. Recent trends in electricity prices
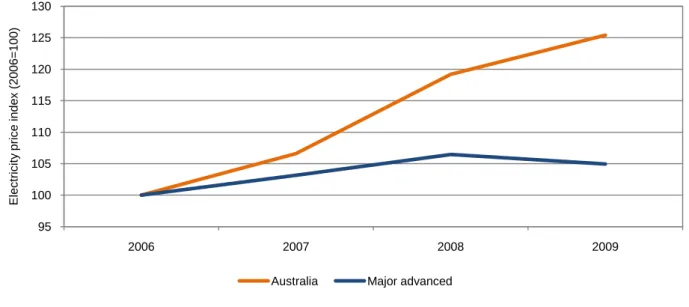
Australian households and businesses enjoyed relatively stable and low retail electricity prices for many decades. Despite recent increases, they continue to enjoy relatively low prices by international standards. However, in recent years there has been a marked step up in Australian household electricity prices. After a long period in which Australian electricity prices rose more or less in line with other prices, they rose much faster than other prices from about 2006. Over recent years, Australian electricity price increases have outpaced other advanced economies (Table 1 and Figure 1).
From 2007 to 2010, electricity prices for households nationally rose by 32 per cent in real terms (ABS 2010c). While there is some variation in the extent of price rises across the states and territories, they display a consistent upward trend in prices over this period. These increases have been well ahead of the general increase in prices and faster than growth in average wages. While the consumption of electricity makes up a relatively small component of a typical household’s expenditure, these price rises are putting pressure on lower income households.
Electricity prices for businesses have also increased rapidly since 2007. While household and business electricity prices have not always moved together, due largely to the presence and unwinding of cross subsidies between the two, recent price rises are common across both customer types.
Electricity price increases are set to continue under current policies and regulatory arrangements. In those states in which electricity prices are regulated for residential and household consumers, further price increases have been announced. In the states (New South Wales and Tasmania) that have made decisions on electricity prices beyond 2011, annual price rises of around 10 per cent are expected over 2011-12 and 2012-13 (IPART 2010a, OTTER 2010). These expectations do not contain allowance for a carbon price.
Rapidly rising electricity prices and the prospect of further increases have raised concerns about the effects of the introduction of a carbon price. In the following sections I will show that the increase in electricity prices that arises from a carbon price is smaller than recent increases. Moreover, as I
outlined in Update Paper six (Carbon pricing and reducing Australia’s emissions), low income
households should be fully compensated for increases in costs due to the carbon price. In this respect, electricity price rises that result from a carbon price are different from price increases from other sources, for which no compensating tax, social security and supplementary measures are available. Nevertheless, the unusually large increases in electricity prices from other sources raise sensitivity to increases associated with the carbon price. This adds to the good reasons for ensuring that the
1
For analysis of the implications of climate change policies for the South-West Interconnected System of Western Australia, see AEMC (2008a).
7
electricity market is operating efficiently during the transition to low emission electricity generation and not causing price increases that are unnecessary on economic grounds.
Table 1: Consumer Price Index - Electricity
Source: Plumb and Davis (2010)
Figure 1: Real electricity prices in Australia and the seven major advanced
economies, 2006 to 2009, index in US dollars
95 100 105 110 115 120 125 130 2006 2007 2008 2009 E lec tr ic it y pr ic e index ( 2006= 100)
Australia Major advanced Source: IEA 2009, OECD 2010.
Figure 2: Real household electricity price movements
(constant 100 would mean electricity prices rising at same rate as other prices)
Source: Australian Bureau of Statistics, Consumer price index for electricity (Category 6401.0).
2.1 Drivers of electricity prices
The increases in electricity prices reflect many factors including increased investment in electricity networks (the poles and wires that distribute electricity from power plants to the home) as well as policy changes (such as the Renewable Energy Target) that have led to higher costs (Sims 2010).
In the future, rising network costs and government policies—unless changed—will continue to contribute to large electricity price rises. In addition, rising generation costs due to high construction costs through the resources boom, higher coal and gas prices, and the introduction of a carbon price— will also contribute. Of these likely drivers of future price increases, households will only be compensated for the introduction of a carbon price.
One way to explore the increase in prices is to examine how costs have changed for the three components of electricity prices—the costs of generating the power, the cost of distributing it to households, and the cost of billing and selling electricity to the households.
The costs of generating power, or wholesale electricity costs, accounted for around 40 per cent of the overall electricity price in 2009. The cost of moving power to households—transmission and distribution costs—made up about 50 per cent of the price. About 10 percentage points of the movement costs are for transmission and 40 per cent for distribution. The retail costs, which represent about 10 per cent of the overall bill—include energy retailers’ costs and margins in acquiring and servicing customers through billing, marketing and other means and the trading of electricity between generators and retailers.
Figure 3 illustrates the relative contribution of these components towards current price rises. Rising network costs are the greatest factor in rising electricity prices, accounting for approximately 68 per cent of recent price rises. Wholesale electricity costs and retail costs are also placing some upward pressure on prices: approximately 19 per cent of recent rises can be attributed to increases in wholesale prices while 14 per cent can be attributed to retail cost allowances. Proportionate increases are much larger for networks and retail than for generation.
70 80 90 100 110 120 130 140 150 1990-91 1994-95 1998-99 2002-03 2006-07 20010-11 Index 1990 -91 = 100
9
Figure 3: Electricity costs and their contribution to current price rises in 2010
Sources: The contribution of the cost components to electricity price rises is based on an average of the current regulated retail price determinations across jurisdictions in the National Electricity Market (except Victoria which no longer regulates prices) (QCA 2010, IPART 2010a, ICRC 2010, OTTER 2010, ESCOSA 2010).
Electricity generation or wholesale costs
In most of Australia the wholesale electricity market is competitive and therefore wholesale prices are determined primarily by the dynamics of supply and demand. Over the past three years, there has been an easing in the growth in demand. Higher electricity prices reflecting mostly higher network costs have led to consumers moderating their demand for electricity. Over the past year, milder weather reduced the summer demand; industry sources also suggest that the insulation program and photovoltaic installations have had some effect.
Figure 4: Weighted average electricity spot prices
Generation prices have fluctuated widely but around a remarkably steady level in the recent years of large increases in retail electricity prices. These have not been a general cause of rising retail electricity prices. Nominal prices in all states in 2010 were below earlier peaks, in most cases by a large amount.
0 20 40 60 80 100 120 Average price 1999-2005 2005-06 2006-07 2007-08 2008-09 2009-10 $ per m egaw at t hour QLD NSW VIC SA TAS
Drought has played a role in price fluctuations in recent years. Drought raised the cost of water-cooled coal fired power stations (and also reduced the output of Snowy and Tasmanian hydro systems). This along with record peak demands and other factors led to average wholesale electricity spot prices in the National Electricity Market rising to record levels in 2006-07 and 2007-08 (AER 2010a). The end of the drought placed downward pressure on wholesale prices from mid 2010.
Network costs
The network is composed of transmission and distribution. Network costs refer to the costs of transporting electricity to customers via the establishment and maintenance of the transmission and
Box 1: 2008 indicative future wholesale gas costs
Gas-fired electricity generation is based on mature technologies with lower cost structures than renewable energy in the current state of technology and gas prices. With emissions about 40 per cent of those from brown coal and 50 per cent of those from black thermal coal it has the potential to play a major role in Australia’s transition until the costs of lower emission technologies fall considerably. Gas-fired generation has low capital costs but high fuel costs compared with other sources of electricity. Relative gas prices in each of Australia’s three regional markets (Eastern, Western and Northern) will therefore influence the rate of the switch to gas generation from coal.
Gas-fired generation accounted for around 20 per cent of Australia’s installed generation capacity in 2008-09, but only 12 per cent of generated output (ESAA 2010). This reflects its use as the current preferred fuel for peaking and intermediate generation while coal dominates baseload generation. Gas prices in most of Australia have been historically low and stable by world standards, defined largely by provisions in confidential long-term supply contracts, which account for most wholesale gas traded in Australia. In contrast, gas prices in Western Australia rose strongly to export parity levels upon the expiry and renegotiation of long-term prices. Recent Ministerial Council on Energy reforms have improved transparency and competition in domestic gas markets, increasing information and allowing for trade of gas supply-demand imbalances to occur.
In 2008, the Review foreshadowed the potential for gas price increases above and beyond those predicted in the modelling as a gas export industry emerged in eastern Australia. The export of coal-seam gas is moving towards maturation, and price increases are still in prospect.
The Australian LNG industry is currently comprised of two distinct hubs located in Western Australia and the Northern Territory. Australia’s east-coast LNG industry is in the early stages of development with first exports expected from 2014. Western and Northern market gas reserves are in large offshore basins that cannot be economically developed on the basis of domestic demand alone. A lack of competition, exposure to the international LNG market and project development delays have contributed to recent domestic price volatility in Western Australia.
Eastern market coal seam gas reserves are entirely onshore and more easily developed in small increments. The immediate outlook in the Eastern market is for gas prices to remain low as the growth in export capacity lags behind coal seam gas supplies (EnergyQuest 2011). In the longer term, industry views, economic analysis and current pressures on price in long-term contracts suggest that prices in new east-coast domestic gas contracts are likely to rise towards the export parity price due to arbitrage through the international LNG market. On the other hand, increasing global gas supplies including from Australia, Central Asia, the Middle East and the United States, can be expected eventually to put downward pressure on gas prices in the East Asian markets that determine Australian export parity prices.
Switching from coal to gas-fired electricity generation will assist Australia in meeting national emissions reduction targets over the next decade. As a result, electricity prices are expected to become more sensitive to movements in domestic gas prices over the long-term, as the role of gas-fired generation
11
distribution network. Transmission is the extremely high voltage assets – metal towers connecting generators to substations. Distribution is the lower voltage wiring that brings power from substations to customers. Both are regulated under similar rules.
Network costs have risen dramatically since 2006. The high capital cost of investment required in electricity networks is the single largest cause of recent electricity price rises.
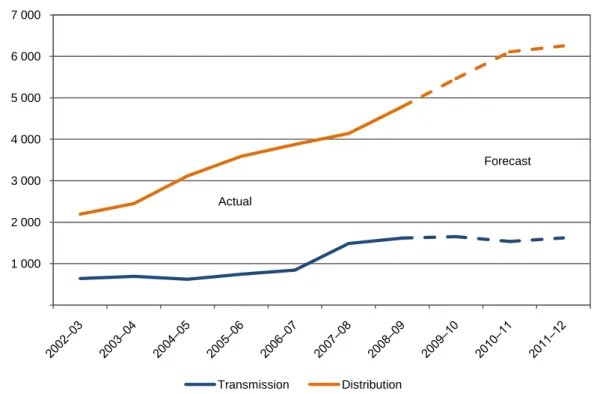
Transmission network investment over the current five year regulatory period2
Figure 5: Total electricity network investment
is forecast at over $7 billion and $32 billion for distribution networks (AER 2010a). This represents a rise in investment from the high levels of the previous period, of 84 per cent and 54 per cent (in real terms) in transmission and distribution networks respectively (AER 2010a).
Source: AER (2010a). State of the Energy Market 2010. Network investment covers jurisdictions in the National Electricity Market.
These high levels of network investment have been attributed to the need to replace ageing assets, electricity load growth and rising peak demand and changed standards (reliability and service requirements).
While these factors explain some of the increase in network costs, the explanation raises some questions. For example, demand growth has not been particularly rapid in recent times.
Here we present the explanations that the Australian Energy Regulator has provided for the increase in distribution costs.
The need to replace ageing assets
In the recent New South Wales distribution price determinations by the Australian Energy Regulator it is argued that much of the New South Wales network was built between the 1960s and 70s and many parts are now reaching the end of their useful life. The necessary replacement of ageing assets
2
Current regulatory period revenues are forecast in regulatory determinations (AER 2010a p54) 1 000 2 000 3 000 4 000 5 000 6 000 7 000 2009 $ ( m ill ion) Transmission Distribution Actual Forecast
accounts for around 31 per cent of investment in the New South Wales distribution networks (AER 2009a).
There are questions about whether “economic lives” for any economic assets are uniform and finite; about the bunching of the end of economic lives of assets that were installed over two decades; about the appropriate balance between maintenance to extend life and new capital expenditure; and about whether catching up with past neglect of maintenance is better corrected over short periods or gradually over longer periods.
Changed standards
The costs associated with environmental, safety, statutory obligations, and other system and non-system assets such as IT, and business support are another source of increase in network costs. These are said to make up 18 per cent of investment in New South Wales distribution (AER 2009a).
Load growth and rising peak demand
Rising customer connections off the back of strong population growth are also highlighted in the AER’s recent distribution determinations as a strong driver of investment. For example, for New South Wales distributors a 28 per cent increase in new customer connections per annum by 2013-14, relative to the previous regulatory period, is forecast by the distributors.
Again, there are some questions. New South Wales population growth averaged 1.4 per cent per year between 2005 and 2010 and is projected to slow to 1.1 per cent between 2010 and 2015 (ABS 2008b, 2010b).
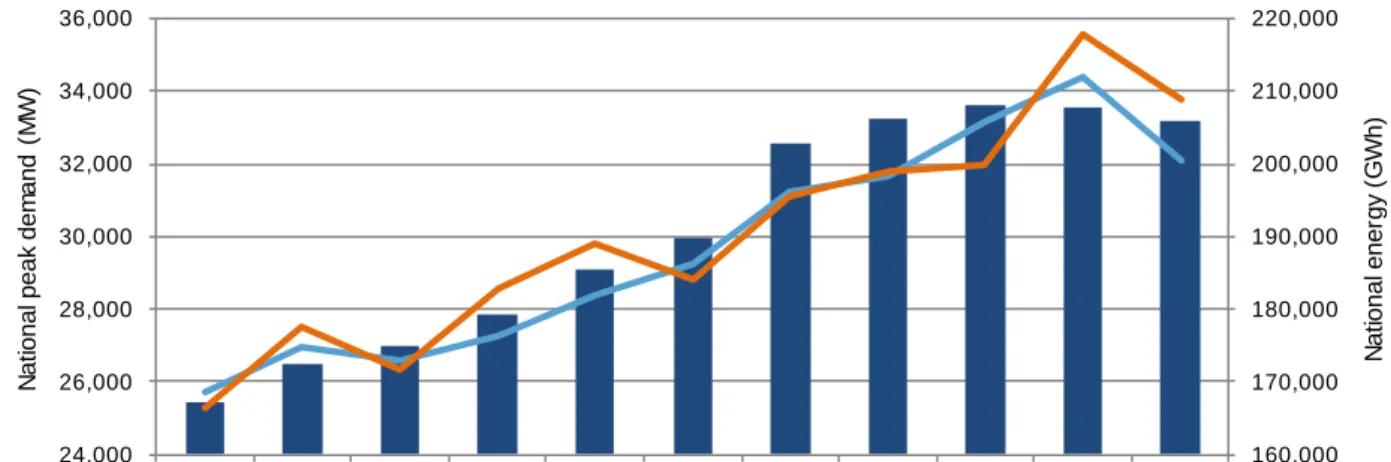
In addition to the growing customer base, the Australian Energy Regulator points to the continued growth of average household energy demand as a source for increased requirements of distribution capacity. Figure 6 shows that electricity demand grew much more rapidly than population from 2000 to 2005, but more or less in line with population after that. Industry sources are puzzling over the recent deceleration of growth in electricity consumption, and variously mention the effects of rising prices, the cool summer of 2010-11, and some contribution from improved insulation and other energy efficiency measures and increased use of household photovoltaics, as noted earlier.
The Australian Energy Market Operator predicts that energy demand in the National Electricity Market will continue to increase over the next 10 years at an average yearly rate of 2.1 per cent under a medium growth scenario (AEMO, 2010a).
Australians have been paying more attention to energy efficiency in appliances and buildings. This may have been having some effect on demand. At the same time, other developments are working to offset the tendency for appliances and buildings to be more energy efficient, including:
• Growth in electrical appliance consumption, which is projected (DEWHA 2008) to increase from
71 petajoules in 1990 to 169 petajoules in 2020—almost a 5 per cent increase each year. The number of electrical appliances per household has risen rapidly in recent decades. In addition, a shift in the type, size and usage of appliance is also increasing energy consumption—for example, market penetration of air conditioners has doubled over the past decade.
• The rapid increase in the average size of new homes, up by 40 per cent from 1985 to 2009.
Australia’s new homes are now the largest in the world—well above those in the US, and almost double those of the UK. This has clear implications for increasing household energy use, particularly related to lighting, heating and cooling (DEWHA 2008; Commsec 2009).
13
These plausible reasons why the growth in energy demand might be expected to be strong should be set against the evidence that the growth in energy demand has in fact decelerated considerably since about 2006.
It is peak rather than total demand that drives most of the need for network investment. Here one can see influences that could be expected to increase recent demand for distribution services. Through the early twenty first century, the winter peak in demand exceeded the summer peak in some years and fell short of it in others. In the hot summer of 2009-10, the summer peak rose well above the winter peak, and stayed there through the cooler summer of 2010-11 (Figure 6). The summer peak fell markedly in 2010, but this effect is strongly influenced by seasonal conditions.
In Australia, unlike other developed countries, there has as yet been little effort to discourage peak usage of power through variable pricing, smart meters and smart grids (see Section 5). This would seem to offer large opportunity to ease the growth in peak demand.
Figure 6: National energy demand
160,000 170,000 180,000 190,000 200,000 210,000 220,000 24,000 26,000 28,000 30,000 32,000 34,000 36,000 1999–00 2000–01 2001–02 2002–03 2003–04 2004–05 2005–06 2006–07 2007–08 2008–09 2009–10 N at ional ener gy ( G W h) N at ional peak dem and (M W )
National (RHS) Winter (LHS) Summer (LHS) Source: AER 2010.
Several States have recently adopted higher reliability standards for distribution networks. These require additional capital investment by the network businesses in these states to ensure that the higher standards can be achieved within the regulatory requirements.
The setting of reliability standards and service requirements has not been subject to institutional or regulatory reform. Rather than being based on a probabilistic cost-benefit approach to reliability, most states tend to use a relatively crude and deterministic approach to dictate reliability requirements. This tends to lead to higher standards being imposed than would be the case under a probabilistic approach. This increase in reliability comes at a cost that is paid by all electricity consumers.
There is no opportunity for consumers to make their own choices on what they are prepared to pay for greater reliability, when standards are already high.
Customer retail services and related costs
The National Electricity Market retail sector is a fully contestable market, except for Tasmania, with private players being able to enter the market and compete for customers. However, these businesses continue to be subject to jurisdictional price regulation, whereby retail prices are capped by the utilities regulator. Victoria is the exception, where the market has been fully deregulated. In determining retail
prices, the utilities regulator takes into account a wide range of factors, including the drivers of costs from generation to distribution, and retailer margins.
2.2 The costs of government policy
A number of government policies to promote energy efficiency improvements and renewable energy generation are funded from the prices paid by consumers for electricity. These policies therefore contribute directly to higher retail electricity prices, and depending on the level of uptake, have the potential to place further upward pressure on prices. They feed into all three components of electricity costs: wholesale, network and retail components.
These programs generally fall into three categories:
The Renewable Energy Target
Under the Renewable Energy Target scheme, retailers must ensure that a proportion of their electricity supply is from renewable energy sources or face penalties for non-compliance. Renewable energy is a more expensive source of electricity and therefore adds to wholesale electricity prices.
From 1 January 2011, in response to concerns that the Renewable Energy Target price was being suppressed by an unexpectedly large growth in small-scale technologies such as roof-top
photovoltaics, the Government split the scheme into a large and small scale technology component.
The Large scale Renewable Energy Target is largely modelled off the original design. The Small scale Renewable Energy Scheme has a fixed price, similar to that of a feed-in-tariff, and electricity retailers are obliged to purchase all Small Renewable Energy Scheme certificates in proportion to their market share. The regulator has set the retailers an obligation to purchase Small Renewable Energy Scheme certificates equalling 14.8 per cent of their 2011 sales, which alone will comprise about 3 per cent of an electricity bill in 2011 (Office of the Renewable Energy Regulator 2011).
When the Renewable Energy Target was first expanded, it was estimated to add approximately 4 per cent to electricity prices in the period 2010 to 2015, or by about 0.8 per cent per annum (MMA 2010). Some state regulators have foreshadowed higher impacts on prices. While these increases may seem small they may turn out to be larger than this estimate, particularly with the high levels of Solar
Box 2: Retail price regulation
Price cap regulation was intended as a transitional measure during the development phase of retail energy markets. The Australian Energy Market Commission reviews the adequacy of competition in retail energy markets to determine an appropriate time to remove retail price caps.
Any decision to remove retail price regulation resides with the relevant jurisdictional government. Victoria is the only jurisdiction to take this decision to-date. The government of South Australia has declined to remove retail price regulation even though the Australian Energy Market Commission advised that there were sufficient levels of competition.
Ongoing cost of living concerns have increased the reluctance of governments to allow prices to be determined in the market. However, as recent price rises have demonstrated, retail price regulation has not helped to constrain the rising costs of electricity.
Moreover, the regulatory uncertainty engendered by current arrangements would tend to suppress the supply response to higher prices. This defeats the notion that price cap regulation provides more assurance to households on lower electricity costs. The tendency to suppress responses to high prices can be present even when the practice is to allow full pass-through of all prices, because suppliers are not certain that they will receive the price increase.
15
Photovoltaic uptake in New South Wales that were not foreseen. More importantly, they are unnecessary once the economy-wide carbon price is carrying the load of the transition to a low-carbon economy. The Update confirms the recommendation of the 2008 Review: that the penalty for non-compliance with the renewable energy target requirements should remain fixed permanently in nominal terms, so the influence of the target gradually fades out with time and the increase in the carbon price.
Feed-in-tariffs
Feed-in-tariff schemes pay a premium rate to encourage renewable electricity generation through small scale generation such as solar photovoltaic systems. The costs of these premium rates are spread across all consumers. All consumers cross subsidise those who can afford the up-front capital costs of such systems.
The cost of a feed-in-tariff depends on the scheme design, tariff rate and the level of uptake. There has been relatively strong demand for these schemes in most states. In South Australia, the cost of feed-in-tariffs comprised around 0.5 per cent of an average household electricity bill in 2008-09 (Miley 2009). In New South Wales, the more generous tariff rate led to higher than expected demand and it is said that it would have added 5-10 per cent to retail prices in 2011/12 (Premier of NSW 2011) if it had been left in place. This resulted in a decision by the New South Wales Government in 2010 to reduce the feed-in-tariff payment and to avoid the impact on electricity bills by off-setting the full costs of the Scheme through the State Budget.
Other government policies
Some jurisdictions have also implemented policies and programs which affect the retail electricity price differently depending on scope, scale and design. In most cases the objective of these programs is to encourage energy efficiency, demand management and carbon abatement by requiring retailers or distributors to undertake specific activities. Generally these programs comprise only about 1 to 2 per cent of the retail electricity price. They include initiatives such as the Queensland Gas Scheme, the Energy Savings Scheme in New South Wales, the Greenhouse Gas Reduction Schemes in New South Wales and the ACT, the Residential Energy Efficiency Scheme in South Australia, and smart meters in Victoria.
Victoria began its rollout of smart meters to consumers in 2009 with the aim of reducing peak and overall energy demand by giving consumers the information needed to manage their consumption more efficiently. The rollout costs would have accounted for retail electricity price increases of around 2.5 to 7 per cent in 2010 when the costs were first passed onto consumers—network charges increased on
average by almost $70 in 2010 and a further increase of around $8 is expected in 2011. The difficulty
with this program is that the meters’ capabilities are not being fully utilised, and the payback comes over a number of years, while the costs are readily visible on bills today.
Smart meters can play a major role in reducing electricity demand. They can reduce price increases even more, as a part of systems that encourage and enable consumers to reduce demand at peak times. Education for users and new retail supply systems are necessary for these advantages to be realised. Smart meters and their potential benefits are discussed further in section 5.4.
2.3 The future of existing mitigation policies after the introduction of a
carbon price
A carbon price will be the main driver of transformation of the electricity sector. The carbon price will alter electricity production and consumption—but it is neutral as to how this change is achieved. In some cases the carbon price may drive deployment of low-emissions generation—large or small scale—or it may lead to fuel switching, or the adoption of more efficient operating practices in various sectors of the economy.
Box 3: Investments in solar photovoltaic
Solar photovoltaic (PV) panels convert solar radiation to electricity. Small, rooftop PV systems have become extremely popular with Australian households. Australia has seen more than a six-fold increase in PV generation capacity over the 2000s—and a 360 per cent increase between 2008 and 2009 (Macintosh and Wilkinson 2010; Wyatt and Wyder 2010). In October 2010, around 187,000 small-scale PV systems were installed, with a total capacity of 301 MW (around 0.6 per cent of registered capacity in the National Electricity Market)(Clean Energy Council 2010).
The economic case for the installation in PV has been made more appealing by falling capital costs and rising electricity prices, and the private commercial case by rich government subsidies.
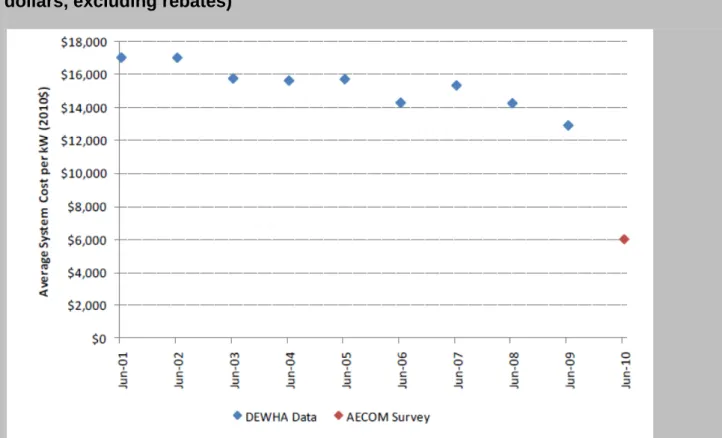
The capital costs of solar PV systems in Australia have fallen dramatically in recent years, due to falling international PV module pries, a larger and more competitive market, and a stronger Australian dollar (AECOM 2010; Green Energy Markets 2010). In Australia, typical system prices for grid-connected systems of up to 5 kW fell by 36 per cent between 2000 and 2009 (Wyatt and Wyder 2010) and more in 2010. This decline is illustrated below for New South Wales.
Figure 7: New South Wales PV system costs per kW of installed capacity (2010
dollars, excluding rebates)
Source: AECOM (2010).
In 2010 an average benchmark system price for a 1.5 kW system in Australia was around $7,725 (module cost of around $2.15 per watt, and $1,140 for the inverter). Average quoted costs for systems of other sizes are discussed below. The net cost to customers—post-Renewable Energy Certificates or subsidies—have been much lower, and in some parts of Australia a 1.5 kW system can be as low as $2,300 (Green Energy Markets 2010).
In 2010 an average benchmark system price for a 1.5 kW system was around $7,725 (module cost of around $2.15 per watt, and $1,140 for the inverter). Average quoted costs for systems of other sizes are below. The net cost to customers—post-RECs or subsidies—has been much lower, and in some
17
Under a carbon price, the market, rather than the government, will be making abatement decisions, which will ensure emissions reductions are delivered at lowest cost. The cost of abatement will be lower
3
Based on figures on installed capacity and output from Clean Energy Council 2010 and figures on National Electricity Market registered capacity and output from AER 2009a.
parts of Australia a 1.5 kW system can be as low as $2,300 (Green Energy Markets 2010).
Total system costs are expected to fall around 10 per cent over the next year, and then decline around 7 per cent each year to 2013 (Green Energy Markets 2010).
Government rebates and market-based support have made solar PV systems more competitive with other forms of residential electricity supply. From the beginning of 2000 to mid-2010, around $879 million (real 2009 dollars) in Australian Government rebates supported the installation of almost 108,000 systems, with a combined installed capacity of 128MW (Macintosh and Wilkinson 2010). Evaluations have concluded that these subsidies have effectively driven the deployment of solar PV. In terms of energy and emissions reductions, the approach has been costly. The public subsidy cost per tonne of greenhouse gas emissions abated through rebated PV systems is estimated at between $257 and $447 per tonne carbon dioxide equivalent—far above the carbon prices being considered under any proposed model (Macintosh and Wilkinson 2010; ANAO 2010). This cost is not the same as the economic costs of PV systems, which are much lower. Despite the growth of PV in Australia, its impact on electricity demand remains modest. In late 2010, installed PV systems accounted for 0.6 per cent of installed electricity generation capacity, and around 0.2 per cent of 2009-10 output in the National
Electricity Market.3
Figure 8: Typical Output from 1 kW of grid
‐
connected PV, installed at the
appropriate orientation and inclination
The output of a system is not simply its rated capacity; actual output a system varies with the amount of solar radiation, a changing temperature and other factors. The typical annual output from 1kW of network connected photovoltaic is illustrated below.
Source:Australian PV Association 2009.
The impact of solar PV on peak demand is even less significant. Studies suggest that the contribution to residential peak demand is limited, because PV output peaks around 1.00pm and output from solar PV is greatly reduced by the later afternoon (Energy Australia 2005). In New South Wales, for example, average output at 5pm is less than 15 per cent of the system capacity (AECOM 2010). This is due partly to the inverse relationship between maximum power and cell temperature (Myers et al 2010).
than the existing climate change policies discussed in Section 2.1, and the overall impact on prices will be more modest than the cumulative impact of existing policies in the future.
With a carbon price in place, current climate change mitigation policies would not be a cost-effective way to reduce emissions. Most, including the Renewable Energy Target and support for household photovoltaics, should be phased out. The deployment of smart meters is an important exception; smart meters, properly used, will complement a carbon price and increase its effectiveness (see Section 5).
3. The risks to energy security in the transition to a low
carbon electricity sector
3.1 The transition in electricity generation
Reforms associated with the creation of the National Electricity Market have created a wholesale electricity market in Eastern Australia that is well placed to deal with the change in relative prices that will flow from a carbon price.
A carbon price will change the relative costs of different sources of generation according to the
emissions intensity of each.4
The open market for generation capacity will allow new lower-emissions generators to enter the market, according to the price signals, if it is profitable to do so. The dynamics of the National Electricity Market are well established and since its formation, large private investments have been made in new generation capacity to meet our growing energy needs. The market will continue to encourage investment in new generation capacity to meet growth in demand. A recent assessment says that installed and committed generation capacity across the National Electricity Market will be adequate until 2013-14 to meet peak demand projections and reliability requirements, with new generation required after that (AEMO 2010b).
The flexibility of the electricity market allows wholesale prices to adjust quickly to reflect these changes. Most of the carbon price costs will be passed through to consumers. Some generators will find that revenues will rise more than costs. The most emissions-intensive will find that costs rise much more than revenues. Companies with a portfolio of generation assets that is balanced across emissions intensity will neither be big winners or big losers.
As long as the rules of the carbon pricing policy are clear, private investors will be able to form judgements on the amount of investment in low-emissions generation that is warranted. As with any market, there will be some commercial risk. Just as the uncertainty around forward gas prices affects decisions to build gas driven peaking plants today, uncertainty around forward carbon prices beyond the fixed price period will also be factored into such decisions.
The comparative advantage of different forms of generation will depend on a range of factors, of which
a carbon price is but one5
The transformation of the electricity sector that is likely to be required has been apparent for some time, and became clearer when there was bipartisan support for a price on carbon following the Shergold Report on emissions trading in mid 2007. Some of the largest and most successful firms in the Australian market have since taken steps to minimise the impact of the transition, and uncertainty surrounding it, through diversification in their generation portfolio and vertical integration to manage the risks between generation and retail operations.
.
4
With a carbon price, the cost of emissions intensive forms of generation like coal will rise relative to those that rely on lower emissions fuels, in particular gas. Zero emissions sources like wind will not incur an increase in costs.
5
Other relevant factors include the relativities between different fuels, the cost of capital, demand projections, and the likely behaviour of current players and future competitors.
19
The impact of carbon price uncertainty on investment decisions
While there has been a stable investment environment since the National Electricity Market’s inception in 1999, more recent debate over domestic climate change policy, particularly the potential introduction of a carbon price, has created uncertainty for investment in generation capacity.
Both existing and potential new investors suggest that they are encountering difficulties in implementing plans to sustain value in existing generation assets, or to finalise decisions on projects for new capacity. The majority of recent investment has been in gas-fired generation—due largely to the need for peaking plant, as the current generation profile is weighted towards baseload generation (AER 2010a). This has been in an environment of oversupply and low prices for baseload capacity as supply constraints associated with drought have lifted and demand has grown slowly.
Recent analyses have highlighted the possibility that carbon price policy uncertainty may lead to investment in a suboptimal future mix of generation capacity (Nelson et al. 2010; Frontier Economics 2010). In the current environment, investment in coal-fired power, despite being the lowest cost form of baseload generation, is unlikely given its high emissions intensity and subsequent exposure under a future carbon price.
At the same time, investors report difficulties in securing project finance for baseload and intermediate thermal alternatives to coal (Nelson et al. 2010). Investors are minimising risk and therefore capital costs by investing in Open Cycle Gas Turbine technology to meet demand, rather than Combined Cycle Gas technology, which could be optimal under a carbon price. It is worth noting that investors have recently been selecting open cycle gas models that can be quickly adjusted to combined cycle operations (see Origin 2011).
The electricity transformation
Modelling of the electricity sector provides an indication of a possible future mix of types of generation. There are three broad trends that can be expected with the introduction of a carbon price. First, there is likely to be an initial increase in gas generation—gas is likely to displace coal through changes in the intensity of use of current plants at relatively low carbon prices. However, if gas prices rise in Eastern Australia (in line with the expectation that prices will increase towards export parity with the development of an export industry on the East Coast) then the increase in gas generation may be temporarily delayed. The recent experience with high gas prices and the current cost-competitiveness of coal in Western Australia—even with a carbon price around the levels suggested for the early years
in Update Paper six (Carbon pricing and reducing Australia’s emissions)—is an example of the dynamic
possibilities that can emerge in a competitive market.
As the carbon price rises with time, and as the costs of newer technologies fall with research, development and experience, less emissions intensive forms of generation will become competitive. The extent of the change after movement to emissions reduction targets and a floating carbon price will depend on the cost of abatement elsewhere in the economy. With the emergence of credible international markets for abatement, the balance between domestic and international reductions in emissions will be determined by factors affecting costs of abatement in Australia and abroad.
As new generators enter the market, supply from more emissions intensive generators will be gradually displaced. As new low-emissions generators enter the market, existing emissions intensive generators can be expected gradually to reduce output.
The Update examined closely the options for emissions-intensive baseload generators to operate flexibly to generate value as the carbon price increases. Within economic limits, there is considerable scope for flexibility. Recent analysis commissioned by the Update has confirmed that even for older brown coal facilities such as Hazelwood and Yallourn in the Latrobe Valley, it is possible for generators
to operate intermittently in the summer months to meet demand on hot days (Box 4). In some circumstances these facilities could operate profitably by selling into the market when prices are high.
The figures below use two scenarios from the recent modelling results by the Australian Energy Market Operator to illustrate the general story of the switch to gas, the opening of new low-emissions generation and the closure of older emissions intensive generation over time. Figure 9 is based on what
the Australian Energy Market Operator characterises as an ‘uncertain world’. The ‘uncertain world’
scenario assumes a 5 per cent emissions reduction target, high economic growth, no available geothermal generation, and low hydro inflows. This scenario shows the highest installation of gas powered generation due to the exclusion of geothermal, lowered access to hydro, and the introduction of a carbon price. The low value of carbon does not provide significant motivation to promote retirements, especially when coupled with the high demand, and therefore emissions remain relatively high.
At the other end of the spectrum, Figure 10 is based on the Australian Energy Market Operator’s ‘fast rate of change’ scenario. The ‘fast rate of change’ scenario assumes high economic growth and a 25 per cent emissions reduction target. This scenario shows significant new base load gas and coal fired generation that makes use of carbon capture and storage technology. The high carbon price results in major capacity retirements, and a substantial level of new renewable generation, particularly wind.
Box 4: A non-baseload future for brown coal-fired generators
The Update commissioned Sinclair Knight Merz to evaluate the potential for brown coal-fired generators to operate in a non-baseload capacity in the future. The report found that for the Hazelwood and Yallourn facilities, there are no known technical reasons which would prevent the facilities operating in non-baseload capacity—that is, limiting operations to when demand is likely to be high in summer. The report confirmed that these plants:
• can be completely shut down for a number of months in a year;
• can be recalled from a state of complete shutdown in approximately two weeks;
• can operate intermittently for several days at a time on a relatively short recall period of about
three days—a shorter recall period of less than three days could be achieved at added expense; and
• the total maintenance costs would be much lower under such a regime because the plant
overall will run less.
More complex staffing arrangements would be required.
This analysis confirms the technical viability of coal-fired baseload plants operating as a plant with intermittent production—as coal-based plants do overseas and have done in the past in Australia.
21
Figure 9: ‘Uncertain World’ scenario
Figure 10: ‘Fast Rate of Change’ scenario
M eg aw at ts o f ca pa ci ty Source: AEMO (2010).
3.2 The economics of brown coal generators
The introduction of a carbon price will lower the profitability of the most emissions intensive electricity generators. The most emission intensive generators in Australia are the brown coal generators located in Victoria and to a lesser extent South Australia. These generators are large contributors to baseload generation, and this role will be affected for at least some plants during the transformation to lower emissions generation.
Industry analysts suggest there is evidence of some brown coal generators being in precarious financial positions even before the introduction of a carbon price. The industry estimates that over the next five years $9.4 billion in debt on generation assets will need to be refinanced (ESAA 2010). Approximately $6 to $7 billion of debt held by the high-emissions generators in the South Eastern states.
Part of the increase in costs from carbon pricing will be recouped by passing through the price increases to electricity users. It is not possible to say in advance what proportion of the cost increases will be passed on. This is the source of community concern about electricity price increases. For generators as a whole, most of the carbon costs are likely to be recouped from price increases. Community concern for higher prices is the reciprocal of generator concern that they will not be able to pass through costs: in the final outcome, more pass through of costs will ease adjustment pressure on generators and intensify pressure on consumers. Even with high pass-through of costs, as is likely, the introduction of a carbon price will adversely affect the financial position of the most emission intensive generators—those that use brown coal in generation.
When the consequences of changes in cash flows and adjustments to them are worked through in detail, there are financial difficulties for firms to manage, but the risks to physical energy security are
low—if not negligible. The National Electricity Market is self-correcting in terms of physical supplies;6
6
When the system is at the point of shedding load, the price must be set at the price cap of $12,500/MWh. Or, after the equivalent of 7.5 hours of price cap in a week, an administrative price cap applies of $300/MWh.
prices will rise to justify retaining capacity if the alternative is unmet demand. Furthermore, like all dynamic markets, any reduction in supply by one producer will lead to an increase in prices which subsequently increases the profit margin for all other producers. The most emissions intensive plants in each region are likely to be the first to start to reduce their output and this will drive an increase in non-peak wholesale electricity prices. The owners of the next-most emissions intensive generators in a National Electricity Market region will benefit from these higher prices, and thereby be more likely to remain capable of servicing debt and generating a return to shareholders (DCC 2009).
As in any effective market, prices and expectations of future prices will rise to keep supplies in line with demand and expectations of demand. The owners of even the most emissions-intensive physical generation asset will have an incentive to meet demand at lower output levels, possibly in an intermittent capacity, for as long as there is physical demand for the output at the prices that emerge from the market.
So long as there is a mode of operation at which revenues exceed recurrent costs, the owners of and lenders to emissions-intensive generators have incentives to continue profitable physical operations, the honouring of existing contracts with retailers, and an ability to sell new contracts. This will ensure that the current owners and lenders extract the maximum value from the plant, whatever its future role may be in the market.
Many people in Australia, including many in business leadership roles, distrust markets. They fear that market outcomes will be seriously disruptive, and dislike the uncertainty with which market outcomes are associated. There is a deep Australian yearning for the certainties of controls and subsidies. However, while markets are imperfect, the general experience is that they are more effective than any other mechanisms for ensuring that supply is available reliably to meet demand. I see no reason why the electricity market is different from others.
The recent experience with the parent of a generator may be reassuring to those who doubt the capacity of markets. The collapse of Babcock and Brown did not stop Babcock and Brown Power (now Alinta) from operating in the National Electricity Market.
Analyses of generator viability that do not take into account electricity market dynamics will produce a distorted picture of the internal economics and stability of the market. See for example, the Department of Climate Change’s analysis of the Morgan Stanley study undertaken for the Government in 2009 (DCC 2009). It is important to recognise the capacity for generators to move from baseload to intermittent generation when it is profitable to do so. It is essential to recognise that contraction in supply in one plant will increase prices, revenue and profitability in others.
Analysis of market dynamics reveals that the unconditional grant of free permits to generators does not affect any of the influences on profitability and therefore on any of the decisions that will actually determine whether established plants continue to produce power or whether there will be investment in new capacity. On the other hand, conditional grants would distort the adjustment.
3.3 Potential risks to energy security
In the debate around generator compensation, three types of risks have been commonly cited as threats to energy security. The materiality of these risks has not been thoroughly analysed in earlier Australian discussion of carbon pricing.
The question is whether the introduction of a carbon price will threaten the security of energy supply. Past discussion has tended to confuse this concern with other issues.
If there is a lack of clarity around the energy security concern, this will undermine the identification of a logical least-cost means of resolving the concern. In the discussion below, I conclude that two out of the three commonly cited risks are legitimate and warrant a cost-effective government response.
The risk of contract market contagion
While there is an active and responsive physical spot market, transactions for electricity are primarily traded on contract markets. The many participants in the National Electricity Market have opaque contractual relationships. Retailers contract for supply in the event of high demand and thereby avoid the impact of high spot prices. With increased vertical integration, it is likely that the contract market has shrunk in recent years, but the full extent of commitments among parties is unknown.
23
There is some anxiety that a financial market or contract market shock or sudden unexpected change in input prices or natural disaster or strike could lead to financial contagion, irrational behaviour and threats to energy market stability. The anxiety extends to the financial shock that could come from a participant being insufficiently prepared for the consequences of a carbon price.
If the firm operating a large and emission intensive generator were unable to meet financial obligations as they were due, it may be unable to reach a mutually acceptable agreement in the timeframes available. As a result, the generator would be unable to honour existing hedge contracts to retailers at a time of high spot prices. This unlikely event could trigger a financial contagion precipitating instability within the industry.
It is worth noting that such an occurrence could arise due to circumstances unrelated to the introduction of a carbon price. For example, the worst possible case of contagion risk could have been realised in the Great Crash of 2008 when the operating company of Babcock and Brown Power (now Alinta) collapsed. In that instance, the owners and lenders were able successfully to restructure their financial arrangements over an extended period of time.
There is no established mechanism within the National Electricity Market to deal with contract market instability. This is unlike regulatory arrangements in other markets, notably financial markets, in which large and negative consequences are anticipated from the failure of large firms (‘too big to fail’). The electricity market is another area in which a major firm may be thought by some to be too big to fail. The enhancement of regulatory protections in this area is warranted. However, in line with understanding of best practice in the aftermath of the Great Crash of 2008, it is important that being “too big to fail” does not protect shareholders in large enterprises from the financial consequences of changes in the business environment. The purpose of protective regulatory arrangements is to enhance the wider community interest. Any protective measures should secure the community interest in market coherence at the least possible costs to the community.
The prospect of suboptimal maintenance of generation assets
Some electricity sector stakeholders have suggested that energy security or reliability concerns may arise from weak incentives for firms adequately to invest in maintenance as they approach the end of
economic life.7
These circumstances could possibly arise with the introduction of a carbon price although, as I have indicated above, it is unlikely. To the extent that the concern is valid, it is more general. The same concern could arise independently of a carbon price, as a number of large baseload generation assets approach the end of their economic lives in the coming decades and are vulnerable to the financial stress of an owner. The Australian electricity market has never yet had to deal with large amounts of capacity being withdrawn from the market, with small plants being replaced by larger plants. The market has a number of ageing assets and in the future large plants would need to be replaced, thus raising issues around smooth transition.
It is feared is that this could lead to sudden decommissioning of all or part of a major plant and to disruption of supply. If the only available replacement before new capacity comes online— perhaps the more intensive use of a plant designed for peaking—is higher cost generation, this could result in sustained periods of higher wholesale prices.
There would be value in removing these concerns by augmenting the regulatory framework to deal with the increased risks of supply disruptions as plants approach their end of life. However, the incentives to minimise operating expenditure and delay capital expenditure on maintenance will be balanced by market incentives to continue profitable operations. Plants which cut back on maintenance levels will face higher rates of disruption, which will in turn reduce their ability to carry long-term contracts (the
7
Faced with large maintenance outlays and limited prospects for future revenue, owners will rationally cut back on maintenance and accept a higher risk of outage which will be traded off against the value of peak capacity. This is an intended outcome.
primary source of commercial value for all generators). Given the market incentives to undertake the appropriate level of maintenance, a light handed regulatory approach is preferred in the first instance.
Investment in new capacity
I explained in 2008 that the impact of government carbon pricing policy on the value of assets (also
known as asset impairment) is not an issue in and of itself.8
The provision of capital grants to generators will not affect the incentives that drive electricity prices or investment decisions. Markets are well equipped to manage the financial stress of one or more participants.
In consultations with the Update, generators have focussed less on demands for capital grants than they did in consultations for the 2008 Review, and have focussed more on requests for government to pay for closure of high-emissions plants. Some have argued that plant retirements should occur with ‘reasonable periods of warning’ so that replacement plant could be planned and constructed (ACIL Tasman 2011). This is predicated on the assumption that otherwise plants will leave the market abruptly, leaving a shortfall in unmet demand. This is not how dynamic markets like the National Electricity Market work—nor the way that global markets for commodities or industrial goods work. While the ownership and financial arrangements of a plant may change, the plant will continue producing—perhaps with gradual reduction in output over time—while it is profitable to do so. This means that the plant will continue in operation until ceases to be required to meet demand at prices that are expected to clear the market.
If there happens to be a low appetite for capital investment in Australian electricity generation, the wholesale price of electricity will rise accordingly. This is a predictable and ‘bankable’ feature of the National Electricity Market which private investors will anticipate. In the end, the market might commence new generation a bit early or a bit late—during which prices may be temporarily depressed or inflated. This is normal for markets. In the electricity market too, imbalances between supply and demand will lead to changes in prices and expected prices which lead to adjustments that move supply and demand back into balance. It is incumbent upon those who argue that the electricity market cannot be trusted to bring supply and demand into balance, to show analytically how the electricity market is different.
8
In the same way that government is not expected to attempt to extract the gains from policy change, industry should also not expect government to socialise the losses in the case of electricity generation assets. There have been times in the past , unhappy for Australian economic performance, when there was an expectation that Government would socialise losses but not gains from policy and other changes. There have been elements of this approach in the recent discussion: calls for compensation of losses from carbon pricing have not been accompanied by suggestions that these should be paid for by levies on gains for low-emissions producers generated by the same changes.
Box 5: Emergence of electricity generation-retail integration and competition policy
The original design of the National Electricity Market was based on structural separation of generators from retailers, but in recent times there has been a clear trend towards the emergence of generator-retailer businesses — starting with AGL’s purchase of a stake in Victorian Power Station Loy Yang A in 2004. Vertical integration allows retailers to manage generator risks internally and reduce transaction costs, but can also undermine market competition, particularly if there is a loss of liquidity in contract markets. This has been observed in New Zealand where dominant regional generator-retailers have emerged and reduced the prospects for retail only businesses (Willet 2008).The successful purchase of New South Wales retail businesses and generator output by two of the three large generator-retailers (TRUenergy and Origin) has resulted in further market concentration. The potential for anti-competitive behaviour in these circumstances has been investigated by the