Decoding Inside Information
The Harvard community has made this
article openly available. Please share how
this access benefits you. Your story matters
Citation COHEN, LAUREN, CHRISTOPHER MALLOY, and LUKASZ POMORSKI. 2012. “Decoding Inside Information.” The Journal of Finance 67 (3) (May 21): 1009–1043. Portico. doi:10.1111/ j.1540-6261.2012.01740.x. .
Citable link http://nrs.harvard.edu/urn-3:HUL.InstRepos:33785679 Terms of Use This article was downloaded from Harvard University’s DASH
repository, and is made available under the terms and conditions applicable to Open Access Policy Articles, as set forth at http:// nrs.harvard.edu/urn-3:HUL.InstRepos:dash.current.terms-of-use#OAP
Decoding Inside Information — Page 1
Decoding Inside Information
LAUREN COHEN, CHRISTOPHER MALLOY, and LUKASZ POMORSKI*
ABSTRACT
Exploiting the fact that insiders trade for a variety of reasons, we show that there is predictable, identifiable “routine” insider trading that is not informative for the future of firms. A portfolio strategy that focuses solely on the remaining “opportunistic” traders yields value-weighted abnormal returns of 82 basis points per month, while abnormal returns associated with routine traders are essentially zero. The most informed opportunistic traders are local, non-executive insiders from geographically concentrated, poorly governed firms. Opportunistic traders are significantly more likely to have SEC enforcement action taken against them, and reduce trading following waves of SEC insider trading enforcement.
JEL Classification: Insider trading, information flow, asset prices Key words: G12, G14, G18
* Cohen and Malloy are at the Harvard Business School and NBER; Pomorski is at the University of Toronto. We would like to thank Dan Bergstresser, Sabrina Buti, John Campbell, Jeff Coles, Josh Coval, Chuck Dale, Craig Doidge, Esther Eiling, Ben Esty, Fritz Foley, Cam Harvey, Harold Hau, Inigo Fraser-Jenkins, Julian Franks, Robin Greenwood, Raymond Kan, Inmoo Lee, Jan Mahrt-Smith, Jennifer Marietta-Westberg, Jacob Oded, Jeff Pontiff, Bryan Routledge, Nejat Seyhun, Tao Shu, Rick Sias, Sunil Wahal, Jason Wei, the Associate Editor, an anonymous referee, and seminar participants at the United States Securities and Exchange Commission (SEC), AQR Capital, Arrowstreet Capital, Binghamton, Dartmouth University, Harvard Business School, University of Missouri, the Canada Pension Plan Investment Board, the Chicago Quantitative Alliance Annual Fall Conference, the China International Conference, the Center for Research in Securities Prices (CRSP) Forum, the European Finance Association Meeting in Frankfurt, the Inquire UK Conference in Cambridge, the Rothschild Caesarea Center 7th Annual Conference, Universidad Autonoma de Barcelona, and the Western Finance Association Meeting in Victoria for helpful comments and suggestions. We thank David Kim for outstanding research assistance, and we are grateful to Diego Garcia and Oyvind Norli for providing data on geographic locations of firm operations. We gratefully acknowledge funding from the National Science Foundation. We are also grateful for funding from INQUIRE UK. This article represents the views of the authors and not of INQUIRE.
Decoding Inside Information — Page 2
Investors and regulators share a common challenge: how to sift through the multitude of information events that bombard securities markets each day, and determine which events contain viable information, and which do not. Investors in these markets must ascertain which of these events, and what parts of their contents, have insight into firm value. Regulators, on the other hand, must work to ensure that information flow in the capital markets is "timely, comprehensive and accurate."1
A class of information events that is especially difficult to decipher is the trading activity of corporate insiders. Insiders are a unique class of traders as they, by definition, have favored access to private information about the given firm. Because of this preferential access, insiders are subject to increased scrutiny, regulation, and restrictions regarding their trading activities.
Another unique aspect of insiders is that they often receive a large proportion of their stakes in firms through non-market transactions (e.g. stock grants). Through initial ownership, stock grants, and other market transactions, insiders’ firm stockholdings are often a non-trivial percentage of their wealth. Thus personal liquidity and diversification motives, in addition to signaling and regulatory issues, will affect the timing and nature of insider trades, making it more difficult for investors to interpret any given insider trade as informative or not.
The detection of illegal insider trading, meanwhile, presents an even higher hurdle: the U.S. Securities and Exchange Commission (SEC) must demonstrate that a person "trades a security while in possession of material nonpublic information in
Decoding Inside Information — Page 3
violation of a duty to withhold the information or refrain from trading."2 The rash of high-profile insider trading cases in recent years, notably the government’s investigation into the Galleon Group in late 2009--the largest hedge fund insider trading case in U.S. history--indicates that the SEC continues to expend substantial resources trying to address this difficult problem.
In this paper we provide a new framework for thinking about detection and information flow in the capital markets. Using a simple, novel approach, we decode whether there is likely to be information in a given insider’s trades. In doing so, we show that there is predictable, identifiable “routine” insider trading that is not informative for the future of firms. Classifying trading in this way allows us to strip away these uninformative signals, leaving a set of information-rich trades by “opportunistic” insiders that contain all of the predictive power in the insider universe.
Our analysis rests on the simple idea that insiders, while possessing private information, trade for many reasons. For example, routine sells by insiders are commonplace in the market, and can be driven by diversification or liquidity reasons, with the insider wanting to signal that he is not trading on information about the firm (e.g., Bill Gates, who trades in a pre-announced, routine fashion). Routine buys, on the other hand, may occur after an insider receives a bonus; since bonuses are often paid out in the same month each year, and since insiders often receive discount plans on their company stock (and hence are more likely to buy the stock), insider buying in the same calendar month is common and often uninformative. Thus, if one can classify ex-ante
Decoding Inside Information — Page 4
those traders who make routine (and so less informative) trades, one can better identify the true information that insiders contain and thus develop a richer understanding of firm-level asset prices.
To better understand our approach, consider the following example from our sample.3 ABC Inc. is a large, publicly traded firm, which in 1997 operated in all 50 states, and in over 40 countries worldwide. The firm had a number of insiders. In particular, two of these insiders, Mr. Smith and Mr. Johnson (both board members), were actively trading over their times at ABC Inc., but in starkly different ways. Mr. Smith had been trading in every April in the years prior to 1997, and in 1997 he again put on his usual April trade. Mr. Johnson, in contrast, had been active over the same period, but had no patterns in his trading, trading some years in March, some years in August, some years in September, etc. Further, they had quite different returns to their insider trading.
Looking deeper into their trades, following Mr. Smith’s 1997 sale of ABC stock in April, the value of ABC Inc. actually rose in the following month by 3.2% (so a -3.2% return). In contrast, following Mr. Johnson’s sale of ABC stock in December the stock plummeted after the subsequent revelation of two key pieces of news. First, in the following month, when earnings were announced, ABC announced that customer defections remained a problem, and projected that the defections would continue in 1998. ABC’s price dropped over 5% on this news (even though ABC otherwise hit the consensus analysts’ earnings target), then dropped another 2% the following day, for a
Decoding Inside Information — Page 5
2-day drop of over 7%. In addition to this, 8 days following the earnings announcement, it was announced that ABC Inc. was being formally investigated by a large state government for mishandling of numerous dealings it had with the state. In the 2 days following the release of this news, ABC Inc. dropped another 3.5%. The total return of ABC Inc. following the month of Mr. Johnson’s stock sale was -12.6%. We illustrate the returns and events following Mr. Johnson’s trades in Appendix Figure A1.4
Had one taken the simple strategy of replicating Mr. Johnson’s trades (who we term as an “opportunistic insider” throughout the paper), one would have made over 12% in the following month. In contrast, had one replicated the trades of the other insider Mr. Smith (who we term as a “routine insider”, given his usual, routine trading pattern), one would have made -3.2% (since the price of ABC actually rose following his trades).
In this paper we demonstrate that the above example of ABC Inc. represents a much more systematic pattern across the entire universe of corporate insiders and publicly traded firms. We are able to systematically and predictably identify insiders as either opportunistic or routine traders throughout our sample period (1986-2007). Further, our classification scheme essentially divides the insider trading universe in half. We show that the abnormal returns associated with routine traders are essentially zero, indicating that our approach is able to weed out more than half the universe of insider trades, and specifically the half that has no predictive power for future returns or firm
Decoding Inside Information — Page 6
news. Meanwhile, the half that remains contains all of the predictive power in the insider trading universe.
One other interesting aspect of Mr. Smith and Mr. Johnson are their backgrounds. Both of these insiders were directors, sitting on the board of ABC Inc. in 1997. However, Mr. Johnson resided in the same city as ABC Inc., and so was a local insider, while Mr. Smith lived in a completely different state. We show that this characteristic of being geographically ‘local’ is common to the most informed opportunistic traders.
Our empirical strategy for identifying routine traders is simple. For each insider, we analyze her past trading history, and look for consistent patterns in the timing of trades. Specifically, we define a routine trader as an insider who placed a trade in the same calendar month for at least a certain number of years in the past. We then define opportunistic traders as everyone else, i.e. those insiders who have traded in the same years as the routine insiders, but for whom we cannot detect an obvious discernible pattern in the past timing of their trades. We thus designate all insiders as either routine traders or opportunistic traders at the beginning of each calendar year, based on their past history of trades, and then look to see how they trade from that point onwards. While this designation is made at the individual trader-level (i.e., classifying the insider as opportunistic or routine), we also use a trade-level classification (so that the same insider can have both routine and opportunistic trades), and obtain similar results and insights.
Decoding Inside Information — Page 7
We show that focusing only on the trades of opportunistic traders allows us to weed out uninformative signals and identify a set of information-rich trades that are powerful predictors of future firm returns, news, and events. In addition, we provide insight into exactly what kind of information these opportunistic traders are trading on, who these informed opportunistic traders are, and which other market participants are following their trades. Finally, we highlight the links between our opportunistic classification and SEC enforcement activities.
To give an idea of the stark differential in information revealed by these opportunistic vs. routine insiders, a long-short portfolio that exploits solely the trades of opportunistic traders (opportunistic buys minus opportunistic sells) earns value-weighted abnormal returns of 82 basis points per month (9.8 percent annualized,
t=2.15), and equal-weighted abnormal returns of 180 basis points per month (21.6 percent annualized, t=6.07). Meanwhile, a portfolio that mimics the behavior of routine traders (routine buys minus routine sells) earns value-weighted returns of -20 basis points per month (t=-0.57), and equal-weighted returns of only 43 basis points per month (t=1.73). We also demonstrate that an alternate approach for identifying routine trading–focusing on trade-level patterns within a given insider, and thus allowing a given insider to be both routine and opportunistic at different times–yields similar inferences regarding the predictive power of routine versus opportunistic trades. Finally, although our baseline classification procedure requires three years of past trading history in order to categorize a given insider, and hence restricts our main
Decoding Inside Information — Page 8
sample to a subset of the entire insider universe, we find that the “non-classified” trades that we exclude can be grouped into either the opportunistic or routine category without affecting our results; if anything, these non-classified trades appear to more closely resemble opportunistic trades rather than routine trades.
We show that over half of the improvement in predictive power gained by focusing on opportunistic trades comes from the superior performance of opportunistic sells relative to routine sells; this is in contrast to much of the literature (e.g., Jeng et al. (2003)), which generally finds weak evidence on the profitability of insider sales. Further, we find that the returns to these opportunistic trades continue to rise for roughly six months following the opportunistic trading month, and then level off, exhibiting no future reversal. Thus, it appears that the information being conveyed through the trades of opportunistic insiders has lasting implications for firm values.
Importantly, we then examine the drivers of the large information differences revealed by opportunistic vs. routine traders. Specifically, we begin by exploring exactly what firm-level information these opportunistic insiders appear to have the ability to predict. We find that the trades of opportunistic insiders show significant predictive power for future news announcements about the firm, while trades by routine insiders do not. Looking deeper into exactly what kind of news these opportunistic traders predict, we find that opportunistic insiders have statistically significant predictive power for announcement returns around: future analyst recommendations, future analyst earnings forecasts, future management forecasts, and future earnings announcements.
Decoding Inside Information — Page 9
Again, routine traders show no predictive ability for these events.
We next examine the characteristics of these opportunistic traders. We first find that the trades of local non-senior (i.e., not the CEO, CFO, or Chairman of the Board) opportunistic traders have the most predictability for future firm events. We find that these informed local non-senior opportunistic traders share a number of characteristics. First, they tend to have a longer relationship with the firm than the average insider, and so perhaps more time to build a level of (or access to) information about the firm. Second, they are more likely to be from geographically concentrated firms (i.e., firms that have all of their operations in a single state). These may be the exact firms where we might expect a local advantage to be most valuable. Third, they are more likely to be from poorly governed firms, which is consistent with the idea that informative insider trading is more likely to take place where monitoring and institutional controls are weaker. Lastly, they come from firms with more product offerings, suggesting that firms that produce lots of products, many of which may be hard to evaluate from the outside, tend to be places where the marginal benefit of inside information is largest.
We then show links between our opportunistic classification and enforcement actions taken by the SEC. The motivation behind these tests is that one possible way to view our classification scheme is as a systematic way that enforcement officials could examine insider trading, rather than on a case-by-case basis. Indeed, we show two interesting relationships between our classification and SEC enforcement activities. First, our classification scheme correctly identifies many of the high-profile insiders who
Decoding Inside Information — Page 10
were later charged for illegal insider trading as opportunistic traders: e.g., Kenneth Lay (Founder and Chairman of Enron), Jeff Skilling (CEO of Enron), Joseph Nacchio (CEO of Qwest Communications), Victor Menezes (Senior Vice Chairman of Citigroup), and David Willey (CFO of Capital One). In a more systematic way, we find that opportunistic trading significantly increases the likelihood of future SEC enforcement action, while routine trading does not. Second, consistent with the idea that opportunistic traders dampen their trading activity when the potential costs of illegal insider trading increase, we find that the fraction of traders who are opportunistic in a given month is negatively related to the number of recent news releases by the SEC regarding illegal insider trading cases. We also show suggestive evidence that institutional investors have some ability to decipher between the on average informed opportunistic trades and uninformed routine traders. Institutional investors appear to mimic opportunistic trades in the quarter following these trades (but not routine insider trades). They couple this with providing liquidity to the uninformed routine traders in
the contemporaneous quarter (with no such contemporaneous relationship with
opportunistic traders).
Lastly, we perform a variety of robustness checks. First, we show that the intensity of opportunistic trading (both trade-weighting and using number of trades) has significant predictive ability for future returns, while intensity of routine trading shows no such relation. Also we verify that our results are not concentrated in certain types of stocks, or at certain specific times. We show that our main result that
Decoding Inside Information — Page 11
opportunistic trades are more informative than routine trades holds for both large stocks and small stocks, both heavily-traded stocks and lightly-traded stocks, both inside and outside explicit “blackout” periods, and across both the NYSE and NASDAQ stock exchanges.
The remainder of the paper is organized as follows. Section I of the paper provides a brief background and literature review. Section II describes our data on insider transactions, as well as the other data we use in the paper. Section III provides the main results on the performance of opportunistic traders versus routine traders. Section IV explores which information events these opportunistic traders predict, as well as the link between institutional trading and opportunistic trading. Section V investigates which types of opportunistic insiders are the most informed, and the characteristics of these insiders. Section VI examines the response of opportunistic trading to SEC activity, as well as the predictors of SEC investigations. Section VII concludes.
I. The setting
The trades of corporate insiders are among the most widely scrutinized activities in the stock market each day. Regulators, investment managers, media members, and academics continually parse these trades for signs of illicit behavior, and for signals about a company’s future prospects. Not surprisingly, the widespread interest in insider trading has spawned a large empirical literature, most of which examines the cross-sectional return forecasting ability of insider trades aggregated at the firm level. For
Decoding Inside Information — Page 12
example, a large number of papers (see, for example Lorie and Niederhoffer (1968), Jaffe (1974), Seyhun (1986, 1998), Rozeff and Zaman (1988), Lin and Howe (1990), Bettis, Vickery, and Vickery (1997), Lakonishok and Lee (2001), and Marin and Olivier (2008)) focus on the abnormal returns to firms in relation to various metrics of firm-level insider trading frequency over well-defined periods. Seyhun (1998) summarizes this evidence and reports that several different trading rules lead to profits.5 Similarly, Jeng et al. (2003) take a performance-evaluation perspective and find that insider purchases earn abnormal returns of more than 6% per year, while insider sales do not earn significant abnormal returns.
By contrast, our focus is on the individual insiders themselves and their past trading records, and as such our approach tries to isolate predictable variation in the informativeness of insider trades by identifying which insiders are likely to be trading on information and which are not. While numerous papers study the cross-sectional variation of future stock returns as a function of past insider-trading activity, few papers share our micro-level focus on examining the characteristics and trading behavior of individual insiders in order to identify informed trading. A notable exception is Scott and Xu (2004), who attempt to isolate information-driven insider trading and show that shares traded as a percentage of insiders’ holding contains predictive power for future returns. Jenter (2005) also tries to filter out non-informative insider trades by controlling for recent changes in the value of managers’ equity stakes (in order to rule out diversification or rebalancing motives), but finds no predictive power of managers’
Decoding Inside Information — Page 13
insider trades for future returns.
Since a key goal of our paper is also to understand what types of events our opportunistic (i.e., informed) traders predict, our findings are also related to a series of papers, many in the accounting literature, that examine insider trading around/before various types of firm events. For example, with respect to future earnings news, Piotroski and Roulstone (2005) show that insider trades reflect both contrarian beliefs and superior information about future cash flow realizations, while Ke, Huddard and Petroni (2003) demonstrate that insiders trade before significant accounting disclosures as much as two years prior to the disclosure.6 In related work, Kahle (2000) finds that the long-run performance after seasoned equity offerings is significantly related to measures of insider trading, while Clarke, Dunbar, and Kahle (2001) provide evidence consistent with insiders exploiting windows of opportunity by trying to issue overvalued equity. Jagolinzer (2009) provides more evidence of strategic trading by insiders by focusing on a small sample of insiders who publicly disclose 10b5-1 plans (these plans came into existence in late 2000 and permit an insider to pre-specify her buys and sells on a given firm); he finds that insiders initiate sales plans before bad news and terminate sales plans before good performance.7 Note that our evidence in this paper pre-dates the existence of these plans: e.g., we find very similar differential performance of opportunistic versus routine trades before 2000, suggesting that our results are not driven by trades in these plans.
Decoding Inside Information — Page 14
Lastly, since we analyze the link between opportunistic insider trading and institutional trading in this paper, our findings complement prior studies that have explored the connection between insider trades and institutional trades. For example, Sias and Whidbee (2010) find a strong inverse relation between insider trading and institutional demand the same quarter and over the previous year, consistent with the idea that institutional investors are more likely to provide the liquidity necessary for insiders to trade, and that institutions and insiders are attracted to opposite security characteristics. We present suggestive evidence that institutions follow the trades of past opportunistic insider trades (particularly opportunistic buys), and also provide liquidity to contemporaneous routine buys; in doing so we provide added insight into the relation documented in Sias and Whidbee (2010).
II. Data
The data in this study are collected from several sources. Our primary data on insider trades are drawn from the Thomson Reuters insider filings database. Section 16a of the Securities and Exchange Act of 1934 requires that open-market trades by corporate insiders be reported to the Securities and Exchange Commission (SEC) within 10 days after the end of month in which they took place. This 10-day deadline was later changed to a 2-day deadline in 2002. The median delay between trade date and report date over our entire 22 year sample is 3 days.
Decoding Inside Information — Page 15
operations of the firm, all board members, and beneficial owners of more than 10% of a company’s stock. These reports, filed on the SEC’s Form 4, contain information about each insider transaction and about each insider’s relationship to the firm.8 Our data are drawn from these Form 4 filings for the period January, 1986 to December, 2007. Our analysis focuses on open-market purchases and sales by insiders, and hence we exclude options exercises and private transactions. We merge our insider transaction data with firm-level data from CRSP/Compustat, including monthly stock returns, market capitalization figures, and book-to-market ratios.
For our tests involving insider trades before news announcements, we extract headline news data from various newswires using the Factiva web interface. First, we use the CRSP monthly stock name file to identify all company names of CRSP firms between 1989 and 2007. We then select all the Dow Jones Newswires, as well as other newswires, that are available on Factiva. For each stock on the CRSP tape we extract all the news events where the firm’s name (or any of the names if multiple names exist for a given stock) is mentioned in either the headline or in the lead paragraph. We restrict the search to news items in English containing at least 5 words. We exclude republished news and recurring pricing or market data. For every news item we retain the headline, the release date, the release time, the word count and the data source. The final sample includes 2,956,862 headlines for 12,455 stocks between the years 1989 to 2000. The reason we include news data only up to 2000 is that Factiva had a structural break in their indexing system in that year, and hence from 2000 onwards indexed many
Decoding Inside Information — Page 16
fewer firms in the news articles in its data.
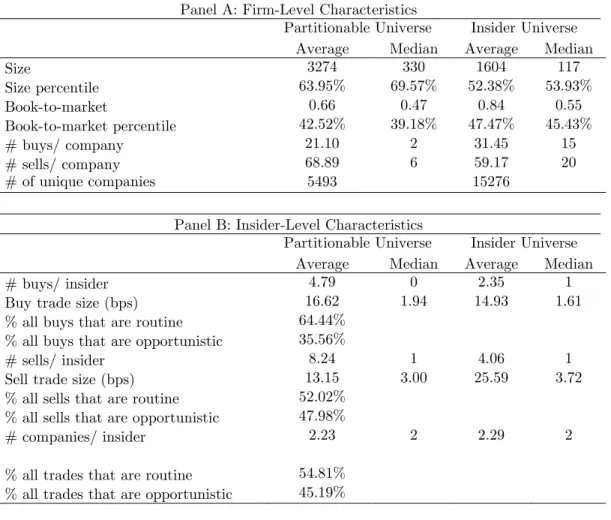
Table I presents summary statistics for our sample. This table presents an overview of the Thomson Reuters insiders database, as well as the subset of the data for which we can define the “routine” and “opportunistic” traders that feature in our analysis. As noted earlier, routine trades are made for a variety of reasons. For example, routine sells by insiders are often driven by diversification or liquidity reasons, with the insider wanting to signal that he is not trading on information about the firm (e.g., Bill Gates). Routine buys, on the other hand, may occur after an insider receives a bonus; since bonuses are generally paid out in the same month each year, and since insiders often receive discount plans on their company stock (and hence are more likely to buy the stock), insider buying in the same calendar month is common and often uninformative.
We require an insider to make at least one trade in each of the three preceding years in order to define her as either an opportunistic or a routine trader. Specifically, we then define a routine trader as an insider who placed a trade in the same calendar month for at least three consecutive years.9 We define opportunistic traders as everyone else, i.e. those insiders for whom we cannot detect an obvious discernible pattern in the past timing of their trades. We thus designate all insiders as either routine traders or opportunistic traders at the beginning of each calendar year, based on their past history of trades, and then look to see how they trade from that point onwards. All subsequent trades that are made after we classify each insider as either routine or opportunistic are
Decoding Inside Information — Page 17
then placed into one of two buckets: a) “routine trades” (i.e., all trades made by routine traders), and b) “opportunistic trades” (i.e., all trades made by opportunistic traders). In Exhibit A1 in the Appendix we provide a series of hypothetical traders by an insider, in order to further illustrate the timing and specifics of our approach.
Note that this simple algorithm for identifying routine buying or selling by insiders is clearly a noisy proxy for actual routine trading; our strategy will not perfectly and correctly classify each and every insider trade. But the essence of our approach is that on average, trades made for information reasons are less likely to be regular in their timing, and trades made for liquidity and diversification reasons are more likely to be regular in their timing. We have experimented with a variety of alternate measures (which yield similar results),10 but these simple measures are sufficient to illustrate our main point. Importantly, as noted above, if we alter our classification scheme in order to exploit trade-level patterns within a given insider--and thus allow a given insider to be both routine and opportunistic at different times--we again find similar results on the relative predictive power of routine versus opportunistic trades; these results are described in Section III.
As an independent verification for our classification scheme of opportunistic vs. routine traders, we examine the trading of the two different types of traders around likely stock grant dates. If we are truly capturing routine trading, it would be good to see this trading being higher around likely stock grant dates. We use fiscal year end dates of firms as this has been shown to be a quite common date for grants (Norton and
Decoding Inside Information — Page 18
Porter (2010)). We find many more routine trades in the quarter following a fiscal year-end compared to opportunistic trades. Specifically, we find that 58% of buys (75% of sells) are routine in the quarter after the fiscal year end, but that only 38% of buys (52% of sells) are routine in other quarters. This finding fits with our simple classification identifying routine trades, as they are significantly more likely to occur during times when regular, non-informative, liquidity-inducing events (such as stock grants) take place.
Table I indicates that by implementing our routine trade identification assumptions (e.g., requiring three years of past insider transactions), our final sample (Partitionable Sample) is about one-third the size of the entire sample of insider transactions.11 Panel A shows that our sample is tilted towards bigger stocks, and slightly towards growth stocks (i.e., lower book-to-market ratios). We can also see this in Figure A2 in the Appendix, which shows that our insider sample has fewer micro-cap stocks (smallest decile) and roughly twice the percentage of largest decile stocks as compared to the CRSP universe. Panel B of Table I shows that the insiders we include in our sample have a somewhat higher average number of trades (4.8 buys to 2.4, and 8.2 sells to 4.1) relative to all insiders.12 All of these differences are statistically significant.
Decoding Inside Information — Page 19
However, we have verified that our sample is representative of the larger universe of all insider trades in terms of the percentage of insider buys and sells (24% buys in the entire sample, 25% in our sample) and in terms of the overall return predictability of insider buys and insider sells. For example, the difference in profitability of a value-weighted long-short portfolio that goes long insider buys and short insider sells, in our sample versus the overall sample, is only 21 basis points per month and is statistically insignificant (t=0.83). Table A2 in the Appendix presents further evidence on the profitability of insider trades, by splitting the insider universe into young versus old companies (where the cutoff for young companies is 3 years since the IPO). Table A2 shows that there is no statistical difference in the profitability of insider trades in young versus old companies; thus we are not imposing any bias in our sample by focusing more often on insider trades made in large companies (that tend to be older). We also show (in Table A3 in the Appendix) that there is no statistical difference in the profitability of "young" versus "old" insiders (where youth is measured by years of trading history for a given insider--"old" insiders are those with more than 3 years of trading history).
We have also directly examined the set of “non-classified” trades, i.e. those trades that do not make it into universe, to check if these trades are systematically different from the trades in our universe. Non-classified trades consist of those insider trades that we cannot classify into either routine or opportunistic trades, since they were made by insiders without three consecutive years of past trading history. When we look at the properties of the entire non-classified universe, we see that these trades
Decoding Inside Information — Page 20
look similar to the trades in our universe. For example, in Appendix Table A4 we show that the returns on a naïve insider mimicking portfolio (buys-sells) in our universe compared to the returns on this same naïve insider mimicking portfolio in the currently non-classified universe are not statistically or economically different from one another. Further, Appendix Table A5 shows that if we run our baseline tests from Table II, but include all non-classified trades in either the opportunistic or routine category, opportunistic trades are still large and significant predictors of future returns, while routine trades are not. If anything, this table indicates that non-classified trades appear to more closely resemble opportunistic trades than routine trades, since the predictability of routine trades slightly improves once the non-classified trades are included in the routine category.
As Table I shows, in our sample we classify roughly 64% of insider purchases and 52% of insider sales as routine trades; hence 36% of insider purchases and 48% of insider sales are classified as opportunistic trades. Overall, trades made by routine traders comprise 55% of the total sample, while trades made by opportunistic traders represent 45% of the total sample.
In Appendix Table A6 we present the full set of correlation coefficients for the main variables that feature in our analysis. To summarize, we find that the number of opportunistic buys, number of opportunistic sells, number of routine buys, and number of routine sells are all essentially uncorrelated with each other. Additionally, the number of insider sells, and particularly routine sells, is higher for larger firms and
Decoding Inside Information — Page 21
growth firms, while the number of insider buys, and particularly opportunistic buys, is higher for smaller firms and value firms. Consistent with the past literature, insiders are contrarian, buying after low past returns (measured over the prior 12 months) and selling after high past returns.
III. Performance of Opportunistic Versus Routine Insiders
In this section we examine the future stock return predictability of corporate insiders. The goal of our approach is to identify, out of the hundreds of thousands of insider trades made each year, which trades are truly informative. To do so we implement our routine vs. opportunistic trader classification, and then analyze the stock return performance of routine versus opportunistic insiders.
A. Baseline Regression Results
Our first tests employ regressions of one-month-ahead stock returns on indicators for routine and opportunistic trades. We run pooled regressions with standard errors clustered at the firm level; we also include month fixed effects where indicated. In addition, we include controls for well-known determinants of stock returns, such as size (log of market capitalization), (log) book-to-market ratio, one-month lagged returns, and cumulative past returns from month t-12 to t-2.
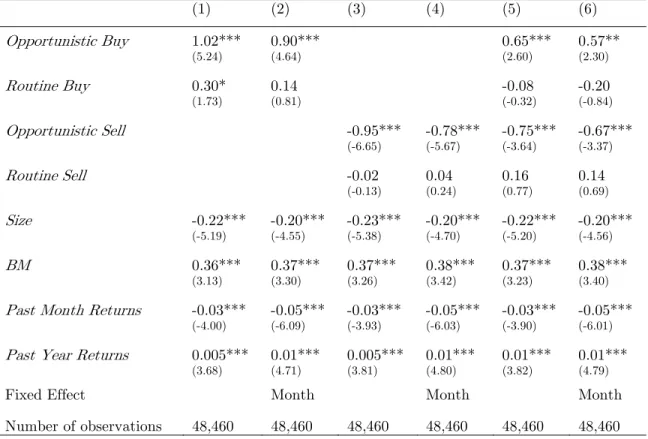
Table II presents these regression results. Columns 2 and 4 illustrate the main result of the paper: both opportunistic buys and opportunistic sells are strong predictors
Decoding Inside Information — Page 22
of future returns, while routine buys and sells are not. For example, the coefficient on opportunistic buys in column 2 indicates that opportunistic buys yield an incremental 90 basis points (t=4.64) in the following month relative to all insider trades. Meanwhile, routine buys yield only 14 additional basis points (t=0.81). The difference in the coefficients on opportunistic buys and routine buys (=76 basis points) is statistically significant (F-test=10.07, p-value=0.002).13 The results for sells are similar: Column 4 shows that opportunistic sells earn an additional -78 basis points (t=5.67), while routine sells earn +4 additional basis points (t=0.24). Again, this difference between opportunistic sells and routine sells is large (=-82 basis points) and statistically significant (F-test=29.30, p-value=0.000).
Columns 5 and 6 of Table II present similar results, but with all four dummy variables (Opportunistic Buy, Routine Buy, Opportunistic Sell, Routine Sell) included in the same regression. Consistent with the results in Columns 1-6, these tests indicate that opportunistic trades are informative for future returns, while routine trades are not. In Column 6, the difference in coefficients between opportunistic buys and routine buys is 77 basis points (F-tests=10.32, p-value=0.001), and the difference in coefficients between opportunistic sells and routine sells is 81 basis points (F-test=28.87, p-value=0.000).
Decoding Inside Information — Page 23
Overall, the combined differences in the coefficients between opportunistic trades and routine trades in Table II translate into an increase of 158 basis points per month in the predictive ability of opportunistic trades relative to routine trades.14 Additionally, our results demonstrate that over half the improvement in predictive power gained by focusing on opportunistic trades comes from the superior performance of opportunistic sells relative to routine sells; as noted earlier, this is in contrast to much of the literature (e.g., Jeng et al. (2003)), which often struggles to find evidence that insider sales predict lower future returns.
B. Trade-Level Results
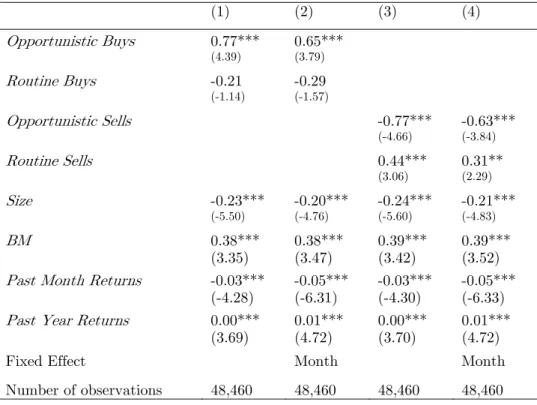
Next we investigate an alternate, trade-level measure of "routine" and "opportunistic," as opposed to the trader-level measure used so far. This measure allows a given trader to have both routine and opportunistic trades; e.g., a given trader may be dubbed routine after having three straight January trades, but in this alternate setup we only dub his subsequent January trades as routine trades, and categorize his trades in all other months as opportunistic. And also, an opportunistic trader can have routine trades if he establishes a routine in any given calendar month.
We present these trade-level results in Table III. Column 2 shows that the spread between opportunistic and routine buys using this trade-level measure (analog of Column 2 in Table II) is again large and significant (=94 basis points, F-test=8.39, p-value=0.0038), while Column 4 indicates that the spread between opportunistic and
Decoding Inside Information — Page 24
routine sells (analog of Column 4 in Table II) is also again large and significant (=94 basis points, F-test=15.99, p-value=0.0001). These results demonstrate that our opportunistic vs. routine identification of informed insider trading is robust to reasonable changes in the classification procedure.
[Insert Table III here]
C. Portfolio Returns
In this section we analyze the returns of portfolios formed according to our routine trade classification scheme. These provide a further test of the predictive ability of opportunistic versus routine trades. To construct our portfolios, we identify opportunistic and routine trades each month, and then form opportunistic buy, opportunistic sell, routine buy, and routine sell portfolios containing these stocks. We then hold these stocks over the month following these insider trades; at the end of the month, we rebalance the portfolios based on new insider trades.
Although the official SEC regulation was a requirement to report by the tenth day of the following month (which was then changed to 2 days after the trade date in 2002), nearly all of the trades in our sample were reported to the SEC within a few days of the trade (median of 3 days over the entire sample), so we are confident they were available at portfolio formation here. Given that the actual required reporting date for insiders was the 10th of the following month until 2002, in the Appendix Table A7 we
Decoding Inside Information — Page 25
re-run all the results from Table II, but this time using returns from the 11th day of month t+1 to the 10th day of month t+2 in our tests (rather than from the 1st day of month t+1 to the last day of month t+1), and the results are virtually identical to those in Table II, meaning that our results are not sensitive to the timing convention we employ here; this finding also demonstrates that our results are fully tradable in real-time.
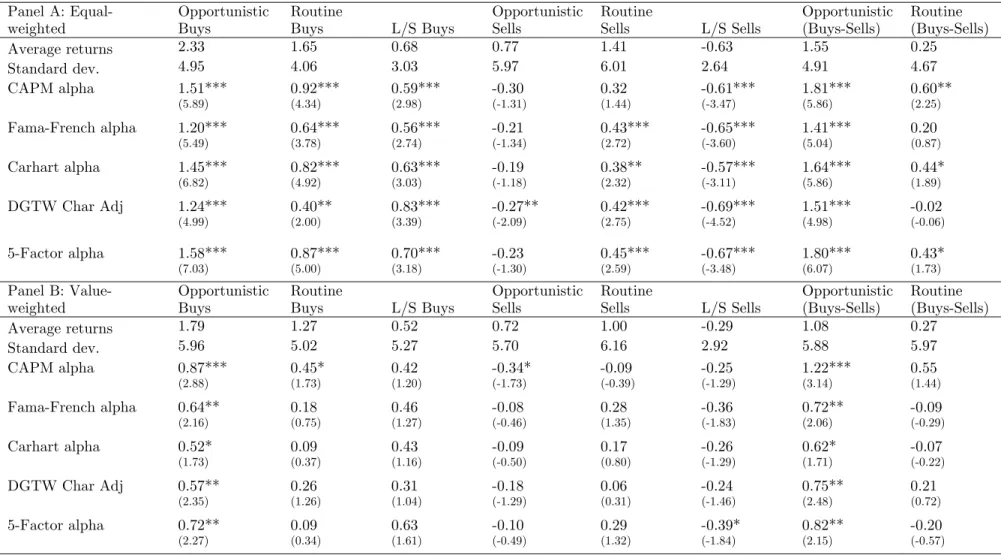
Table IV reports raw portfolio returns, as well as risk-adjusted portfolio returns (alphas) for the CAPM, Fama-French three-factor model, the Carhart (1997) four-factor model, and the five-factor model including a liquidity factor, as well as DGTW characteristic-adjusted returns.15 This table also reports both equal- and value-weighted portfolios. Table IV shows that a portfolio strategy that focuses solely on the trades made by opportunistic traders earns large and significant returns, while a strategy that follows the trades of routine traders does not. For example, the equal-weighted portfolio that goes long opportunistic buys and short opportunistic sells earns a five-factor alpha of 180 basis points per month (t=6.07), or over 21.6% per year, while the portfolio that goes long routine buys and short routine sells earns a only marginally significant 43 basis points per month (t=1.73).
[Insert Table IV here]
Decoding Inside Information — Page 26
While the spread between routine buys and routine sells is actually negative when using value-weighted returns, the spread in five-factor alphas between opportunistic buys and opportunistic sells is a positive and significant 82 basis points per month (t=2.15), or 9.8% per year. Thus our predictability evidence is not limited to smaller firms, as in some prior studies that use insider trading data (see Lakonishok and Lee (2001)).16 Further, these results again demonstrate that all of the return predictability in the insider universe is concentrated within the trades of opportunistic traders.
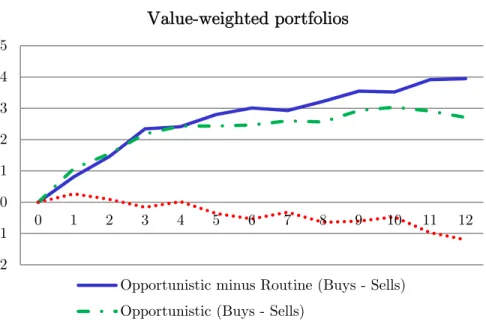
In Figure 1 we plot event-time returns based on the portfolios out to twelve months, to illustrate the longer-term performance of opportunistic trades relative to routine trades. Figure 1 indicates that the twelve-month event-time return on a value-weighted four-leg spread portfolio (=[Opportunistic Buy-Opportunistic Sells]-[Routine Buys-Routine Sells]) is roughly 4%; for the equal-weighted four-leg spread portfolio, the twelve-month event-time return is roughly 8%. In both cases, returns continue to rise for the first six months, and then level off, exhibiting no future reversal. The fact that we see no reversal following the price rise suggests that the information being conveyed through the trades of opportunistic insiders is important for fundamental firm value.
[Insert Figure 1 here]
Taken as a whole, the findings in Table IV and Figure 1 corroborate our earlier regression results, and provide economically and statistically significant evidence that
Decoding Inside Information — Page 27
insider trades by opportunistic traders are much more informative than insider trades by routine traders.
D. Robustness
In this section we perform a series of additional tests in order to evaluate the robustness of our findings. First we investigate the impact that the number of a given type of trade (i.e., the strength of the signal) may convey in terms of incremental information above and beyond the mere knowledge that a particular type of trade took place. These results are reported in Appendix Table A9. We find that the number of opportunistic buys (sells) is a strong predictor of future positive (negative) returns. To get an idea of the magnitude of this effect, a one-standard deviation increase in the log number of opportunistic buys per month translates to higher future returns of 35 basis points per month (t=4.56).17 In contrast, the number of routine buys and the number of routine sells have no relation to future returns.
We also verify that our results are not concentrated on a particular exchange, in certain types of stocks, or at certain specific times. To do so, we examine a variety of subsamples, such as NYSE stocks versus Nasdaq stocks, large stocks versus small stocks, stocks heavily-traded by insiders versus stocks lightly-traded by insiders, and finally trades made only during specific times (such as inside or outside explicit “blackout” windows).
Decoding Inside Information — Page 28
shows that opportunistic buys and sells are strong predictors of future returns for both NYSE and Nasdaq stocks, while routine buys and sells are uninformative across both exchanges. In Appendix Table A11, we find that opportunistic trades (both buys and sells) predict returns for both large stocks and small stocks, while routine trades (both buys and sells) are uninformative for both large and small stocks. To check if insider trading intensity (see Seyhun (1998) and Lakonishok and Lee (2001)) is related to our findings, we split our sample by the fraction of shares outstanding traded by insiders in the prior year for a given stock, and again find that both opportunistic buys and sells are strongly predictive of future returns for both high- and low-intensity stocks.
We also explore if our results are concentrated inside (or outside) explicit “blackout” windows, which are times during which insiders are allegedly prohibited from trading in their company’s stock. Although these windows vary by firm (see Bettis, Coles, and Lemmon (2000)), many firms explicitly allow insider trading solely during the month following a quarterly earnings announcement (e.g., trading days +3 to +24 after an earnings release). Focusing on the post-earnings (+3 to +24) trading window, and also excluding any trades that occur up to 30 days before an M&A announcement, in order to define our “non-blackout” period,18 we find that during both blackout and non-blackout periods, opportunistic buys (and sells) are strong predictors of future returns. In contrast, routine trades (buys and sells) have no predictive power for future returns during either blackout or non-blackout periods. Thus our robustness checks indicate that opportunistic trades are much more informative than routine trades for a
Decoding Inside Information — Page 29
variety of subsamples: NYSE stocks, Nasdaq stocks, large stocks, small stocks, heavily-traded stocks, lightly-heavily-traded stocks, and inside and outside pre-defined blackout windows.
Taken as a whole, our results indicate that opportunistic trades, and the intensity of these trades, are a robust predictor of future returns, while routine trades are not. These findings suggest that the ability to predictably classify insiders into either routine or opportunistic traders, using our simple empirical strategy, allows one to focus in on the half of the insider universe that contains all the informative trades.
IV. What Insiders Predict and Who Mimics Their Trades
In this section we explore the mechanism behind the large return predictability that we observe following opportunistic insider trades, and also explore the link between institutional trading and opportunistic insider trading.
A. Predicting Firm-Level Information Events
We start by examining whether opportunistic traders are more likely than routine traders to trade preceding important information events for the firm. To do so, we run panel regressions of firm-level information events (available from 1989-2000) on the number of opportunistic trades and the number of routine trades. The information events we examine are: headline news events about the firm, sell-side analyst research releases about the firm (i.e., annual and quarterly earnings forecast revisions, as well as
Decoding Inside Information — Page 30
buy/sell recommendation changes), and important management disclosures about the firm (SEO announcements and merger announcements).19 We use the number of firm-level information events in a given category in a given month as our left-hand side variable, and control for the general level of news about the firm on the right-hand side (using, for example, the number of information events last month, and the average number of information events over the prior six months). As in Tables II and III, we also control for firm-level measures of size, book-to-market, and past returns.
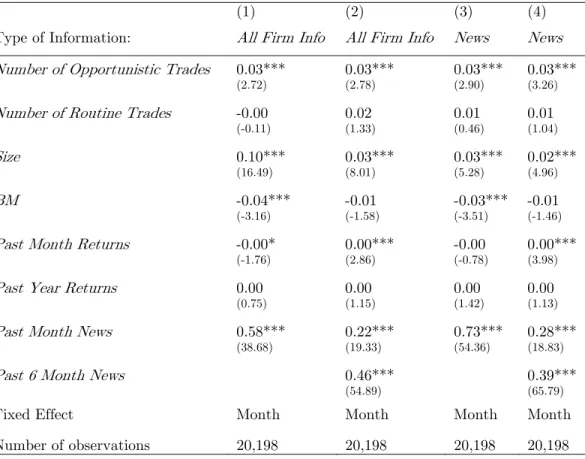
Table V shows that opportunistic trades are predictive of future information events at the insider’s firm, while routine trades are not. This result holds across all information events, holds for a variety of sub-categories, and holds whether or not we control for the general level of news about a firm. For example, in Column 2 of Table V, where we use the sum of all information events as the left-hand side variable, the coefficient on the number of opportunistic trades is positive (=0.03) and significant (t=2.78), while this same coefficient for routine trades is insignificant. To get an idea of the magnitude of this effect, a one-standard deviation increase in the number of opportunistic trades translates into 1.0 more total information events in the following month for the firm; the average number of total information events per firm per month is 4.8 (median=5), so this effect implies a percentage increase of around 20% in the number of important events following these opportunistic trades.
Decoding Inside Information — Page 31
Looking specifically at firm news, Columns 3 and 4 show that opportunistic insider trades are strongly predictive of future headline news events. The coefficient on opportunistic trades in Column 4 (=0.03, t=3.26) implies that for a one-standard deviation move in the number of opportunistic trades, the firm experiences 1.0 more headline news events next month relative to an average of 3.3 events per month (median=3); in percentage terms this translates to a 32% to 35% increase in the number of headline news events. Finally, in the Appendix Table A12 we show that if we split the number of opportunistic insider trades into the number of opportunistic buys and sells separately, both variables predict future news. In fact, Column 6 of Table A12 indicates that opportunistic sells have somewhat more predictive power for future news than opportunistic buys, although both are significant predictors of future news. This provides additional evidence on the power of our classification scheme to identify informative insider sells in particular, in contrast to much of the literature.
B. Predicting Announcement Returns for Specific Types of News Releases
In this section we explore in greater detail the specific types of news events that follow opportunistic trading. Exploring this issue in greater depth gives more insight into the source of insider profitability. To do so, we examine the predictability of opportunistic buys and sells for announcement returns for a series of news categories.
Decoding Inside Information — Page 32
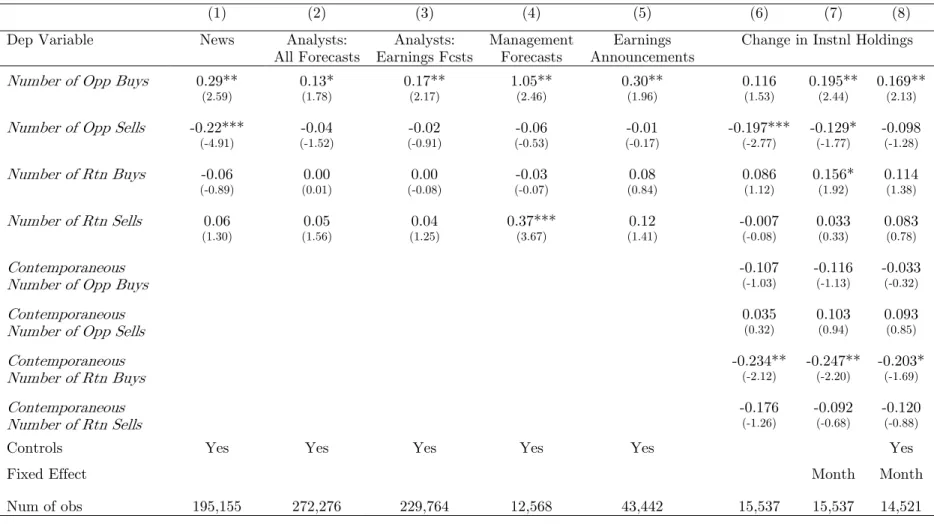
events, as opposed to long-term firm-level measures like annual employment or inventory changes. For example, Table VI reports the results of regressions of announcement returns (from t-1: t+1), for various types of events, on opportunistic and routine insider trades. Focusing first on headline news events as the dependent variable (in Column 1), we see that opportunistic buys in the prior month predict higher news announcement returns (coefficient=0.29, t=2.59), and opportunistic sells in the prior month predict lower news announcement returns (coefficient=-0.22, t=4.11). At the same time, routine buys and routine sells have no predictive power for news announcement returns (and the signs are actually in the opposite direction from the opportunistic trade coefficients).
[Insert Table VI here]
Next we explore specific kinds of news releases, and find that opportunistic trades (primarily opportunistic buys) predict analyst information releases (recommendations + earnings forecasts), analyst earnings forecasts by themselves, management forecasts, and firm-level earnings announcements. Specifically, Columns 2-5 of Table VI show that opportunistic buys in the prior month have statistically significant predictive power for announcement returns around analyst information events (coefficient=0.13, t=1.78), earnings forecasts (coefficient=0.17, t=2.17), management forecasts (coefficient=1.05,
Decoding Inside Information — Page 33
of these regressions, opportunistic sells do not have statistically significant predictive power for future announcement returns, although the signs are all negative. Meanwhile, routine trades are never significant predictors of future announcement returns across all event categories, except in the case of routine sells predicting positive earnings announcement returns.
In untabulated tests we also examine mergers and issuance in this same framework, but find that neither routine trades nor opportunistic trades have predictive power for merger/issuance announcement returns in the following month. And lastly, in addition to these relatively high-frequency announcement return tests, we also examine some annual variables such as employment and inventory changes (drawn from Compustat), finding little evidence that insider trading (by either opportunistic or routine insiders) predicts these lower-frequency, annual variables.
C. The Link Between Institutional Trading and Opportunistic Trading
Our results on the predictive ability of opportunistic insiders’ trades raise the question of whether or not other investors or agents in the financial markets are aware of this type of informed trading. In this section of the paper we explore the connection between institutional trading and opportunistic insider trading, and later in the paper we explore the link between SEC activity and opportunistic insider trading.
To investigate a potential link between institutional trading and opportunistic insider trading, we regress the change in institutional ownership of a stock on the (log of
Decoding Inside Information — Page 34
the) number of opportunistic and routine trades in that stock. We measure the change in institutional ownership at a quarterly frequency, and aggregate up the number of opportunistic/routine trades each quarter as well. We explore both a lagged response (i.e., the impact of opportunistic/routine trades over the past 2 quarters on the change in institutional holdings this quarter), and a contemporaneous response (i.e., the impact of opportunistic/routine trades this quarter on the change in institutional holdings this quarter).
This approach enables us to tackle two questions. The lagged response allows us to answer the following question: do institutions follow the trades of opportunistic insiders in their subsequent trades? And the contemporaneous response allows us to answer a slightly different question: do institutions provide differential liquidity for some types of insider trades relative to others (i.e., are institutions smart enough to provide liquidity only in the case of routine trades). Our tests are similar in spirit to those performed in Sias and Whidbee (2010), who report a strong inverse relation between insider trading and institutional demand in the same quarter and over the previous year.
The last three columns of Table VI present the results of these tests. We find some suggestive evidence on both of the questions posed above. First, we find that institutions do appear to react more strongly to past opportunistic trades than to past routine trades. Past opportunistic buys (sells) predict future increases (decreases) in institutional holdings, meaning that institutions trade in the same direction as past
Decoding Inside Information — Page 35
opportunistic insiders. Further, Column 8 of Table VI shows that the predictive power of opportunistic buys for future holdings is statistically significant even after including controls for size, book-to-market, and previous year returns, as well as date fixed effects (coefficient=0.167, t=2.13). The predictive power of opportunistic sells for future holdings is statistically significant without fixed effects and controls, marginally significant with fixed effects, but not significant with fixed effects and controls (although the sign is still negative). Meanwhile, routine buys predict future increases in institutional holdings, but this result is smaller in magnitude than the predictive power of opportunistic buys, and is not statistically significant with fixed effects and controls included. Column 8 also shows that routine sells predict changes in holdings with the opposite sign (the coefficient is positive); plus the result is not statistically significant. Taken together, these findings provide suggestive evidence that institutions follow opportunistic insiders’ trades (particularly the opportunistic buys) more so than routine insiders’ trades. Thus institutions do appear to have at least some understanding of the differential informativeness of opportunistic versus routine insider trades that we document in this paper.
Second, in looking at the contemporaneous responses (i.e., the impact of opportunistic/routine trades this quarter on the change in institutional holdings this quarter), we find some modest evidence that institutions appear to provide liquidity for routine buys, but not for (or at least less for) opportunistic buys. Specifically, in Columns 6-8 of Table VI the coefficient on contemporaneous routine buys is negative
Decoding Inside Information — Page 36
and significant, but the coefficient on contemporaneous opportunistic buys is insignificant and only slightly negative. Meanwhile the coefficients on both opportunistic sells and routine sells are both insignificant.
Collectively, these tests highlight a potential link between institutional trading and insider trading. While our evidence is only suggestive, our results are consistent with the idea that institutions follow the trades of past opportunistic insider trades (particularly opportunistic buys), and also provide liquidity to contemporaneous routine buys.
V. Which Insiders Are Informed?
Next we explore our basic results in even greater depth by analyzing which types
of opportunistic insiders are especially informed about future news events.
A. Who Predicts News?
To isolate the types of insiders who are most informed, we run predictive regressions of news on various categories of insiders. Specifically, in Table VII we add a series of additional explanatory variables to the specifications from Columns 1-3 of Table V, where we use the total number of information events as our dependent variable. In addition to the number of opportunistic trades, we add independent variables equal to: a) the number of opportunistic trades by local insiders (where local is
Decoding Inside Information — Page 37
defined as residing in the same state as the firm’s corporate headquarters), b) the number of opportunistic trades by senior insiders (where senior is defined as either the CEO, CFO, or Chairman of the Board), c) the number of opportunistic trades by inside/non-independent directors,20 and d) the number of opportunistic trades by outside/independent directors (where independent directors are identified using the “role-code” variable in the Thomson database).21
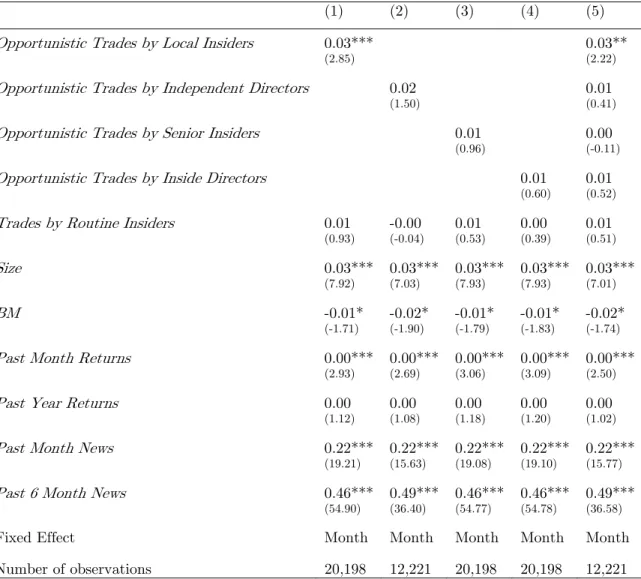
The first column of Table VII indicates that the number of opportunistic trades by local insiders is positively related to the total number of firm-level information events in the following month. The magnitude of the coefficient in Column 1 (=0.03, t=2.85) implies that for a one-standard deviation move in the number of opportunistic trades by locals, the firm experiences 1.0 additional information events next month (so a roughly 20% increase, with an average of 4.8 and median of 5). By contrast, comparing these to the opportunistic trades of the other classes of insiders in Columns 2-4, and especially in the full specification of Column 5, we find no significant difference in the explanatory power between the opportunistic trades of independent directors, senior insiders, or inside directors. Given the evidence in Ravina and Sapienza (2009) that the difference in the profitability of insider trades by executives relative to those by independent directors is quite small, these results may not be surprising. Geographic localness of the opportunistic insider, in contrast, remains a strong, significant predictor.
Decoding Inside Information — Page 38 B. The Characteristics of Informed Insiders
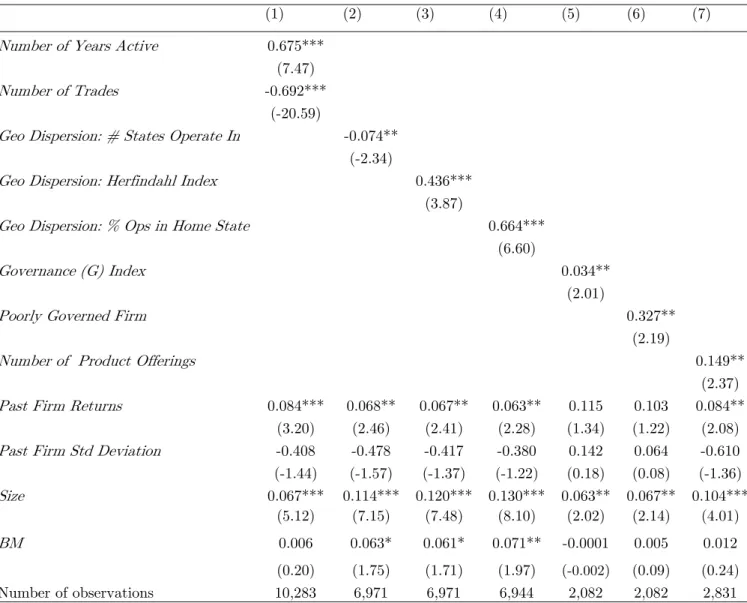
An intriguing finding from Table VII is that it is specifically the local insiders who are not senior management whose opportunistic trades predict future information events. In this section we explore this finding in greater depth to try to better understand the characteristics of these insiders. To do so, we run a logit regression that tries to pinpoint the characteristics of these local non-senior insiders, where the dependent variable equals 1 if the insider in question is a local non-senior opportunistic trader, and where the independent variables are a series of insider- and firm-level characteristics. We explore the following independent variables: a) the tenure of the insider at the given firm, b) firm-level geographic concentration, c) firm-level governance, and d) firm-level products. Insider experience is measured as the (log of the) number of years active as an insider for the given firm. To measure firm-level geographic concentration, we employ three measures using on the dispersion of each firm’s operations across states. Specifically, we use data from Garcia and Norli (2010) on the state-level operations of public firms.22 This data is much more detailed than the Compustat Geographic Segment Data, which only provides coarse segment data on whether or not the firm was completely domestic versus having some segments located internationally. We construct three measures: i) the percentage of sales in a firm’s home (local) state, ii) a geographic Herfindahl index using sales and drawn from this same data, and iii) the (log of the) number of states that the firm has operations in.
Decoding Inside Information — Page 39
We measure firm-level governance using the value of the G-Index from Gompers, Ishii, Metrick (2003). Finally, we compute firm-level products using data from the Compustat segment file, and use the number of products for a given firm in a given year in our regression tests. Note that each insider, and so each independent variable, is defined when the insider is labeled as routine or opportunistic (after the insider trades three years in a row for the first time, in December of the third year with trades).
Table VIII presents the results from these tests. Table VIII indicates that local non-senior opportunistic insiders are more likely to be: a) those with longer tenure at the firm, b) those from more geographically concentrated firms, c) those from poorly governed firms, and d) those from firms that make more products. Specifically, Column 1 shows that the coefficient on log(number of years active) is positive and significant in predicting the likelihood of becoming a local non-senior opportunistic trader. We control for the number of trades in this regression, as we want to isolate the effect of time in the firm, conditional on trading activity of the individual insider (so for two insiders that have traded the same amount, is the one who has had longer to build the firm relationship more likely to be the informed opportunistic insider). Level of trading itself is a negative and significant predictor of being a local non-senior insider who trades opportunistically. This is consistent with routine insiders simply trading every routine period irrespective of information, while these informed local non-senior opportunistic traders trade only when they have valuable information (perhaps not surprisingly, less frequently).23
Decoding Inside Information — Page 40
[Insert Table VIII here]
Columns 2-4 show that for all three measures of geographic concentration, the more geographically concentrated a firm is, the more likely the insider is to be a local non-senior who trades opportunistically. Specifically, Columns 2, 3, and 4 show respectively that: the fewer states a firm operates in, the more geographically concentrated firm operations are, and the larger the percentage of operations in the home (local to the insider) state, the more likely the insider is to be one of these informed local insiders. Next, Columns 5 and 6 show that coming from a poorly governed firm (measured using the value of the G-Index from Gompers, Ishii, Metrick (2003), where larger numbers signify worse governance, and also using a dummy variable equal to 1 if the firm has a G-Index>12–which is the 90th percentile in our sample) is a positive and significant predictor of become a local non-senior opportunistic trader in our sample. Finally, Column 7 indicates that a measure of firm-level products is a positive predictor of the likelihood of becoming a local non-senior insider.
Taken as a whole, our results on the characteristics of these local, non-senior opportunistic insiders are interesting, and intuitive. For example, the idea that one’s tenure at a company would be correlated with one’s level of information about that company is sensible, as is the fact that local non-senior opportunistic traders would be more likely to come from geographically concentrated firms. The product result is
Decoding Inside Information — Page 41
novel, and suggests that firms that produce lots of products, many of which may be hard to evaluate from the outside, tend to be places where the marginal benefit of inside information is largest. And finally, the governance result is consistent with the idea that informative insider trading is more likely to take place where monitoring and institutional controls are weaker.
V. SEC Activity and Opportunistic Insider Trading
As noted earlier, our results on the predictive ability of opportunistic insiders’ trades raise the question of whether or not other agents in the financial markets are aware of this type of informed trading, particularly the key enforcement agency responsible for prosecuting illegal insider trading: the SEC. While we cannot say definitively that our tests pinpoint illegal insider trading, we do note that: a) several high-profile insiders who were later charged by the SEC (e.g., Kenneth Lay (Founder and Chairman of Enron), Jeff Skilling (CEO of Enron), Joseph Nacchio (CEO of Qwest Communications), Victor Menezes (Senior Vice Chairman of Citigroup), and David Willey (CFO of Capital One)) are classified as opportunistic insiders according to our classification scheme, and b) our earlier results that opportunistic trades predict future news, returns at the time of the news, and earnings announcement returns, suggest that some of these insiders may be trading on material, non-public information. In this section, we explore the link between SEC activity and opportunistic insider trading more formally.
Decoding Inside Information — Page 42 A. The Response of Opportunistic Insiders to SEC Activity
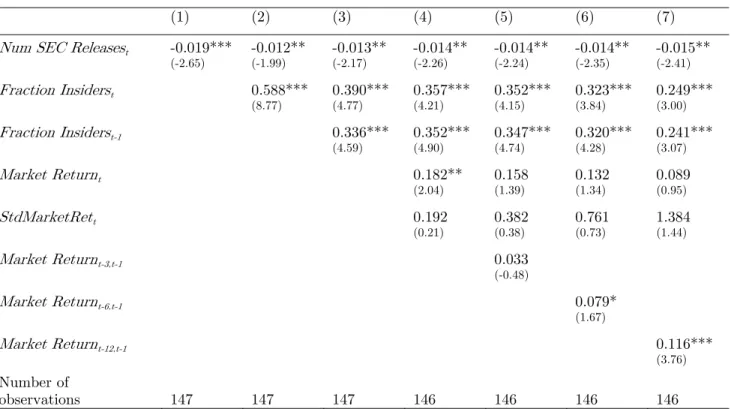
First we explore the behavior of opportunistic traders in the wake of news about illegal insider trading litigation cases. Since opportunistic trades predict future firm-level returns, as well as future firm-firm-level news, it is plausible that opportunistic traders might be especially sensitive to the potential costs and penalties associated with illegal insider trading. We test this idea by regressing the fraction of insiders trading in a given month who are opportunistic on recent SEC releases regarding litigation cases against illegal insider trading. Specifically, the dependent variable we examine is the number of opportunistic insiders trading in month t+1 divided by the number of all insiders trading in month t+1, and the independent variable of interest is the natural logarithm of one plus the number of SEC releases regarding litigation cases against illegal insider activity in month t. We include control variables for the fraction of opportunistic insiders trading in month t and month t-1, the CRSP value-weighted market return in month t, the standard deviation of daily market returns in month t, and various windows of past cumulative market returns (month t-3 to t-1, month t-6 to
t-1, and month t-12 to t-1).
Panel A of Table IX illustrates that opportunistic trading decreases significantly following recent releases from the SEC regarding illegal insider trading cases, consistent with the idea that opportunistic traders dampen their trading activity when the potential costs of illegal trading increase. Specifically, the coefficient on the number of
Decoding Inside Information — Page 43
SEC releases in Column 7 is -0.015 (t=2.41).24
[Insert Table IX here]
B. What Predicts SEC Investigations?
Next we analyze the determinants of being investigated by the SEC in a regression framework in Panel B of Table IX. Specifically, Panel B reports logit regressions, where the dependent variable is equal to one if the insider has been named in an SEC press release related to insider trading. The observations are at the insider level, and insider characteristics are recorded based on all trades of each insider. The independent variable of interest is the number of opportunistic trades each insider has in our sample; we also explore an indicator variable that takes the value of one for opportunistic insiders and zero otherwise.
Column 1 of Panel B shows that while simply being opportunistic increases the likelihood of SEC investigation (and is marginally significant), the number of trades seems to be a statistically stronger predictor. However, this hides interesting variation, as in Column 2 we split this number of trades into its two components: number of opportunistic and number of routine trades. Column 2 of Panel B indicates that the number of opportunistic trades is a positive and significant predictor of the likelihood of being investigated by the SEC, while the number of routine trades is not. In other words, insider trading that reliably predicts future SEC action is opportunistic, not