ISSN 1330-3651 (Print), ISSN 1848-6339 (Online)
UDK/UDC 004.416.052.42
A FAULT DETECTION STRATEGY FOR SOFTWARE PROJECTS
Cagatay Catal, Banu Diri
Original scientific paper The existing software fault prediction models require metrics and fault data belonging to previous software versions or similar software projects. However, there are cases when previous fault data are not present, such as a software company’s transition to a new project domain. In this kind of situations, supervised learning methods using fault labels cannot be applied, leading to the need for new techniques. We proposed a software fault prediction strategy using method-level metrics thresholds to predict the fault-proneness of unlabelled program modules. This technique was experimentally evaluated on NASA datasets, KC2 and JM1. Some existing approaches implement several clustering techniques to cluster modules, process followed by an evaluation phase. This evaluation is performed by a software quality expert, who analyses every representative of each cluster and then labels the modules as fault-prone or not fault-prone. Our approach does not require a human expert during the prediction process. It is a fault prediction strategy, which combines a method-level metrics thresholds as filtering mechanism and an OR operator as a composition mechanism.
Keywords: detection strategies, prediction strategy, fault, metrics thresholds, software metrics, software fault prediction, software quality
Strategija otkrivanja pogrešaka za projekte softvera
Izvorni znanstveni članak Postojeći modeli predviđanja pogrešaka softvera zahtijevaju metrike i podatke o pogreškama koji pripadaju prethodnim verzijama softvera ili sličnim projektima softvera. Međutim, postoje slučajevi kada prethodni podaci o pogreškama nisu prisutni, kao što je prelazak softverske tvrtke u novo projektno područje. U takvim situacijama, nadzorne metode učenja pomoću označavanja pogreške se ne mogu primijeniti, što dovodi do potrebe za novim tehnikama. Mi smo predložili strategiju predviđanja pogrešaka softvera uporabom razinske metode mjernih pragova za predviđanje sklonosti pogreškama neoznačenih programskih modula. Ova tehnika je eksperimentalno ocijenjena na NASA setovima podataka, KC2 i JM1. Neki postojeći pristupi primjenjuju nekoliko klasterskih tehnika kazetnog modula, proces popraćen fazom procjene. Ovu procjenu obavlja stručnjak za kvalitetu softvera, koji analizira svakog predstavnika pojedinog klastera, a zatim označava module kao pogreški-naklonjene ili pogreški-nenaklonjene. Naš pristup ne zahtijeva
čovjeka kao stručnjaka tijekom predviđanja procesa. To je strategija predviđanja pogreške, koja kombinira razinsku metodu mjernih pragova kao mehanizma za filtriranje i ILI operatora kao sastavni mehanizam.
Ključne riječi: kvaliteta softvera, metrike softvera, mjerni pragovi, pogreška, predviđanje pogreške softvera, strategije otkrivanje, strategija predviđanja
1 Introduction
The rising complexities in the software systems and the ever-increasing user expectations have developed the necessity to manage the software quality, giving birth to an engineering discipline called "Software Quality Engineering". Software fault prediction is one of the quality assurance activities in the Software Quality Engineering discipline. Many of the software systems, such as those implemented in telecommunication and medical areas require a high level of quality assurance. The management of these systems necessitates an evaluating process of the quality of software modules, which can be done by implementing software fault prediction techniques. A project manager or a quality assurance group can improve the product quality by allocating necessary budget and human resources to deal with the fault-prone modules identified by fault prediction models. Consequently, the testing phase would be shortened. Software fault prediction models require software metrics, collected with automated tools and fault data belonging to previous software version or similar software project. Fault prediction models generally contain one dependent variable and n independent variables. Dependent variable shows whether the module is fault-prone or not. Independent variables can be product or process metrics, collected from different studies focused on product metrics. Cyclomatic complexity and lines of code are some examples of method-level product metrics.
Most of the studies in literature combine software metrics and fault data altogether. According to a machine
learning perspective, these studies are called "supervised learning" approaches, which implement different types of learning algorithms. There can be mentioned algorithms such as Genetic Programming [6], Decision Trees [12], Neural Networks [22, 17, 11], Naïve Bayes [14, 28], Dempster-Shafer Networks [8], Case-based Reasoning [4], Fuzzy Logic [25], Artificial Immune Systems [3], Support Vector Machines [5, 9], Ant Colony Optimization [24]. Fenton et al. [7] introduced an approach which models different software lifecycles using a Dynamic Bayesian Network, tolerating also the Bayesian network for the software fault prediction to be customized to several platforms. Janes et al. [10] used models such as Poisson regression and zero-inflated negative binomial regression for real-time, telecommunication systems. Tomaszewski et al. [23] stated that statistical techniques are better than expert estimations. Peng et al. [18] used Multiple Criteria Decision Making (MCDM) methods to find the most appropriate algorithms for software fault prediction.
However, there are cases when previous fault data are not available, such as when a company deals with a new project type or when fault labels in previous releases may have not been collected [27]. To solve this challenging problem, Zhong et al. [27] implemented some clustering algorithms. Modules were separated into clusters using K-means [1] and Neural-Gas algorithms. After that, an expert, a 15 years experienced engineer, labelled each cluster as fault-prone or not fault-prone by examining not only the representative of each cluster, but some statistical data, too. This method consisted in combining clustering and expert based software quality estimation method, in
order to solve the problem of the missing fault labels. However, most of the software companies can face the difficulty to find a 15 years experienced expert, who would have the duty to label each cluster in a well-defined way. In the Zhong et al. [27] study, during the labelling process the expert inspected not only the mean (of software attribute values) of each cluster, but also other statistical data such as global mean, minimum, maximum, median, 75 percentile, and 90 percentile of each metric. In addition, there was required a clustering analyst, who would be specialized in data mining and machine learning techniques.
In this study, our target was to eliminate the drawbacks of the above mentioned approach. Furthermore, we suggested a fault prediction strategy using a method-level metrics thresholds as filtering mechanism and an OR operator as a composition mechanism. The OR operator was chosen according to our experimental results, which showed that the highest prediction performance was obtained when at least one metric threshold was exceeded. We introduce a fully automated approach, which can be customized by users for different types of projects. Additionally, there is used a 7 method-level metrics including the primitive Halstead and McCabe metrics. Chapter 3 presents a detailed explanation of this approach. The stepwise methodology proposed by Marinescu [13], was applied to build the fault prediction strategy. Marinescu [13] introduced this methodology to define design detection strategies for capturing design flaws. Experimental results show that our approach achieves comparable results with clustering and expert based software quality estimation method proposed by Zhong et al. [27]. In addition, we can emphasize the fact that our approach operates in a full automatic way. As far as we know, this study is the first one which does not need a human expert to predict software faults when the fault labels are unavailable. This paper is organized as follows: Section 2 presents the related work in the software fault prediction area. Section 3 explains our fault prediction strategy, whereas Section 4 shows the experimental results. Finally, section 5 presents the conclusions and the future work.
2 Related work
There have been very few studies on software fault prediction without prior fault data. Zhong et al. [27] proposed a clustering and expert-based software fault prediction method when the fault labels for software modules are unavailable. They used K-means and Neural-Gas clustering algorithms to cluster modules. After the clustering phase, a 15-years experienced software engineering expert examined the representative module (mean of each metric) of each cluster and several statistical data such as maximum, minimum, median of each metric, in order to label each cluster as fault-prone or not. The Neural-Gas clustering algorithm revealed to be easier in use than the K-means clustering algorithm during the labelling phase. Experiments conducted on a NASA dataset, KC2, attained promising results, Furthermore, the presented method achieved comparable classification accuracies with other classifiers, too. Later on, Zhong et al. [26] performed an experiment using the
same approach on a larger NASA dataset called JM1. In the study on the JM1 dataset, Neural-Gas based prediction approach performed slightly worse than K-means clustering based approach in terms of the overall error rate. However, Neural-Gas based approach had performed slightly better for KC2 dataset in the previous study. The suggested approach depended on the expert’s availability and his estimation capability.
Seliya et al. [20] proposed a constraint-based semi-supervised clustering scheme that uses K-means clustering method to predict the fault-proneness of program modules when the fault labels for modules are unavailable. However, their approach uses an expert’s domain knowledge to iteratively label clusters as fault-prone or not. The expert labels clusters mainly basing his predictions on his knowledge and some statistical information. This means that this study does not present a well-defined decision mechanism of the expert. On the other hand, the enlargement of the dataset causes the increasing of the number of clusters and iterations, which will require the expert to spend much more time on this approach. The expert necessity prevents this method to be automatically performed, presenting one of the major drawbacks of this study. Consequently, none of the above mentioned approaches can be used in software engineering community or embedded into an automated software tool, because of their data-size and human-expert dependencies.
Also, a recent study of Menzies et al. [15] concluded that local fault prediction models perform better than global models and researchers should find the best local lessons instead of seeking general principles that can be true for many projects.
3 Fault prediction strategy
Our aim was to develop a software fault prediction method which does not require a software engineering or data mining expert when the fault labels are unavailable. Expert based approaches are difficult to be embedded into software tools. In addition, they require extra effort. To achieve our target, we first examined NASA datasets and method-level metrics thresholds that have been explained in Predictive tool developed by Integrated Software Metrics, Inc. (ISM) for software fault prediction [29]. This study also emphasizes the importance of metric thresholds in software fault prediction field, mechanisms so far ignored by most of the studies. Clustering based fault prediction studies need a human expert to initialize first-step labels at the beginning of the semi-supervised clustering or to label the clusters after using clustering methods. We showed that an automated decision mechanism using the metric thresholds can label software modules as fault-prone or not fault-prone. After the experimental phase, this fully automated strategy provided satisfactory results compared to expert based clustering approaches.
3.1 Detection strategies
We were inspired by Marinescu’s [13] work, according to which metric-based rules are applied to detect design flaws. In other words, this set of rules is
used to capture deviations from good design principles. According to Marinescu [13], "Detection strategy allows engineers to work with metrics on a more abstract level, which is conceptually much closer to the real intentions in using metrics. A detection strategy is the quantifiable expression of a rule by which design fragments that are conforming to that rule can be detected in the source code". Detection strategies have two essential mechanisms: Filtering and composition. Filtering mechanism reduces the initial set based on the data filter type, in order to preserve the data with special characteristics. There are two types of filters: Interval and marginal filter. Interval filters require two threshold values: the upper and lower limits. Marginal filters can be classified into two groups: Semantical and statistical filters. Semantical filters involve two parameters, the marginal value and the direction (upper or lower limit). Statistical filters do not need a threshold value. They are defined by using statistical methods such as box-plots on a dataset. Marinescu [13] instantiated three data filters from semantical and statistical filters: Absolute semantical filter, relative semantical filter, and statistical. Absolute semantical filter expresses sharp rules such as
HigherThan or LowerThan. Relative semantical filter does not specify a maximum or minimum value, but defines the number of entities to be retrieved such as
TopValues or BottomValues (%). Statistical filters use box-plots. After the selection of the proper data filters, a composition mechanism must be defined. This mechanism provides a correlated interpretation of multiple filtered sets. "The composition mechanism is based on a set of operators that glue together different metrics in an articulated rule" [13]. Three composition operators have been defined: and, or and butnot. The selection of the correct threshold values directly affects the performance of the detection strategies. In order to determine acceptable threshold values, there are used three means of improvement described as follows [13]:
Experience and Hints from Literature: The threshold values are specified according to the empirical researches, previously introduced in the literature.
Tuning Machine: This approach uses a repository of problematic items (i.e. faulty modules). Accordingly, there are chosen threshold values that maximize the number of correctly detected items.
Analysis of Multiple Versions: This method does not parameterize a strategy with several thresholds, but adds an important time viewpoint for each suspected entity.
3.2 The process of formulating detection strategies
As stated by Marinescu [13], the detection strategy mechanism is not only limited in design flaws detection but it can also serve for other purposes, such as detection of design patterns. Thus, Marinescu [13] introduced a stepwise methodology, which is useful to formulate detection strategies for a new domain. We used this process to turn our fault prediction domain knowledge into metrics-based rules. The stepwise methodology is shown as follows [13]:
"The first step in constructing a detection strategy is to break-down the informal rules in a correlated set of
symptoms (e.g. class inflation, excessive method complexity, high coupling) that can be captured by a single metric.
The second step is to select proper metrics that quantify best each of the identified properties.
The next step is to find the adequate filtering mechanism that should be used with each metric.
One of the most critical tasks in defining a detection strategy is to set the parameters (i.e. the thresholds) for each data filter.
The final step is to correlate these symptoms, using the composition operators".
3.3 Our fault prediction approach
Initially, we combined some method-level metric thresholds to make a threshold vector. Next, the vector was used to filter each software module, by using our fault prediction strategy. In this study, there were analysed code fragments instead of design fragments with the intention of finding fault-prone and not fault-prone modules. Derived by Marinescu’s study [13], our approach is based on two essential mechanisms: filtering and composition. Fig. 1 clearly depicts our fault prediction methodology and Fig. 2 shows the process of transforming information rules in a fault prediction strategy. To present a general fault prediction methodology, we summarize our approach in five steps:
Our fault prediction strategy’s first step is to identify the informal fault-proneness rules which can be quantified with a single metric. In other words, this step consists in defining the best metrics set that highly correlates with fault-proneness. Previous fault prediction studies were analysed and the most widely used set was selected.
The second step is to choose appropriate metrics according to step one. Public NASA datasets include 21 method-level metrics proposed by Maurice Halstead and Thomas McCabe. However, some researchers mostly use only 13 metrics from these datasets [21], stating that derived Halstead metrics do not contain any extra information for software fault prediction. In his software measurement book, Munson [16] explains that the four primitive metrics of Halstead describe the variation of all of the rest of Halstead metrics. That is why there is nothing new to learn from the remaining derived Halstead metrics. To label a software module as fault-prone or not fault-prone, we selected the following method-level metrics:
o Lines of Code (LoC): The total number of code lines including blank lines and comment lines.
o Cyclomatic Complexity (CC): The total number of independent paths on the flow graph.
o Essential Complexity (EsC): It represents the unstructured nature of the module. "if-then-else" and "while" loops are well structured constructs. Use of "goto" statements increases the EsC value.
o Unique Operator (UOp): The total number of
unique operators; if the same operator appears several times, it is counted once.
o Unique Operand (UOpnd): The total number of
unique operands; if the same operand appears several times, it is counted once.
o Total Operator (TOp): The total number of operators appearing in a module. Some examples for operators are logical operations, arithmetical operations, bitwise operations, and every keyword (return, sizeof, etc.) that causes an action to the operand. Function calls are also considered as a single operator.
o Total Operand (TOpnd): The total number of operands appearing in a module. The tokens not identified as operators are considered operands.
The third step consists in finding the most appropriate filtering mechanism. We search for high metric values in the given software modules; consequently, we use the advantage of the marginal filters. This filter is a data filter where one high value (margin) of the module is identified with the corresponding limit of the initial metric threshold. Seeing the way how the limits are specified, we use the marginal absolute semantical filter. Through the light of this approach, we use "Greater and Equal" comparison for each metric. A module is predicted as fault-prone if at least one metric is higher than the specified threshold value.
The fourth step deals with setting the parameters, in our case setting the thresholds. According to "Experience and Hints from Literature" approach, setting the threshold values is typically an empirical process. We used the metric thresholds shown in Tab. 1. Firstly, we started with ISM Inc.’s [29] recommended values. Thus, our approach uses
Experience and Hints from Literature. Therefore, we suggest researchers to start with thresholds given in Tab. 1.
Table 1 Metric thresholds and abbreviations
Metric Abbreviation Threshold
Lines of Code LoC 65
Cyclomatic Complexity CC 10
Essential Complexity EsC 4
Unique Operator UOpr 40
Unique Operand UOpnd 25
Total Operator TOpr 125
Total Operand TOpnd 70
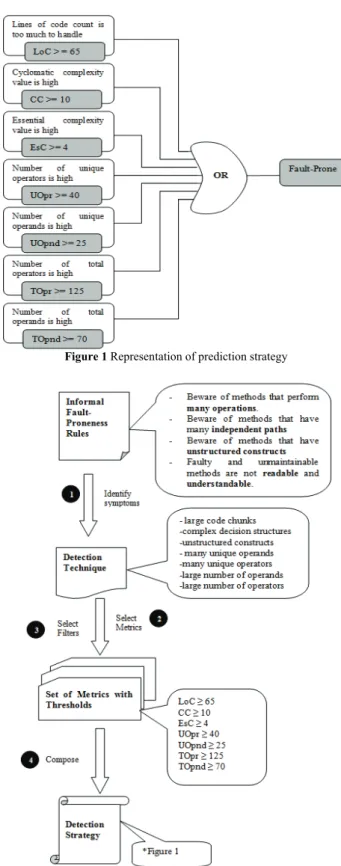
The final step of this approach is to merge each comparison into one result using composition operators. After specifying the metrics and their threshold values, we formulated a specific composition. We combined all seven metrics with an OR operator because of the higher experimental results that we obtained with this approach. This means that, if a vector has at least one item which is greater than or equal to the threshold item of thresholds vector, this module is labelled as fault-prone, otherwise it is labelled as not fault-prone. Fig. 1 shows this composition strategy graphically. In order to improve our fault prediction strategy, we also tried to benefit from some other method-level
metrics. However, some of them are highly correlated with current metric, motive why they did not provide significant positive effect on prediction. Consequently, there was no need to use highly-correlated metrics such as branch count for its computational load (cyclomatic complexity already provides this information). As a result, our fault prediction approach was based on only these seven method-level metrics. Fig. 1 shows that a module is predicted as fault-prone if at least one method-level metric value for a module exceeds its threshold.
Figure 1 Representation of prediction strategy
Figure 2 Transformation of informal rules into a fault prediction strategy
4 Experimental results
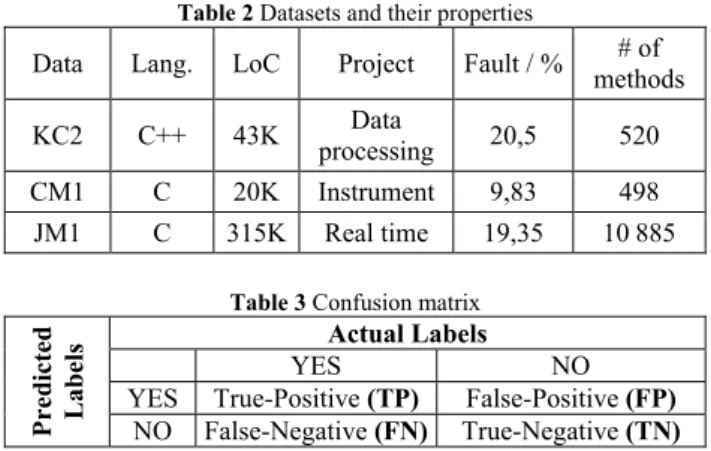
Our fault prediction strategy was tested on NASA KC2 and JM1 datasets [2] so that the results could be compared with previous studies [27, 26]. Other tests were also performed on a new NASA dataset called CM1 [2]. However, there are not previous studies over the CM1 dataset for software fault prediction with no fault data problem. Thus, we could compare the performance of our approach only on KC2 and JM1 datasets. Tab. 2 shows these datasets and their properties. After the prediction process, we designed a confusion matrix, which would be useful in the process of performance evaluation. Tab. 3 shows a sample confusion matrix.
Table 2 Datasets and their properties
Data Lang. LoC Project Fault / % methods # of KC2 C++ 43K processing Data 20,5 520
CM1 C 20K Instrument 9,83 498
JM1 C 315K Real time 19,35 10.885 Table 3 Confusion matrix
Pred ic ted Labels Actual Labels YES NO
YES True-Positive (TP) False-Positive (FP) NO False-Negative (FN) True-Negative (TN) According to this confusion matrix, we calculated the false positive rate (FPR), false negative rate (FNR) and the error values. Zhong et al. [27] suggested these performance parameters to evaluate the expert’s labelling decision, considering the fact that their prediction approach is mainly based on an expert’s opinion. Error is the percentage of mislabelled modules by the method, false positive rate (FPR) is the percentage of not faulty modules labelled as fault-prone by the method, and false negative rate (FNR) is the percentage of faulty modules labelled as not fault-prone [27]. These three performance indicators are calculated using the following equations:
, TN FP FP FPR (1) , TP FN FN FNR (2) . TN FN FP TP FP FN Error (3) In order to obtain a better performance, all of the above mentioned parameters should be minimized, but there is a trade-off between FPR and FNR values. For example; if threshold values decrease, the number of the modules predicted as fault-prone, will increase, even though some of the not faulty modules may be categorized as faulty ones. Therefore FPR will increase, but FNR will decrease. FNR represents a more crucial parameter than FPR, because it can negatively affect the detecting phase of the faulty modules, during the testing process. Consequently the non-detected faulty modules
can cause serious faults or even failures. On the other hand, predicting not faulty modules as faulty ones will simply increase time and efforts during the testing phase. Tab. 4 shows our approach’s results, compared to the results obtained by Zhong et al. [27].
Table 4 Results of the approaches on KC2
FPR, % FNR, % Error, % K-means (Zhong et al. [9]) 14,98 31,13 18,27 Neural-Gas (Zhong et al. [9]) 15 32 19 Our Detection Strategy 13,76 32,07 17,5
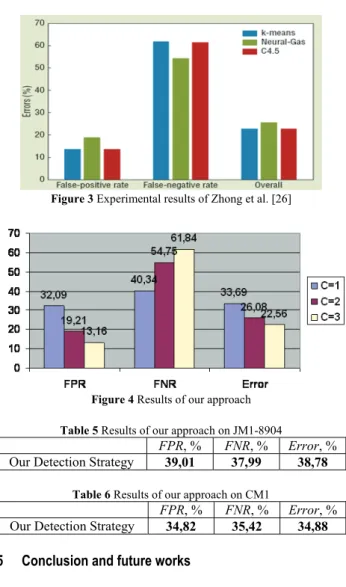
According to Tab. 4, our approach provides comparable results with previous studies. It shows better performance in terms of the overall classification error and FPR values. In addition, our approach is fully automated and does not require a data mining or software engineering expert. We could compare our strategy with the approach presented by Zhong et al. [27, 26] only on KC2 and JM1 dataset, because these were the only datasets where Zhong et al. [27, 26] performed their evaluation tests. Zhong et al. [26] performed an experiment using the same approach on a larger NASA dataset called JM1. However, they did declare their results non-numerically, by showing simply a chart, shown in Figure 3. JM1 dataset includes inconsistent modules (same attribute values but different fault labels) and missing values. Zhong et al. [26] removed modules with inconsistency and missing values. We tried to remove these inconsistent modules with the same approach, but our dataset included different number of modules. They studied on 8850 modules located in JM1 dataset, whereas our JM1 dataset includes 8904 modules. To make an accurate comparison, we attempted to obtain the same dataset from the authors but unfortunately we could not get it. Tab. 5 shows our experimental results for JM1-8904. According to Fig. 3 and Tab. 5, our approach seems to provide better results for the FNR value on JM1 dataset. However, due to the detection of inconsistent modules on the dataset, the numbers of modules and perhaps even the modules used in these two studies are not the same.
Our fault prediction strategy uses the OR operator as a composition mechanism. This means that a module is predicted as fault-prone if at least one method-level metric value for a module exceeds its threshold. In order to make a comparison with Zhong et al.’s study [26], we changed the "at least 1 metric value exceeds its threshold" rule (Criterion-C) with 2 and 3 values. The results of these experiments are shown in Fig. 4. According to this figure, when C is 3, FNR is 61,84; FPR is 13,16 and
Error is equal to 22,56. These results are very similar to Zhong et al.’s results [26] presented in Fig. 3. However, not only FNR results to be very high when C is 3, but also our approach using C as 1 reveals to be better for JM1 dataset. Even though our error and FPR rates for C=1 setting seems to be higher than Zhong et al.’s study, our
FNR value (40,34) is lower than their FNR values (around 60) and as stated before, FNR value is much more critical than FPR rate for software fault prediction problem. JM1 may have many outlier data and that is why FPR rate is high. Evaluations on the KC2 dataset show that there are many outliers in this small set. For example, a module
that has all its metrics values close to one has the class label "fault-prone". According to the software quality measurement trends, this module seems to be a noisy one or outlier. These noisy data probably increased our FNR
values, that directly affect the algorithm to detect incorrectly "noisy fault-prone" modules as not fault-prone modules. However, even without cleaning these outliers or performing any other pre-processing, compared to previous works, our results are quite satisfactory. Still, the main contribution of this study is that it is the first to introduce a strategy relying completely on software metrics, where no human expert is required. After the comparison of our approach with previous studies on KC2 and JM1, we employed the same approach on CM1 dataset. In this experimental setting over CM1 dataset, there was not performed any pre-processing operation such as the identification of inconsistent modules. Table 6 shows the results of this experiment.
Figure 3 Experimental results of Zhong et al. [26]
Figure 4 Results of our approach Table 5 Results of our approach on JM1-8904
FPR, % FNR, % Error, % Our Detection Strategy 39,01 37,99 38,78
Table 6 Results of our approach on CM1
FPR, % FNR, % Error, % Our Detection Strategy 34,82 35,42 34,88 5 Conclusion and future works
Software fault prediction with no fault data is a challenging research area, where very few studies were made. The previous works were mainly based on clustering and expert based approaches. In this study, we proposed and validated a fault prediction strategy which does not need a human expert. Our approach is comparable with previous clustering and expert based approaches. As pointed out before, this project has two important achievements that need emphasizing: first, the removing of the obligation of an expert assistance and second the introducing of the implementation of metric
thresholds for labelling software modules. We adopted the methodology of Marinescu [13] to build this prediction strategy, which obtained promising results. We believe that our fault prediction strategy not only will help software engineering researchers to build better predictive models but also can serve as an alternative way for expert and clustering based fault prediction approach. This can be done by simply customizing metrics, filters, and compositions, which would lead to the optimizing of our filtering and composition mechanisms. In the future, we plan to develop metrics thresholds and clustering based approaches. In addition, we will change our filtering mechanism and evaluate the prediction performance of the fault prediction strategy.
6 Validity threats
We performed experiments on three public NASA datasets. However, the characteristics of the data can affect the performance of the models we proposed in this study. We are planning to add more datasets for the future work. As the evaluation parameters, we chose FPR, FNR, and Error parameters because of their widespread usage in literature [26] and we compared the performance of our model with the performance of the approach proposed by Zhong et al. [26]. However, some researchers prefer different evaluation parameters such as Area under ROC curve (AUC) and F-measure and these different evaluation parameters can affect the comparative analysis of several fault prediction algorithms. In this study, we used constant metrics thresholds and the selection of these values can affect the performance of the algorithm we suggested. We will use a threshold calculation approach for the future work instead of using constant threshold values that were identified from the documentation of an industrial software tool [29].
7 References
[1] Aliguliyev, R. M. Performance Evaluation of Density-based Clustering Methods. // Information Sciences, 179, 20(2009), pp. 3583-3602.
[2] Boetticher, G.; Menzies, T.; Ostrand, T. PROMISE Repository of Empirical Software Engineering Data. http://promisedata.org/repository // West Virginia University, Department of Computer Science, 2007.
[3] Catal, C.; Diri, B. Investigating the Effect of Dataset Size, Metrics Sets, and Feature Selection Techniques on Software Fault Prediction Problem. // Information Sciences, 179, 3(2009), pp. 1040-1058.
[4] El Emam, K.; Benlarbi, S.; Goel, N.; Rai, S. Comparing Case-based Reasoning Classifiers for Predicting High Risk Software Components. // Journal of Systems and Software, 55, 3(2001), pp. 301-320.
[5] Elish, K. O.; Elish, M. O. Predicting Defect-Prone Software Modules using Support Vector Machines. // Journal of Systems and Software, 81, 5(2008), pp. 649-660.
[6] Evett, M.; Khoshgoftaar, T.; Chien, P.; Allen, E. GP-based Software Quality Prediction. // Proceedings of the 3rd Annual Genetic Programming Conference / San Francisco, CA, 1998, pp. 60-65.
[7] Fenton, N.; Neil, M.; Marsh, W.; Hearty, P.; Marquez, D.; Krause, P.; Mishra, R. Predicting Software Defects in Varying Development Lifecycles using Bayesian Nets. //
Information and Software Technology, 49, 1(2007), pp. 32-43.
[8] Guo, L.; Cukic, B.; Singh, H. Predicting Fault Prone Modules by the Dempster-Shafer Belief Networks. // Proceedings of the 18th IEEE Int’l Conf. on Automated Software Eng. / Montreal, Canada, 2003, pp. 249-252. [9] Gondra, I. Applying Machine Learning to Software
Fault-proneness Prediction. // Journal of Systems and Software, 81, 2(2008), pp. 186-195.
[10] Janes, A.; Scotto, M.; Pedrycz, W.; Russo, B.; Stefanovic, M.; Succi, G. Identification of Defect-prone Classes in Telecommunication Software Systems using Design Metrics. // Information Sciences, 176, 24(2006), pp. 3711-3734.
[11] Kanmani, S.; Uthariaraj, V. R.; Sankaranarayanan, V.; Thambidurai, P. Object-oriented Software Fault Prediction using Neural Networks. // Information and Software Technology, 49, 5(2007), pp. 483-492.
[12] Khoshgoftaar, T. M.; Seliya, N. Software Quality Classification Modeling using the SPRINT Decision Tree Algorithm. // Proc.of the 4th IEEE Int’l Conf. on Tools with AI. / Washington, DC, 2002, pp. 365-374.
[13] Marinescu, R. Detection Strategies: Metrics-based Rules for Detecting Design Flaws. // Proceedings of the 20th International Conference on Software Maintenance. / Chicago, IL, 2004, pp. 350-359.
[14] Menzies, T.; Greenwald, J.; Frank, A. Data Mining Static Code Attributes to Learn Defect Predictors. // IEEE Transactions on Software Engineering, 33, 1(2007), pp. 2-13.
[15] Menzies, T.; Butcher, A.; Marcus, A.; Zimmermann, T.; Cok, D. Local vs. Global Models for Effort Estimation and Defect Prediction. // In Proceedings of the 2011 26th IEEE/ACM International Conference on Automated Software Engineering. / Washington, DC, USA, 2011, pp. 343-351.
[16] Munson, J. C. Software Engineering Measurement, Auerbach Publications, Boca Raton, FL, 2003.
[17] Quah, T. S. Estimating Software Readiness using Predictive Models. // Information Sciences, 179, 4(2009), pp. 430-445. [18] Peng, Y.; Wang G.; Wang, H. User Preferences based
Software Defect Detection Algorithms Selection using MCDM. // Information Sciences, 191(2012), pp. 3-13. [19] Pusatli, O. T.; Misra, S. A Discussion on Assuring Software
Quality in Small and Medium Software Enterprises: An Empirical Investigation. // Technical Gazette, 18, 3(2012), pp. 447-452.
[20] Seliya, N.; Khoshgoftaar, T. M. Software Quality Analysis of Unlabeled Program Modules with Semi-supervised Clustering. // IEEE Transactions on Systems, Man and Cybernetics-Part A: Systems and Humans, 37, 2(2007), pp. 201-211.
[21] Seliya, N.; Khoshgoftaar, T. M. Software Quality Estimation with Limited Fault Data: A Semi-supervised Learning Perspective. // Software Quality Journal, 15, 3(2007), pp. 327–344.
[22] Thwin, M. M.; Quah, T. Application of Neural Networks for Software Quality Prediction using Object-oriented Metrics. // ICSM 2003. / Amsterdam, The Netherlands, 2003, pp. 113-122.
[23] Tomaszewski, P.; Håkansson, J.; Grahn, H.; Lundberg, L. Statistical Models vs. Expert Estimation for Fault Prediction in Modified Code - An Industrial Case Study. // Journal of Systems and Software, 80, 8(2007), pp. 1227-1238.
[24] Vandecruys, O.; Martens, D.; Baesens, B.; Mues, C.; De Backer, M.; Haesen, R. Mining Software Repositories for Comprehensible Software Fault Prediction Models. // Journal of Systems and Software, 81, 5(2008), pp. 823-839.
[25] Yuan, X.; Khoshgoftaar, T. M.; Allen, E. B.; Ganesan, K. An Application of Fuzzy Clustering to Software Quality Prediction. // Proc. of the 3rd IEEE Symp. on Application-Specific Systems and Software Eng. Technology, / Washington, DC, 2000, pp. 85-90.
[26] Zhong, S.; Khoshgoftaar, T. M.; Seliya, N.; Analyzing Software Measurement Data with Clustering Techniques. // IEEE Intelligent Systems, 19, 2(2004), pp. 20-27.
[27] Zhong, S.; Khoshgoftaar, T. M.; Seliya, N. Unsupervised Learning for Expert-based Software Quality Estimation. // Proc. of the 8th Intl. Symp. on High Assurance Systems Eng. / Tampa, FL, 2004, pp. 149-155.
[28] Zhang, M. L.; Peña, J. M.; Robles, V. Feature Selection for Multi-label Naive Bayes Classification. // Information Sciences, 179, 19(2009), pp. 3218-3229.
[29] Predictive Tool, Integrated Software Metrics, Inc., http://www.spaceref.com/news/viewpr.html?pid=17139
Authors’ addresses:
Assistant Prof. Dr. Cagatay Catal
Istanbul Kultur University
Department of Computer Engineering E5 Freeway Bakirkoy
34156 Istanbul, Turkey E-mail: [email protected]
Associated Prof. Dr. Banu Diri
Yildiz Technical University Department of Computer Engineering 34220, Istanbul, Turkey