Worcester Polytechnic Institute
Digital WPI
Interactive Qualifying Projects (All Years) Interactive Qualifying Projects
March 2013
Practice for Connected Mathematics Project
Brent Daniel McGrathWorcester Polytechnic Institute
James Albert Beaulieu
Worcester Polytechnic Institute
Follow this and additional works at:https://digitalcommons.wpi.edu/iqp-all
This Unrestricted is brought to you for free and open access by the Interactive Qualifying Projects at Digital WPI. It has been accepted for inclusion in Interactive Qualifying Projects (All Years) by an authorized administrator of Digital WPI. For more information, please [email protected].
Repository Citation
McGrath, B. D., & Beaulieu, J. A. (2013).Practice for Connected Mathematics Project. Retrieved fromhttps://digitalcommons.wpi.edu/ iqp-all/189
PRACTICE FOR CMP
Interactive Qualifying Project completed in partial fulfillment of the Bachelor of Science degree at
Worcester Polytechnic Institute, Worcester, MA
Submitted to:
Professor Neil Heffernan (advisor) Cristina Heffernan (co-advisor)
In Cooperation With ASSISTments Mary Fowler James Beaulieu ______________________________ Brent McGrath ______________________________ Date: March 4, 2013 _______________________________ Advisor Signature _______________________________ Co-advisor Signature
Abstract
ASSISTments is an online math tutoring system which has performed numerous studies in order to find ways to improve student learning. The purpose of this study is to see if students benefit from practicing the prior and prerequisite skills relevant to the current Connected Math Project 2 unit. Through the designing and building of the prerequisite problem sets, this and other studies can now be run to help ASSISTments gather data and make great strides in improving student success in the classroom.
Authorship
Section Name Author
Abstract All
Acknowledgements All
Table of Contents All
List of Tables All
List of Figures All
Introduction BM
Background All
Methodology All
Results and Discussion JB
Conclusions and Recommendations JB
References BM
Appendices BM
Appendix A: Documentation & Problem Sets Created by Brent McGrath BM
Appendix A.1.1: Table Skill Documentation BM
Appendix A.1.2: Table Skill Sample Problem Print BM
Appendix A.2.1: Interpret Data Skill Documentation BM
Appendix A.2.2: Interpret Data Skill Sample Problem Print BM
Appendix A.3.1: Interpreting Coordinate Graphs Skill Documentation BM
Appendix A.3.2: Interpreting Coordinate Graphs Skill Sample Problem Print BM
Appendix A.4.1: Similar Figures Skill Documentation BM
Appendix A.4.2: Similar Figures Skill Sample Problem Print BM
Appendix B: Documentation & Problem Sets Created by James Beaulieu BM
Appendix B.1.1: Equally Likely Skill Documentation BM
Appendix B.1.2: Equally Likely Skill Sample Problem Print BM
Appendix B.2.1: Bar Graphs Skill Documentation BM
Appendix B.2.2: Bar Graphs Skill Sample Problem Print BM
Appendix B.3.1: Scale Factor Skill Documentation BM
Appendix B.3.2: Scale Factor Skill Sample Problem Print BM
Appendix B.4.1: Writing Equations Skill Documentation BM
Appendix B.4.2: Writing Equations Skill Sample Problem Print BM
Appendix B.5.1: Parallel and Perpendicular Lines Skill Documentation BM
Appendix B.5.2: Parallel and Perpendicular Lines Skill Sample Problem Print BM
Appendix C: Pre Test Data Spreadsheet JB
Appendix D: Powerpoint Advertisement for Study BM
Acknowledgements
This Interactive Qualifying Project was made possible with the help of a few key people. We would like to thank Professor Neil Heffernan for his generosity in allowing us to run this study under his supervision. We would also like to thank Cristina Heffernan for the amount of time she was able to commit to overseeing the project, reviewing all of the ASSISTments content produced, and helping us to acquire useable data from selected middle school classrooms. Lastly, we would like to thank Professor Mary Fowler for the expertise she was able to share with us throughout the IQP process in order for the project to be a success.
Table of Contents
Abstract ... ii
Authorship... iii
Acknowledgements ... iv
Table of Contents ... v
List of Tables ... vii
List of Figures ... viii
Introduction ... 1
Background ... 4
Methodology ... 9
Results and Discussion ... 14
Conclusions and Recommendations ... 19
References ... 22
Appendices ... 23
Appendix A: Documentation & Problem Sets Created by Brent McGrath ... 25
Appendix A.1.1: Table Skill Documentation ... 25
Appendix A.1.2: Table Skill Sample Problem Print ... 33
Appendix A.2.1: Interpret Data Skill Documentation ... 37
Appendix A.2.2: Interpret Data Skill Sample Problem Print... 54
Appendix A.3.1: Interpreting Coordinate Graphs Skill Documentation ... 67
Appendix A.3.2: Interpreting Coordinate Graphs Skill Sample Problem Print ... 81
Appendix A.4.1: Similar Figures Skill Documentation ... 93
Appendix A.4.2: Similar Figures Skill Sample Problem Print ... 101
Appendix B: Documentation & Problem Sets Created by James Beaulieu ... 111
Appendix B.1.1: Equally Likely Skill Documentation ... 111
Appendix B.1.2: Equally Likely Skill Sample Problem Print ... 131
Appendix B.2.1: Bar Graphs Skill Documentation ... 140
Appendix B.2.2: Bar Graphs Skill Sample Problem Print ... 148
Appendix B.3.2: Scale Factor Skill Sample Problem Print ... 157
Appendix B.4.1: Writing Equations Skill Documentation ... 160
Appendix B.4.2: Writing Equations Skill Sample Problem Print ... 164
Appendix B.5.1: Parallel and Perpendicular Lines Skill Documentation ... 166
Appendix B.5.2: Parallel and Perpendicular Lines Skill Sample Problem Print ... 168
Appendix C: Pre Test Data Spreadsheet ... 170
Appendix D: Powerpoint Advertisement for Study ... 172
Appendix E: CMP Test Questions Created by the Math Center ... 178
Appendix E.1: Variables and Patterns Test Questions ... 178
Appendix E.2: Stretching and Shrinking Test Questions ... 183
Appendix E.3: Comparing and Scaling Test Questions... 186
Appendix E.4: Accentuate the Negative Test Questions ... 189
Appendix E.5: Moving Straight Ahead Test Questions ... 192
Appendix E.6: Filling and Wrapping Test Questions ... 196
Appendix E.7: What Do You Expect? Test Questions ... 199
List of Tables
Table 1 : Pre, Mid, and Post Tests for each CMP Unit in the Study ... 10
Table 2: Prior Skill and Prerequisite Skillbuilders Assigned to Students for the Comparing and Scaling CMP2 Unit ... 11
Table 3: Prior Skill and Prerequisite Skillbuilders Assigned to Students for the Moving Straight Ahead CMP2 Unit... 12
Table 4: Descriptive Statistics Extracted from Pre Test Data ... 14
Table 5: Statistical Hypothesis Test Necessary Data and T-test => P-Value Results ... 16
Table 6: Averages of Individual Skills in the Tests ... 18
List of Figures
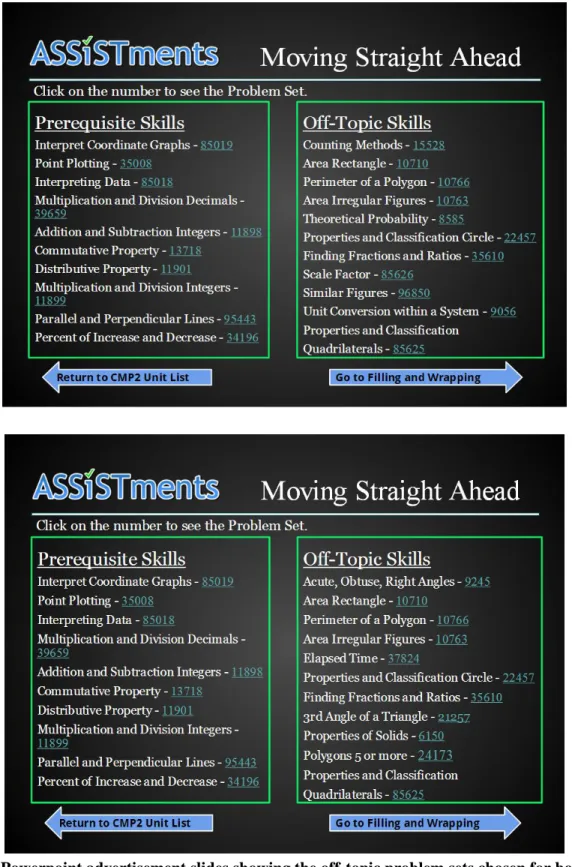
Figure 1. Powerpoint advertisement slides showing the off-topic problem sets chosen for both the long term(top) and short term(bottom) studies for Moving Straight Ahead ... 8
Introduction
Many teachers from middle schools around the United States use math textbooks as their main teaching tool in the classroom. ASSISTments has helped many teachers improve their teaching styles by integrating the use of the ASSISTments system in the classroom. One of the ideas ASSISTments has done well is integrate textbooks from different schools into the ASSISTments electronic system. This integration allows teachers to give students assignments and tests electronically via ASSISTments, moving away from the paper systems used in most classrooms. ASSISTments takes care of all of the grading, provides teachers with a detailed progress report of the success of students on each assignment, and the students are also provided with instant feedback on every assistment completed. The main goal is for ASSISTments to be a tool used by teachers in order to help students have better success in their schools’ respective mathematics curriculums.
A textbook series used by many schools, including Falmouth Middle School in Falmouth, Maine, is the Connected Mathematics Project 2 series. The Connected Math Project 2 series, also known as CMP2, is composed of eight different units, including: Variables and Patterns, Stretching and Shrinking, Comparing and Scaling, Accentuate the Negative, Moving Straight Ahead, Filling and Wrapping, What do you Expect?, and Data Distributions. These eight units cover 7th Grade Mathematics concepts ranging from writing linear equations to representing sets of data using bar graphs and line plots. The focus of this study was placed on the Connected Mathematics Project 2 curriculum to see if there is a way to optimize the performance of students by having students practice prerequisite skills while working with the appropriate CMP2 unit. The first goal of the study was to make sure all of the prerequisite skill problem sets for the
problem sets which were already created were also revisited to make sure all of the assistments used were of the proper grade level and prepared students well for the material found in the CMP2 units. Some previously made problem sets were adjusted in the hope that the modifications would provide students with better preparation for the CMP2 units, but many other prerequisite problem sets were built for prerequisite skills which had yet to have content made for them in the ASSISTments system. After researching the CMP2 units an understanding was developed about how the problems were set up for the students. This knowledge was applied in the creation of the assistments for the remaining prerequisite problem sets which had yet to be completed.
In order for ASSISTments to keep track of every problem set ever built and make sure all of their content is organized, each problem set is thoroughly documented. The documentation of each problem set helps people understand how many different types of assistments can be found in a problem set. Therefore in order to keep the study organized and keep track of all of the work being created, all of the problem sets used in this study were documented. All of the documentation and prints of the new problem sets can be found in Appendix A and Appendix B. The documentation for each problem set outlines the assistment templates used in the creation of the problem set. The documentation will contain the assistment number for the problem set, the number of assistment templates which compose the problem set, the assistment numbers of those templates, a visual representation of what the test drive of each assistment looks like, and a bulleted list of the properties of each template. Some of these properties for the assistments, include: standard or variabilized, type of problem, statement of variabilized components, range of variable possibilities, and the answer type. The documentation also helps the researchers figure out the accuracy of the problem sets in relation to the proper CMP2 units.
Following the documentation of every problem set built for the study, a powerpoint advertisement was created to showcase all of the problem which had been made for each of the CMP2 units. The purpose of the powerpoint was to allow the teachers who were participating in the study an easy way to look at all of the problem sets being given to their students. The powerpoint as seen in Appendix D depicts the purpose of the study, a short explanation of the study, and the problem sets made for each of the eight different CMP2 units. The problem sets shown on each of the slides for the CMP2 units includes the on-topic and off-topic skills with problem sets which would be used for a long term study with an experimental group. Each of the problem set numbers is a hyperlink to the public print of the problem set, so anyone can view the actual assistments which compose the problem set. The powerpoint has internal links throughout in order to allow for easy navigation while viewing. The arrows at the bottom of each slide allow anyone to transition from one slide to the next. The left bottom arrow on the slides which have the CMP2 units will allow anyone to transition back to the slide that lists the eight different CMP2 units. Each of the titles of the eight CMP2 units on this slide is an internal hyperlink to the correct corresponding powerpoint slide for that unit. Through the use of the powerpoint advertisement, people can easily view all of the assistments which will be given to the students in the study.
Background
ASSISTments is an online math tutoring system, which was founded by Professor Neil Heffernan in 2003. The goal of the ASSISTments system is to be an easily accessible aid for teachers that will help improve the overall quality of student learning in the classroom. Through funding from the U.S. Department of Education, the National Science Foundation, and the Bill and Melinda Gates Foundation, ASSISTments has been able to grow as a successful web-based tutoring system. In order to improve the success of ASSISTments and its overall effectiveness in the classroom many studies have been carried out and many more will be. These studies provide ASSISTments with valuable statistical data, vital to the future expansion of ASSISTments in the classrooms of students all over the world.
While ASSISTments has been quite successful in building original content to be used by teachers in the classrooms, the next big step was to partner with math textbook manufacturers in order to utilize material from these other sources. Many schools utilize various textbooks to help teach students the required math curriculum, which does not make use of newer technology. Through the advertisement of ASSISTments to schools in the United States, many schools became interested in using ASSISTments as a tool to help teachers teach their students. After talks with many of these school systems, ASSISTments made it a goal to integrate the textbooks used by each school into the ASSISTments system. Therefore the textbooks would be a guide for the student and all of the work could be completed online. Since ASSISTments is an online math tutoring system, teachers no longer need to spend a large amount of their time grading assignments. Teachers now have more time to focus on improving other aspects of their class and gaining better overall results. Through the use of the ASSISTments system, teachers have many new tools which help in gauging the success of a class in an area of the curriculum.
The National Science Foundation(NSF) in the years of 1991-1996 and 2000-2006 helped give birth to the Connected Mathematics Project math curriculum. The Connected Mathematics Project originated at Michigan State University where five teachers, Glenda Lappan, Elizabeth Phillips, Susan Friel, William Fitzgerald, and James Fey, were looking to improve the overall effectiveness of the middle school math program. The Connected Mathematics curriculum was meant to test students on their problem solving abilities, conceptual understanding, and proportional reasoning. The material for the Connected Mathematics Project was split into eight different units, where each unit covers a different subject in the Middle School math curriculum. Through a wide assortment of math problems, students learn and develop new methods for solving each type of problem. The Connected Mathematics curriculum challenges students to develop a higher level of understanding for problems that range in conceptual difficulty. The material found in each unit presents students with an opportunity to think outside the box, improve their critical thinking skills, and become better problem solvers.
In 2010, the National Science Foundation funded the creation of a new Math Center known as the National Research & Development Center on Cognition & Mathematics Instruction. The ASSISTments team was selected to be a joint partner in helping to perform research regarding the middle school mathematics curriculum, Connected Mathematics Project(CMP). The grant given to ASSISTments from the IES Math Center focused on studying ways of providing practice and feedback. The goal of the IES Math Center is to apply cognitive science principles that have worked well in lab experiments, to the redesign of classroom instructional materials and practices in order to benefit the learning of K-12 school children.12
1Schneider, S (2012) 2
As part of this Math Center, ASSISTments began its partnership with Jim Pelligrino and Susan Goldman, two lead researchers from the University of Chicago, in order to study feedback and spacing with connection to the CMP2 Curriculum. ASSISTments worked closely with Deena Goldstein and Kevin Dietz, grad students from the University of Chicago, to analyze the CMP2 Curriculum and produce useful documentation based upon their research. For example, each CMP2 book was broken down in a spreadsheet where each of the problems was listed and labeled with the appropriate Connected Math skills. The organization of the problems into different skills allowed Deena and Kevin to identify the prerequisite and prior knowledge skills necessary to begin each CMP2 unit. These prerequisite and prior knowledge skill identifications were formatted into paper documents known as “Deliverables.” These Deliverables were originally created for the Math Center for the purpose of distributing them to teachers teaching the CMP math curriculum. The Deliverables would help change the math curriculum by creating a curriculum with better spacing and feedback for students. Using the Deliverables as a reference, proper skillbuilders could be built to prepare students for all of the CMP2 units. These skillbuilders would allow students to practice the necessary prerequisite and prior knowledge skills to help prepare them for any given unit. The main objective is to see if having students practice the prerequisite and prior knowledge skills using the skillbuilders will help improve their overall performance in each unit.
The skills used in the study were divided into two categories: on-topic and off-topic skills. There was a significant process involved with deciding what skills would be included in each group. The on-topic was largely chosen based on the skills reflected by the content of the books, outlined in the Deliverables. The off-topics on the other hand needed more consideration to assure that they did not assist with the understanding of the core material, which would
significantly skew the results. In the initial setup of a large scope study using all of the books, the off-topic skills typically included content that would be on topic content for other books, past or present. In this setup, the groups would switch and the control group would become the experimental. This leads to students doing some of the skill builders multiple times throughout the school year across the different books. On a short term scale, however, the off-topics were altered slightly because they could be optimized for a better overall study application, as seen in Figure 1. The off-topic skills would not necessarily be a wide-range blend of topics like in the large scale, but more of a preparation for the next book. In this case, because the short term setup only included two books, the off topic skills of one book were the preparation for the next book. Therefore the off-topic skills for the first book were on-topic skills for the second book and off topic skills for the second book were on-topic skills for the first book. So in this case, Group A would get on-topic skills for the first book and off-topic skills for the second book, while Group B would get on-topic for the second book and off-topic for the first book.
Figure 1. Powerpoint advertisement slides showing the off-topic problem sets chosen for both the long term(top) and short term(bottom) studies for Moving Straight Ahead
Methodology
The two experimental groups chosen for the study were made from two 7th Grade classes from Falmouth Middle School in Falmouth, Maine. The experimental groups were split evenly between Sally Bennett and Christopher Driscoll teachers at Falmouth Middle School. Sally Bennett’s classes were composed of 53 students, while Christopher Driscoll’s classes were composed of 59 students. The students of each teacher were ordered by average from the highest percentage to the lowest percentage, which allowed the students to be listed from the best to worst performing. From this point, students in the list were assigned either an “A” for Group A or a “B” for Group B in alternating fashion. Assigning students to each group in this fashion allowed for the two new groups to be balanced with students of varying academic success. Each of the teachers has an odd number of students, so Group A in both cases will have an extra student in relation to Group B.
The Grade 7 CMP2 books used in the study were Comparing and Scaling and Moving Straight Ahead. Before the Comparing and Scaling unit is taught, Group A is given the on-topic prerequisite and prior knowledge skillbuilders to practice for the current unit. During this time, Group B is given the off-topic skillbuilders carefully chosen for the Comparing and Scaling unit. The roles are reversed when the class transitions to the Moving Straight Ahead unit. Group A is given the carefully chosen off-topic skillbuilders and Group B is given the on-topic prerequisite and prior knowledge skillbuilders to practice for the current unit, listed in Figure 1.
The primary method used in acquiring performance data from the students was through a Pre, Mid, and Post Test. A portion of the Pre and Post Tests were composed of multiple choice problems, which were originally created by the Math Center to be used with the eight 7th Grade CMP2 units. These multiple choice problems were integrated into ASSISTments before being
Pre Test and Post Test, along with the entirety of the Mid Test contained assistments from the prerequisite skillbuilders for each CMP2 unit. The Mid Test is meant to test students’ abilities with the prerequisite skills, so the Mid Test was made solely of skillbuilders similar to those used in the Pre and Post Tests, with no core assessment. There was one assistment randomly chosen to be added to the Pre and Post Tests from each prerequisite skillbuilder as defined in the Deliverable for each CMP2 unit These Pre, Mid, and Post Tests created for each of the CMP2 units are listed with administered dates in Table 1.
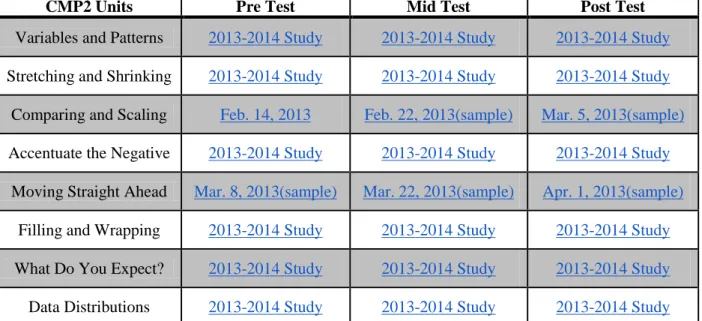
Table 1 : Pre, Mid, and Post Tests for each CMP Unit in the Study
CMP2 Units Pre Test Mid Test Post Test
Variables and Patterns 2013-2014 Study 2013-2014 Study 2013-2014 Study Stretching and Shrinking 2013-2014 Study 2013-2014 Study 2013-2014 Study
Comparing and Scaling Feb. 14, 2013 Feb. 22, 2013(sample) Mar. 5, 2013(sample) Accentuate the Negative 2013-2014 Study 2013-2014 Study 2013-2014 Study
Moving Straight Ahead Mar. 8, 2013(sample) Mar. 22, 2013(sample) Apr. 1, 2013(sample) Filling and Wrapping 2013-2014 Study 2013-2014 Study 2013-2014 Study What Do You Expect? 2013-2014 Study 2013-2014 Study 2013-2014 Study Data Distributions 2013-2014 Study 2013-2014 Study 2013-2014 Study
While the timing of when students take these tests is still largely up to the teacher and will vary slightly between the different classes taking them, the Pre Test should be administered approximately two weeks before the start of the new unit. This will allow for the initial data of the performance of students on both core skills to be taught in the new unit as well as prerequisite skills to be acquired. Following this test, the students will begin to work on their assigned prior skill skillbuilders. The prior skill skillbuilder given to each student will depend on
which group each student is a part of. The “mastery learning” involved in the skillbuilder problem sets will involve answering problems about skills with hints and feedback, until a student can correctly answer three problems consecutively. These are completed as homework assignments and both groups of students are working on them, with the difference being that the experimental students are re-mastering relevant skills whereas the control group is working on other math unrelated to current course material. The skillbuilders assigned during the Comparing and Scaling unit can be seen in Table 2 and the skillbuilders assigned during the Moving Straight Ahead unit can be seen in Table 3.
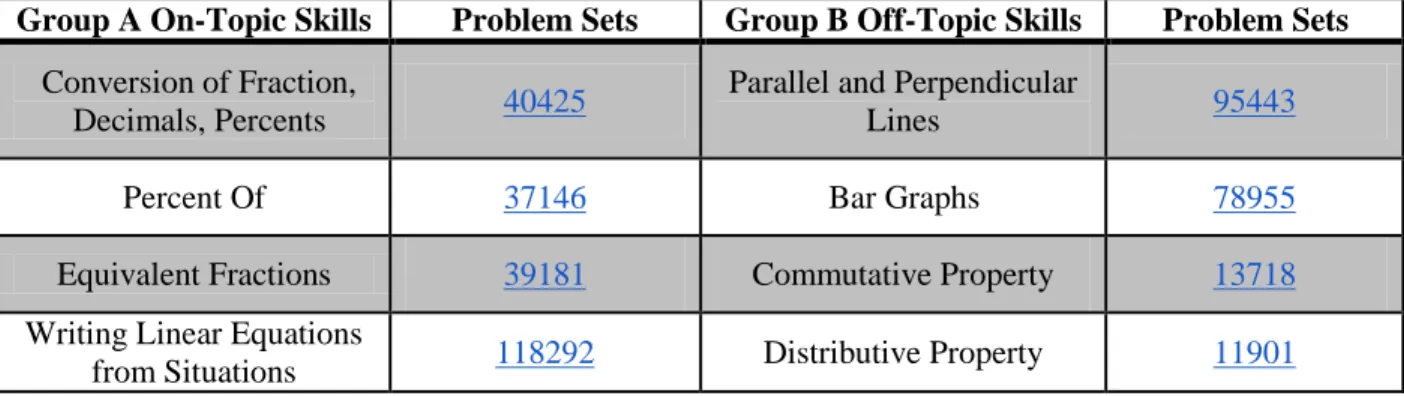
Table 2: Prior Skill and Prerequisite Skillbuilders Assigned to Students for
the Comparing and Scaling CMP2 Unit
Group A On-Topic Skills Problem Sets Group B Off-Topic Skills Problem Sets
Conversion of Fraction,
Decimals, Percents 40425
Parallel and Perpendicular
Lines 95443
Percent Of 37146 Bar Graphs 78955
Equivalent Fractions 39181 Commutative Property 13718
Writing Linear Equations
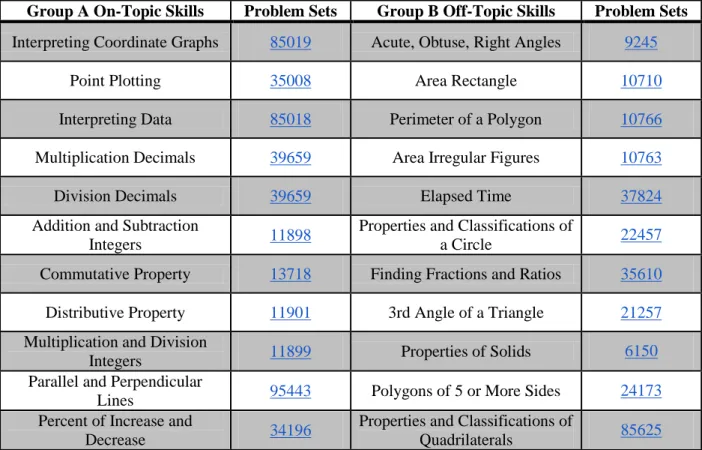
Table 3: Prior Skill and Prerequisite Skillbuilders Assigned to Students for
the Moving Straight Ahead CMP2 Unit
Group A On-Topic Skills Problem Sets Group B Off-Topic Skills Problem Sets
Interpreting Coordinate Graphs 85019 Acute, Obtuse, Right Angles 9245
Point Plotting 35008 Area Rectangle 10710
Interpreting Data 85018 Perimeter of a Polygon 10766
Multiplication Decimals 39659 Area Irregular Figures 10763
Division Decimals 39659 Elapsed Time 37824
Addition and Subtraction
Integers 11898
Properties and Classifications of
a Circle 22457
Commutative Property 13718 Finding Fractions and Ratios 35610 Distributive Property 11901 3rd Angle of a Triangle 21257 Multiplication and Division
Integers 11899 Properties of Solids 6150
Parallel and Perpendicular
Lines 95443 Polygons of 5 or More Sides 24173
Percent of Increase and
Decrease 34196
Properties and Classifications of
Quadrilaterals 85625
Around the time when the students start the new unit they are given the Mid Test as an assessment of their understanding of the prerequisite skills included in the skillbuilders. These are the same skills the experimental group has been working on and the control group has not, so this test should allow researchers to get an idea about the effectiveness of the ASSISTment assignments the students have been working with. The lack of core skills is pretty obvious as the students had not been learning or practicing the core skills at all in this time, so the students should not be tested on material they had not been expected to learn. This also avoids any “testing effect” enhancing student scores about material they do not actually know yet.
When the teacher has completed the unit with the students, they are to take a Post Test before the final which will add to the data collection of the study. This Post Test is very similar to the Pre
Test in that it contains assistments from the same prerequisite skills, but the actual problems chosen are each slightly different from the ones in the Pre Test. The assistments chosen for the Post Test though they are about similar skills as those in the Pre Test.
Results and Discussion
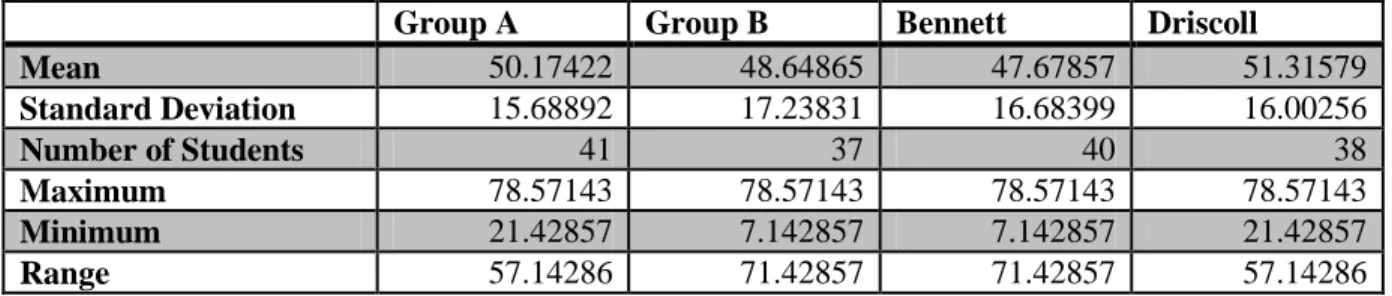
At the time of writing, only the short term study has begun, and the only data obtained thus far is of the Pre Test which can be found in Appendix C. There will be later revisions which will add data, but fortunately the data already obtained has an important function which affects the rest of the study and result. For comparisons to be drawn between the test and control group during each book, and for the two different classes to be mixed into the control and test groups together, the data has to reflect that the students of both classes in both groups perform similarly. This must be significant as well, so as to demonstrate a worthwhile gain (or loss) to practicing the prerequisite skills during the core learning. Descriptive statistics were retrieved for the four categories from the data (displayed in Table 4 below) including the mean, standard deviation, etc.
Table 4: Descriptive Statistics Extracted from Pre Test Data
Group A Group B Bennett Driscoll
Mean 50.17422 48.64865 47.67857 51.31579 Standard Deviation 15.68892 17.23831 16.68399 16.00256 Number of Students 41 37 40 38 Maximum 78.57143 78.57143 78.57143 78.57143 Minimum 21.42857 7.142857 7.142857 21.42857 Range 57.14286 71.42857 71.42857 57.14286
The mean, standard deviation and number of students in the categories will be important when comparing for similarity, but one thing that is visible from the mean, maximum, minimum, and range values is room for growth. While the maximum displays that some students are actually comfortable with the mix of prerequisite and core skills provided in the Pre Test, the mean shows something very different. With the average scores of students hovering around 50% correct, it is clear that most of the class will benefit from learning the material on the test better. Given that
prerequisite problems should be helpful. This is especially clear when considering the average percentages of correct for each problem, seen in Table 6 below. Particularly in the case of the last problem listed, number 389529, a skill students should have learned before, which was only answered correctly by about 9% of students. Looking for a moment at the minimum, it is also clear that there are students towards the bottom of the distribution who should benefit from not only the extra practice, but also the immediate feedback ASSISTments can provide and the extra attention given by a teacher who can see the numbers. These numbers make it clear that all of the students should benefit from using ASSISTments in addition to their normal class work to help them learn this material, which makes the benefits of running a study like this extend beyond the results for the researchers.
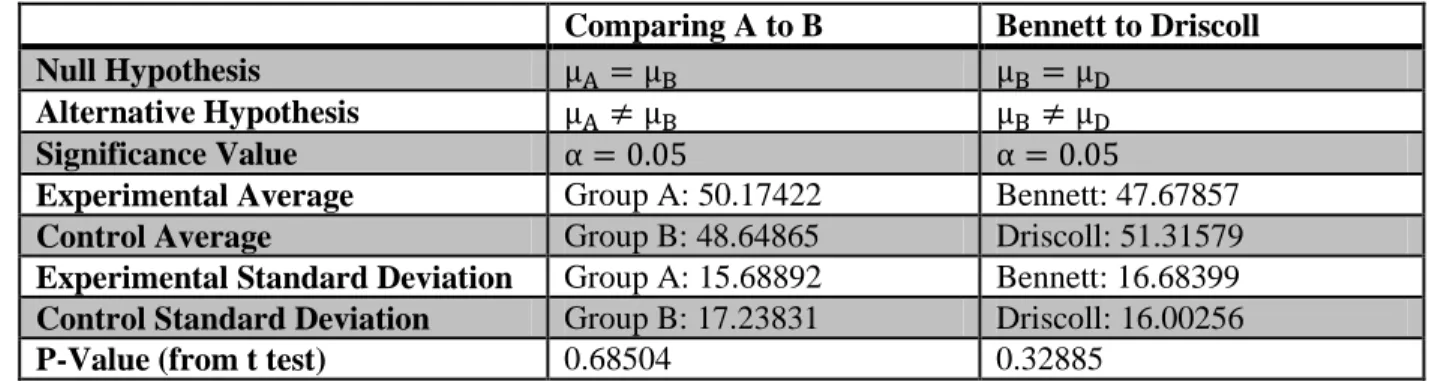
In order to confirm that the test and control groups, A and B, can be compared in the context of the study, a statistical hypothesis test is done. This is also done to check the similarity of Miss Bennett and Mr. Driscoll’s classes, as a significant divide between the classes’ abilities will affect whether or not the test and control groups within the classes can be combined. To start a hypothesis test, first a hypothesis is needed. Starting with the group comparison, the hypothesis is chosen as Group A is equal to Group B, with equal symbolizing equivalently skilled for the purposes of the study. An alternative hypothesis here is that they are not equal. A significance value of five percent is chosen, which equates to ninety-five percent assurance that what is determined is correct.
Once those things are determined, a t-test is run on the data in order to find a p-value to describe it. This is easily done with a dump of all of the data into an Excel sheet, which returns a p-value from its t-test function given the sets of data. This p-value is compared to the significance to
determine whether or not the null hypothesis is rejected. This is done for both comparing A to B as well as to see if Bennett is equivalent to Driscoll for this study.
Table 5: Statistical Hypothesis Test Necessary Data and T-test => P-Value Results
Comparing A to B Bennett to Driscoll
Null Hypothesis
Alternative Hypothesis
Significance Value
Experimental Average Group A: 50.17422 Bennett: 47.67857
Control Average Group B: 48.64865 Driscoll: 51.31579
Experimental Standard Deviation Group A: 15.68892 Bennett: 16.68399
Control Standard Deviation Group B: 17.23831 Driscoll: 16.00256
P-Value (from t test) 0.68504 0.32885
The t-tests yield the p-values listed, which can then be compared to the significance value chosen for the purposes of this study. This comparison shows that 0.68504 > 0.05 and
0.32885 > 0.05, therefore the null hypothesis is not rejected in either case. Given a lack of evidence to reject, it can be safely inferred that the null hypothesis can be accepted in this case, meaning that there is significant support of the way the students in both classes are grouped, as well as significant validity to results found from the administered tests in this study.
Looking at the breakdown of the scores by question, interesting things can be seen about the problems themselves and what kinds of predictions about the future of the study can be made. For example, the three lowest averages of correctness are on three of the four questions about prerequisite skills. On the other hand, more than seventy-five percent of students correctly answered three of the core skill questions, one of which ninety-one percent answered correctly. It is possible that the low scores on the prerequisites were due to a large time gap between the most recent study of those skills and the time of the test for the students. It is also possible that
previous exposures to core materials, including some crossover on topics in other CMP books, could have been the cause of high scores in the core material.
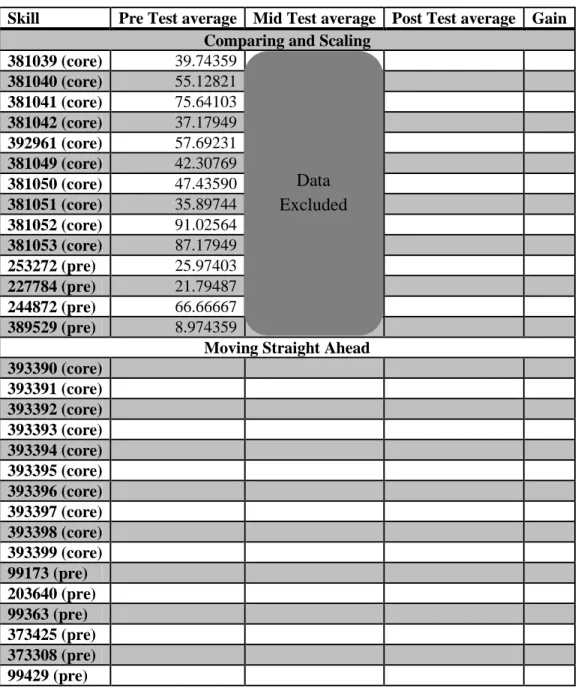
Between the results yet to be collected from this short study and the future results of a year long iteration of the study, there is a lot of room for more substance to be added to the results. Data from both the Mid Test and the Post Test will be collected and added to Table 6 below as well as analyzed in a number of ways independently. This will allow for researchers taking on the study going forward to try to draw connections and make conclusions about the study and what
ASSISTments has to offer to students in this regard. With that future data, it will be possible to chart students’ progress to look at the effect of the prerequisite skillbuilders on the core skills. It will be possible to test whether or not the classes and groups remain comparable, like they were shown to be above, throughout a long term study. It will be possible to increase or decrease practice for students if it helps them to learn the core material better. After a long term study, it will be possible to compare the results of the long term study against those of this short term study to see if the prerequisite practice helps more over a longer period of time. Additionally, the performance for all of the prerequisite skills could help researchers and ASSISTments staff to make recommendations for focus on topics students are not performing well on earlier in their academic careers. There is a lot of potential with this data and more so once addition data is collected as the study continues.
It is worth mentioning here that in the current unit, Comparing and Scaling, the Mid Test data will be excluded from consideration due to problems with the assignment of the test. Some of the students took the Mid Test before they should have for the purposes of the study, and to avoid excluding a lot of students, the Mid Test data will be excluded instead. Fortunately this is not something that should skew the study adversely, as the change from the Pre to Post tests is what
is largely important. Of course any study taking place in an environment like middle school is going to have hiccups like these, largely due to unexpected behavior unrelated to the study coming into play. Here that unexpected behavior was students simply moving on too quickly.
Table 6: Averages of Individual Skills in the Tests
Skill Pre Test average Mid Test average Post Test average Gain
ComparingandScaling
381039 (core) 39.74359 381040 (core) 55.12821 381041 (core) 75.64103 381042 (core) 37.17949 392961 (core) 57.69231 381049 (core) 42.30769 381050 (core) 47.43590 381051 (core) 35.89744 381052 (core) 91.02564 381053 (core) 87.17949 253272 (pre) 25.97403 227784 (pre) 21.79487 244872 (pre) 66.66667 389529 (pre) 8.974359
Moving Straight Ahead 393390 (core) 393391 (core) 393392 (core) 393393 (core) 393394 (core) 393395 (core) 393396 (core) 393397 (core) 393398 (core) 393399 (core) 99173 (pre) 203640 (pre) 99363 (pre) 373425 (pre) 373308 (pre) 99429 (pre) Data Excluded
Conclusions and Recommendations
At the time of writing, there are not many conclusions easily reachable, given the small amount of data available. The data so far tells a short story, but one that has no middle or end yet, and will need to be filled in by researchers taking over on this going forward. The data collected so far does show us that there is a need for more practice on problems not just in the core skillset of the unit but on skills students should already have by now. Considering some of the low scores on prerequisites, it is clear that even the students at the top of the classes, who do not typically struggle with the material, are not remembering the skills from previous years that are essential to learning the new units. Between indicating that even those students at the top need help, and keeping track of the kids who score the lowest to show teachers that they also need help, ASSISTments and this study have a lot to offer these students. More than the students in the classes now, this study and the results taken from it have the potential to help future generations of students entering this unit, as the results of this study could impact how core units and the homework assigned for them is structured.
There will be other researchers who will take this on and run this study again, as early as next year, to do a long term version for the entire year with the students. This project has been largely about setting things up for these other researchers to take over, and they will be able to take this work as a template for how to run it in the future. They will be able to fill in the tables in this very report if need be to finish this study out and when they run it again. The content built for this project, all of which is in the Appendices below, will be used and assigned to students in the way that was set up here for this small study. There are even marketing materials in the form of a slideshow, in Appendix D, which will likely be used to get more schools on board for a larger study in the future.
In both the study being run now, as well as the larger future study, a procedure will be followed for each unit. It will be best to keep tightly to this procedure for the sake of consistency of the data. The procedure is listed in Table 7 below, with check marks indicating what steps have been completed so far for Comparing and Scaling, and will be followed with Moving Straight Ahead.
Table 7: Steps for Each Unit, with Progress for Current Unit (Comparing and
Scaling)
Complete Steps to Complete
Assign all of the material in ASSISTments necessary for study Give participating teachers instructions for how to proceed
Have teachers assign Pre Test
The teachers assign skillbuilders one or two weeks before beginning the unit Just before the unit begins, teachers give Mid Test
The unit is taught
At the end of the unit, the Post Test is given Collect/collate all data from this unit
Repeat for next unit
Getting more schools on board to participate is key. As with any study, the results have that much more impact when the population size is as large as possible. Of course, keeping track of comparing many more schools with many more students will mean things like the statistical hypothesis testing will be incredibly important and likely done multiple times just at the beginning. This is especially true if schools from across the nation are used, to be sure that they are comparable enough to look at together. Considering different background and cultures, this may actually not be the case, and researchers may need to account for that in some way. With
ASSISTments reaching students nationwide, including other parts of the country is important because if there are regional needs of students, that has to become clear to ASSISTments administrators. It would be easier to make arrangements and cater learning to students in other parts of the country if studies have demonstrated a need to.
References
1. Schneider, S (2012). Accessed 1/28/13 at http://www.iesmathcenter.org/home/index.php. 2. Kelly, Kim, Neil Heffernan, Cristina Heffernan, Susan Goldman, James Pellegrino, and
Deena Soffer Goldstein. Estimating the Effect of Web-Based Homework. Publication. N.p., n.d. Web. 18 Feb. 2013.
Appendices
Appendix A: Documentation & Problem Sets Created by Brent McGrath
This appendix contains all of the documentation for the assistment parent templates created by Brent McGrath for the problem sets used in the study. Following the documentation, example instances of the parent assistments found in each problem set are shown. Sample problem sets were created in order to provide an example of each type of assistment used in each problem set for the various skills.
Skills Links
Table http://goo.gl/izR0N (DOC)
http://goo.gl/2BYs7 (Sample Problem Set Print)
Interpret Data http://goo.gl/KLlun (DOC)
http://goo.gl/5qxQq (Sample Problem Set Print)
Interpreting Coordinate Graphs http://goo.gl/3OYLp (DOC)
http://goo.gl/wAlMr (Sample Problem Set Print)
Similar Figures http://goo.gl/6zCPW (DOC)
http://goo.gl/Yh7RV (Sample Problem Set Print)
Appendix B: Documentation & Problem Sets Created by James Beaulieu
This appendix contains all of the documentation for the different assistment types created by James Beaulieu, which were used in the study. The documentation of the assistments used in each problem set is followed up by visuals of the assistments from the student perspective.
Skills Links
Equally Likely http://goo.gl/svwb0 (DOC)
http://goo.gl/YGgG1 (Sample Problem Set Print)
Bar Graphs http://goo.gl/dNLTY (DOC)
http://goo.gl/jrbfO (Sample Problem Set Print)
Scale Factor http://goo.gl/pWtjg (DOC)
http://goo.gl/kTKMZ (Sample Problem Set Print)
Writing Equations http://goo.gl/XeyAg (DOC)
http://goo.gl/zesqp (Sample Problem Set Print)
Parallel and Perpendicular Lines http://goo.gl/ZCJgi (DOC)
Appendix C: Pre Test Data Spreadsheet
This appendix provides the spreadsheet which contains all of the data collected from the completion of the Pre Test by the two experimental groups in the study.
Link: http://goo.gl/GPDRH (pdf)
Appendix D: Powerpoint Advertisement for Study
This appendix contains the powerpoint which was made to advertise the on-topic and off-topic skill problem sets created for the long term CMP2 study.
Links: http://goo.gl/zPBzF (pdf)
http://goo.gl/AdQRm (Presentation)
Appendix E: CMP Test Questions Created by the Math Center
The National Research & Development Center on Cognition & Mathematics Instruction, aka the Math Center, created test questions based upon the data collected from the CMP
Curriculum. The test questions were integrated into ASSISTments and are shown here. See Figure 1 for CMP Test Questions, which can be found in the Pre Test Problem Sets.
Appendix A: Documentation & Problem Sets Created by Brent McGrath
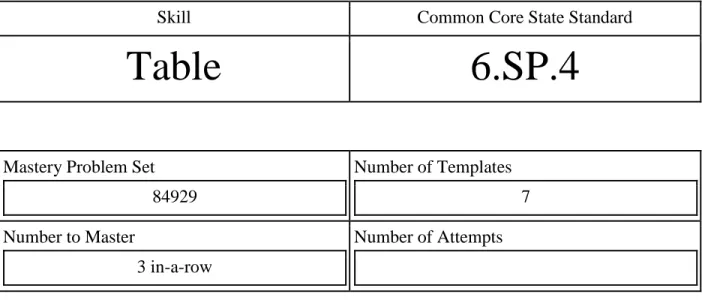
Appendix A.1.1: Table Skill Documentation
Skill Common Core State Standard
Table
6.SP.4
Mastery Problem Set 84929 Number of Templates 7 Number to Master 3 in-a-row Number of Attempts
Assistment Templates:
337379
14 instances
337432
14 instances
337455
14 instances
341667
14 instances
341890
14 instances
342423
14 instances
343241
14 instances
Templates:
337379
● The above problem is a variabilized template.
● The people participating in the race are selected from a set of strings, including: students, runners, athletes, and friends.
● The race participants listed in the table: Matt, Fred, Cassie, Mary, Todd, Marcus, and Rachel are not variabilized.
● All of the race times in the table are random values that can range from 2.00 to 9.99. However, in any instance the times will only vary by 0.99. Therefore the actual range of the values shown in the problem can be 2.00 - 2.99, 3.00 - 3.99, etc. for any instance. ● The name of the race participant, whom the student is asked to write his/her race time
into the answer field is selected from a set of strings, including: Matt, Fred, Cassie, Mary, Todd, Marcus, and Rachel.
● Therefore any of the seven racers can be stated within the problem for the student to type in his/her corresponding race time.
337432
● The above problem is a variabilized template.
● The friends listed in the table: Jared, Emily, Francisco, Stephanie, and Ashley are not variabilized.
● The numbers for the number of text messages received by each friend is a random number from 6 to 35.
● The numbers for the number of emails received by each friend is a random number from 8 to 30.
● The name of the person, whom the student is asked to write how many text messages he/she received into the answer field is selected from a set of strings, including: Jared, Emily, Francisco, Stephanie, and Ashley.
● The student will always be asked to answer the number of text messages a specific person received.
337455
● The above problem is a variabilized template.
● The friends listed in the table: Jared, Emily, Francisco, Stephanie, and Ashley are not variabilized.
● The numbers for the number of text messages received by each friend is a random number from 6 to 35.
● The numbers for the number of emails received by each friend is a random number from 8 to 30.
● The name of the person, whom the student is asked to write how many emails he/she received into the answer field is selected from a set of strings, including: Jared, Emily, Francisco, Stephanie, and Ashley.
● The student will always be asked to answer the number of emails a specific person received.
341667
● The above problem is a variabilized template.
● The friends class subjects listed in the table under Class Subjects do not change, therefore the nonvariabilized class subjects are always: Math, Science, English, and History. ● The numbers for all of the percentages are based upon the class having 100 total students
and a specific number of them are male and female.
● The number of males is a random number between 20 and 80. Therefore the number of
females is calculated by taking the number of males and subtracting it from 100. ● In order to determine the number of people who enjoy each subject, the number is
randomly generated based upon a fourth of the total gender in the class and the lowest is a base of 2. Therefore for the Males’ Math, Science, and History class subjects range from 2 to ¼ of the entire male gender in the class plus 1 and the Females’ Math, History, and English class subjects range from 2 to ¼ of the entire female gender in the class plus 1.
● The percentages for each class subject are directly representative of the number of people who enjoyed each subject the most because the number of people who enjoyed each subject the most is divided by the total number of students of that gender in the class multiplied by 100 to get a percent.
● The percentage of a gender that the question is asking you to look for can be either male or female.
● The class subject being asked about within the question can change between the four different class subjects: Math, Science, English, and History.
● The answer can be written as the percentage value with or without the % sign. ● The answer is formatted as Algebra.
341890
● The above problem is a variabilized template.
● The months and days listed in the first column of the table are both variabilized.
● The month comes from a set of strings, which includes the months: September, October, November, December, January, February, and March.
● The days can range from 1 to 29, to allow for any possible week combination in any of the months listed, including February on a leap year.
● All of the temperature values are randomized and are all interrelated to one another. The base temperature can be seen at the second temperature which is a number from 3 to 30. All of the other temperatures are increased in a specified order, which appears random to the students. Therefore I could allow the temperatures to all be unique values and could all be realistic.
● The degree asked for in the question to the student can come from any of the temperatures in the second column of the table.
● The answer for the month and date of the asked temperature will always be the month and day to the left of the temperature value in the table.
● The student needs to capitalize the month in the answer, but a month and day with no spaces and a month and a day with one space is accepted as a correct answer.
342423
● The above problem is a variabilized template.
● The item being sold as a handcrafted souvenir in the museum gift shop is a string within a set, which includes: mugs, glasses, banners, blankets, necklaces, and wallets.
● The unit price of each item is a random number from $5.00 to $9.99.
● Each of the following prices after the first one, is an integer multiple of the individual price for the item. Therefore the second item is the individual price multiplied by 2, the third item is the individual price multiplied by 3, and so on.
● The number of items asked for in the question within the problem, which the student is supposed to figure out the price for is a random number between 1 and 6.
● The item also being asked for in the question within the problem can be any of the six items listed above.
● Therefore the answer is always the dollar amount of the correct corresponding number of the stated item within the problem. The student is reminded not to include a dollar sign in his/her answer.
343241
● The above problem is a variabilized template.
● The five different types of animals in the problem is always constant and they are: Dogs, Cats, Fish, Birds, and Rabbits.
● The number of pets for each class are completely randomized, but each type of pet has a different randomized range.
● The number of Dogs per class is a random number from 6 to 35. ● The number of Cats per class is a random number from 6 to 35. ● The number of Fish per class is a random number from 3 to 14. ● The number of Birds per class is a random number from 2 to 9. ● The number of Rabbits per class is a random number from 2 to 9.
● The type of animal asked for in the question within the problem, is a string within a set that can be one of the following: dogs, cats, fish, birds, or rabbits.
● The Class also being asked for in the question within the problem can be any of the three classes, therefore the question will ask for Class One, Class Two, or Class Three.
Appendix A.2.1: Interpret Data Skill Documentation
Skill Common Core State Standard
Interpret Data
6.SP.4
Mastery Problem Set 85018 Number of Templates 20 Number to Master 3 in-a-row Number of Attempts
Assistment Templates:
Table
356713
4 instances
356714
4 instances
356715
4 instances
356717
4 instances
Stem and Leaf Plot
355803
4 instances
356198
5 instances
356232
5 instances
357972
5 instances
Line Plot
334250
4 instances
338607
4 instances
338654
4 instances
338663
4 instances
Box and Whisker
Circle Graph
355780
8 instances
355791
8 instances
Bar Graph
358531
3 instances
358589
3 instances
358601
4 instances
361959
3 instances
361960
3 instances
Templates:
356713
● The above problem is a variabilized template.
● The people participating in the race are selected from a set of strings, including: students, runners, athletes, and friends.
● The race participants listed in the table: Matt, Fred, Cassie, Mary, Todd, Marcus, and Rachel are not variabilized.
● All of the race times in the table are random values that can range from 2.00 to 9.99. However, in any instance the times will only vary by 0.99. Therefore the actual range of the values shown in the problem can be 2.00 - 2.99, 3.00 - 3.99, etc. for any instance. ● The problem body will ask for the name of the person who either had the slowest race
time or the fastest race time.
● In the problem body is guaranteed to only have one slowest time or one fastest time, based upon how the values for the times are calculated.
● The name of the race participant for the answer to the question in the problem body can be any of the following names: Matt, Fred, Cassie, Mary, Todd, Marcus, and Rachel. ● The correct answer can either be the capitalized version of the correct name or the all
lowercase version of the name. ● The answer is formatted as Fill In.
356714
● The above problem is a variabilized template.
● The friends listed in the table: Jared, Emily, Francisco, Stephanie, and Ashley are not variabilized.
● The problem body can either ask for the least number of text messages or the most text messages received by a friend.
● If the problem body asks for the most text messages, the friend with the maximum number of text messages can have a value between 18 and 36. All of the other numbers for the text messages received numbers by the other friends is based upon this value and is a random number from 0 to this max value minus 1.
● If the problem body asks for the least number of text messages, the friend with the minimum number of text messages can have a value between 0 and 11. All of the other numbers for the text messages received numbers by the other friends is based upon this value and is a random number between the minimum value plus 1 and 47.
● The numbers for the number of emails received by each friend is a random number from 8 to 30.
● Any of the names in the table of the problem body can be the correct answer to the question. Therefore the answers are: Jared, Emily, Francisco, Stephanie, and Ashley. ● The correct answer can either be the capitalized version of the correct name or the all
lowercase version of the name. ● The answer is formatted as Fill In.
356715
● The above problem is a variabilized template.
● The friends listed in the table: Jared, Emily, Francisco, Stephanie, and Ashley are not variabilized.
● The numbers for the number of text messages received by each friend is a random number from 6 to 35.
● The problem body can either ask for the least number of emails received or the most emails received by a friend.
● If the problem body asks for the most emails, the friend with the maximum number of emails can have a value between 16 and 28. All of the other numbers for the emails received by the other friends is based upon this value and is a random number from 0 to this max value minus 1.
● If the problem body asks for the least number of emails, the friend with the minimum number of emails can have a value between 0 and 9. All of the other numbers for the emails received by the other friends is based upon this value and is a random number between the minimum value plus 1 and 38.
● Any of the names in the table of the problem body can be the correct answer to the question. Therefore the answers are: Jared, Emily, Francisco, Stephanie, and Ashley. ● The correct answer can either be the capitalized version of the correct name or the all
lowercase version of the name. ● The answer is formatted as Fill In.
356717
● The above problem is a variabilized template.
● The months and days listed in the first column of the table are both variabilized.
● The month comes from a set of strings, which includes the months: September, October, November, December, January, February, and March.
● The days can range from 1 to 29, to allow for any possible week combination in any of the months listed, including February on a leap year.
● All of the temperature values are randomized and are all interrelated to one another. These values can appear in any row of the table at any time. The base temperature is a number from 3 to 30. All temperatures are unique values and are all realistic.
● The question asks for the student to either figure out what the coldest or hottest day during the seven day period was and type the correct month and day into the answer field. ● The student needs to capitalize the month in the answer, but a month and day with no
spaces and a month and a day with one space is accepted as a correct answer. ● The answer is formatted as Fill In.
355803
● The above problem is a variabilized template.
● The question in the problem body has the possibility of asking for each of the following: lowest number, greatest number, and mode.
● The item being sold by the store is variabilized and comes from a set of strings, including: shoes, clothes, sweaters, and glasses.
● The first stem is a random number from 1 to 5, while the other stems are incremented up by 1 for every successive stem below the first.
● The first row leaves are eight distinct random numbers ranging from 1 to 9. The values are always in increasing order.
● The second row leaves are four distinct random values ranging from 1 to 9. The values are always in increasing order.
● The third row leaves are two distinct random numbers ranging from 6 to 9. ● The fourth row leaves are 6 distinct random values ranging from 1 to 3.
● The lowest number is always the first leaf in the first row of the table, the greatest number is always the last leaf in the last row of the table, and the mode is always the greatest number in the table found in the last part of the fourth row.
356198
● The above problem is a variabilized template.
● The question in the problem body asks for the total count of the number of pieces of data found in the stem and leaf plot.
● The item being sold by the store is variabilized and comes from a set of strings, including: shoes, clothes, sweaters, and glasses.
● The first stem is a random number from 1 to 5, while the other stems are incremented up by 1 for every successive stem below the first.
● The first row leaves are eight distinct random numbers ranging from 1 to 9. The values are always in increasing order.
● The second row leaves are four distinct random values ranging from 1 to 9. The values are always in increasing order.
● The third row leaves are two distinct random numbers ranging from 6 to 9. ● The fourth row leaves are 6 distinct random values ranging from 1 to 3. ● The total count for this assistment is always 20.
356232
● The above problem is a variabilized template.
● The question in the problem body asks for the total number of weeks the selected item was sold, which is directly related to the number of pieces of data found in the stem and leaf plot.
● The item being sold by the store is variabilized and comes from a set of strings, including: shoes, clothes, sweaters, and glasses.
● The first stem is a random number from 1 to 5, while the other stems are incremented up by 1 for every successive stem below the first.
● The first, second, third, and fourth row of leaves are a variable length, which means each row can vary in the number of leaves shown. The rows are composed of seven distinct variables, where each variable is a set of values corresponding to multiple different stem and leaf plots and these variables have the possibility of being blanks. The rows will normally have between 3 and 7 leaves each.
● The leaves range in value from 0 to 9 and the leaf values are always in increasing order. ● This assistment can generate 10 different stem and leaf plots.
● The total number of weeks for the answer ranges between 18 and 27. ● The answer is formatted as Algebra.
357972
● The above problem is a variabilized template.
● The question in the problem body asks for the mode of the item sold each week that is represented as a stem and leaf plot.
● The item being sold by the store is variabilized and comes from a set of strings, including: shoes, clothes, sweaters, and glasses.
● The first stem is a random number from 1 to 5, while the other stems are incremented up by 1 for every successive stem below the first.
● The first, second, third, and fourth row of leaves are a variable length, which means each row can vary in the number of leaves shown. The rows are composed of seven distinct values, which are produced by a single variable. The single variable each row is a set of values, so each element is the row for a different stem and leaf plot. The rows will normally have between 5 and 7 leaves each.
● The leaves range in value from 0 to 9 and the leaf values are always in increasing order. ● This assistment can generate 10 different stem and leaf plots.
● The mode can appear in any of the four rows of the stem and leaf plot, depending on the stem and leaf plot produced.
355802
● The above problem is a variabilized template.
● The name that appears in the problem body is one of the names contained within a set of strings, including: Billy, John, Steve, David, Chris, Gary, and Ted.
● The item being sold is one of the items contained within a set of strings, including chocolate bars, apple pies, chocolate chip cookies, and cups of lemonade.
● The question in the problem body asks for one of the following pieces of data found in the box-and-whisker plot: sample minimum, lower quartile, median, upper quartile, and the sample maximum.
● The box-and-whisker plot image is a standard image that does not change with each instance.
● The data values seen on the number line of the box-and-whisker plot are multiplied by a scalefactor, which has the value of 2, 4, or 6.
● The lowest number represented on the number line of the box-and-whisker plot is a random value from 11 to 79.
● The values from left to right on the number line increment by 2 multiplied by the scalefactor for each number. Therefore the incrementation can be 4, 8, or 12. ● The answer is formatted as Algebra.
355780
● The above problem is a variabilized template.
● The question in the problem body asks for the category in the circle graph that has the greatest percentage.
● The assistment contains 10 different circle graphs, each with a different topic. Therefore the problem body will change its topic wording depending on what circle graph is produced in the problem body.
● The percentages in each category of the circle graphs will change with each new instance and the number of categories in the circle graph will also change. The number of
categories ranges from 4 to 8.
● The category with the greatest percentage will change with each new instance, but it will always be the largest section of the circle graph.
355791
● The above problem is a variabilized template.
● The question in the problem body asks for the category in the circle graph that has the lowest percentage.
● The assistment contains 10 different circle graphs, each with a different topic. Therefore the problem body will change its topic wording depending on what circle graph is produced in the problem body.
● The percentages in each category of the circle graphs will change with each new instance and the number of categories in the circle graph will also change. The number of
categories ranges from 4 to 8.
● The category with the lowest percentage will change with each new instance, but it will always be the smallest section of the circle graph.
358531 & 358589
● This is a variabilized template.
● The student is asked about the results of a contest. ● Image is a variabilized image of seven possible images.
● The setup is the same, but there are a set of brother and sisters, variabilized with the images, as well as the answers.
● 358531 asks for the winner, 358589 asks for the loser ● The question is formatted as a Multiple Choice.
358601
● This is a variabilized template.
● The student is asked to look at sales figures on a bar graph. ● The image is variabilized with five possible images.
● The set-up is the same, but the owner’s name and the instrument and year in question change with the image.
361959
● This is a variabilized template.
● The student is asked to look at sales figures on a bar graph. ● The image is variabilized with five possible images.
● The set-up is the same, but the owner’s name and the year in question changes with the image.
361960
● This is a variabilized template.
● The student is asked to look at sales figures on a Bar Graph. ● The image is variabilized with five possible images.
● The set-up is the same, but the owner’s name and the instrument in in question change with the image.
Appendix A.3.1: Interpreting Coordinate Graphs Skill Documentation
Skill Common Core State Standard
Interpreting
Coordinate Graphs
Mastery Problem Set85019 Number of Templates 15 Number to Master 3 in-a-row Number of Attempts
Assistment Templates:
354620
7 instances
356699
7 instances
354979
7 instances
356700
7 instances
355325
7 instances
356701
7 instances
355469
7 instances
356702
7 instances
355032
14 instances
355037
7 instances
355039
7 instances
355409
5 instances
357963
5 instances
357964
5 instances
368151
5 instances
Templates:
354620
● The above problem is a variabilized template.
● The student is asked to give the proper