Worcester Polytechnic Institute
Digital WPI
Interactive Qualifying Projects (All Years) Interactive Qualifying Projects
May 2009
Mastery Learning in Cognitive Computer Tutors
Anas B. MaghfurWorcester Polytechnic Institute
Billy Zhong
Worcester Polytechnic Institute
Christopher Michael Gamache
Worcester Polytechnic Institute
Follow this and additional works at:https://digitalcommons.wpi.edu/iqp-all
This Unrestricted is brought to you for free and open access by the Interactive Qualifying Projects at Digital WPI. It has been accepted for inclusion in Interactive Qualifying Projects (All Years) by an authorized administrator of Digital WPI. For more information, please [email protected]. Repository Citation
Maghfur, A. B., Zhong, B., & Gamache, C. M. (2009).Mastery Learning in Cognitive Computer Tutors. Retrieved from https://digitalcommons.wpi.edu/iqp-all/1197
1
Mastery Learning
An Interactive Qualifying Project Report: Submitted to the Faculty
of the
WORCESTER POLYTECHNIC INSTITUTE In partial fulfillment of the requirements for the
Degree of Bachelor of Science By
__________________________ __________________________ Christopher M. Gamache Billy Zhong
__________________________ Anas Maghfur
Date: May 5, 2009 Advisors:
__________________________ Professor Neil Heffernan
2
ABSTRACT
The ASSISTment is a cognitive computer tutoring system targeted towards middle school math students. Mastery learning was recently implemented into the system. This paper focuses on the effectiveness of mastery learning in the ASSISTment system. Results from a controlled experiment conducted in middle schools did not show significant results that mastery learning in the ASSISTment is effective. However, case studies of certain test subjects suggest that mastery learning could be effective for certain kinds of students. Hence, further work needs to be done on only certain kinds of students, particularly low achieving students.
3
Table of Contents
ABSTRACT ... 2
1. LITERATURE REVIEW ... 8
1.1 Meta-Analysis of Mastery Learning ... 8
1.2 Mastery Learning in Cognitive Computer Tutors ... 11
1.2.1 Model Tracing ... 12
1.2.2 Cognitive Mastery Learning ... 12
1.2.3 Cognitive Mastery Learning with Augmented Support ... 13
1.2.4 Aggregate Effect of the Three Instructional Interventions ... 13
1.3 Literature Review Conclusion ... 13
2. IMPLEMENTATION ... 14
2.1 Introduction ... 14
2.2 What is Variabilization? ... 15
2.3 Design of Variabilized Templates ... 16
2.4 Instantiated Assistments ... 19
2.5 Incorporating Variabilization with Mastery Learning ... 21
2.6 Content Walkthrough ... 22 2.6.1 Assistment #30059 ... 22 2.6.2 Assistment #30799 ... 24 2.6.3 Assistment #30060 ... 26 3. EXPERIMENT ... 29 3.1 Hypothesis ... 29
4
3.2 Overview ... 30
3.3 The Experiment ... 31
4. ANALYSIS & RESULTS ... 34
4.1 Experiment 1 ... 34
4.1.1 Results ... 34
4.1.2 Analysis ... 34
4.1.3 Special Problem Case 1 ... 35
4.1.4 Special Problem Case 2 ... 37
4.1.5 Special Student Case 1 ... 39
4.1.6 Special Student Case 2 ... 40
4.1.7 Conclusion ... 40
4.2 Experiment 2 ... 41
4.2.1 Results ... 41
4.2.2 Analysis ... 41
4.2.3 Special Problem Case 1 ... 42
4.2.4 Special Student Case 1 ... 43
4.2.5 Special Student Case 2 ... 43
4.2.6 Conclusion ... 45
4.3 Experiment 3 ... 45
4.3.1 Results ... 45
5
4.3.3 Special Problem Case 1 ... 46
4.3.4 Special Problem Case 2 ... 48
4.3.5 Special Student Case 1 ... 50
4.3.6 Special Student Case 2 ... 51
4.3.7 Conclusion ... 52
4.4 Experiment 4 ... 53
4.4.1 Results ... 53
4.4.2 Analysis ... 53
4.4.3 Special Problem Case 1 ... 54
4.4.4 Special Problem Case 2 ... 55
4.4.5 Special Student Case 1 ... 58
4.4.6 Special Student Case 2 ... 60
4.4.7 Conclusion ... 61
5. DISCUSSION ... 62
5.1 Experiments ... 62
5.2 Variabilized Mastery Learning ... 63
6. CONCLUSION ... 64
6.1 Implications ... 65
6.2 Implications for WPI ... 66
7. REFERENCES... 67
6
8.1 Experiment One Table ... 67
8.1.1 Part One... 67
8.1.2 Part Two ... 70
8.1.3 Part Three ... 72
8.1.4 Part Four ... 75
8.2 Experiment Two Table ... 77
8.2.1 Part One... 77
8.2.2 Part Two ... 80
8.2.3 Part Three ... 82
8.2.4 Part Four ... 85
8.2.5 Part Five ... 87
8.3 Experiment Three Table ... 90
8.3.1 Part One... 90
8.3.2 Part Two ... 92
8.3.3 Part Three ... 94
8.3.4 Part Four ... 97
8.4 Experiment Three Table ... 99
8.4.1 Part One... 99
8.4.2 Part Two ... 102
7
8.4.4 Part Four ... 107
8.5 Moving Straight Ahead ... 109
8.5.1 Moving Straight Ahead Problem sets... 109
8.5.2 Moving Straight Ahead Mastery Learning ... 157
8.6 Data Analysis ... 295
8.6.1 Data Analysis Problem sets ... 295
8.6.2 Data Analysis Mastery Learning ... 339
8.7 Variables and Patterns ... 477
8.7.1 Variables and Patterns Problem sets ... 477
8.7.2 Variables and Patterns Mastery Learning ... 499
8
1. LITERATURE REVIEW
Mastery learning is the new feature we intend to implement into our ASSISTment intelligent tutoring system. Our literature review shows that mastery learning in cognitive computer tutoring systems can have significant positive effects on student achievement.
1.1 Meta-Analysis of Mastery Learning
Mastery learning is the idea that virtually all students can achieve expertise in a field if the field is analyzed into a hierarchy of component skills and the students must master prerequisite skills before moving on to higher level skills. Two forms of mastery learning were developed: (1) Bloom‟s “learning for mastery” (LFM), where a group of students move through a curriculum together and individual students get extra assistance as needed and (2) Keller‟s “personalized system of instruction” (PSI), where students move through the curriculum at their own pace.
In Kulic & Kulic‟s “Effectiveness of Mastery Learning Programs: A Meta-Analysis”, Kulic & Kulic showed that mastery learning programs does indeed have positive effects on student
achievement.Such programs were found to raise final examination scores by an average of about 0.5 standard deviations, or from the 50th to the 70th percentile, in school levels ranging from upper grades of grade school to college. In the meta-analysis, some types of studies had very large effect sizes. Studies with large effect sizes, first of all, tend to come from to those that involved teaching in the social sciences rather than in mathematics, the natural sciences, or humanities. Second, the studies with large effect size tend to use locally developed rather than nationally standardized tests as criterion measures of student achievement. Third, the mastery programs in studies with large effect sizes require
9
students to move through course material at teacher's pace as oppose to individual student rates.Fourth, the mastery programs in these studies have higher achievement standards, that is, students are required to perform at a high level on unit quizzes (e.g., 100% correct) before being able to proceed to the next unit. And fifth, in studies that report strong effects, control students receive less quiz feedback than experimental students do. In fact, having the same amount of quiz feedback for experimental and control students reduces the effect size.
The meta-analysis also suggests that effects of mastery programs differ between high and low aptitude students. Both types of students gain from mastery programs, but low aptitude students tend to gain more. The average improvement in scores of high aptitude students is 0.40 standard deviations; the improvement of low aptitude students is 0.61 standard deviations. With low aptitude students attaining higher gains, mastery programs may smooth out differences between high and low aptitude learners. This is supported by the fact that variation in final examination scores is smaller in mastery classes than in other classes, and the correlation between aptitude and achievement is also reduced in mastery classes.
The benefits of mastery programs appear to be relatively enduring, not just short-term, effects. This is evident in studies that have follow-up examinations as well as end-of-instruction examinations. Mastery learning programs also seem to have a positive effect on student attitudes. Mastery students are more satisfied with the instruction they receive and more positive toward the content they are taught than are students in conventional classes.
10
with course completion. Fewer students in mastery learning classes that follow the PSI format complete their class than those in conventional classes. Although the difference in percentage of completion is not large and the difference is not found in every PSI study, the finding is common enough to be a concern. Surprisingly, the effect of PSI on course completion does not appear to be related to its effect on student achievement. Examination scores in PSI classes with below-average completion rates are still comparable to PSI classes with normal and even above-average completion rates.
The meta-analysis also suggests that mastery classes make greater demands on student time than do conventional classes. Two points should be kept in mind about these time demands, however. First, the increase in student workload in mastery programs is, on the average, relatively modest in size. Kulic & Kulic believes that most teachers will find this increase in student workload to be a reasonable one, given the gain in learning that is likely to result from it. Second, the best available data suggests that an increase in examination score is not a result from an increase in instructional time alone. Mastery programs produce larger effects on examination scores with far smaller commitments of instructional time.
It should also be noted that the findings of this analysis are consistent with predictions of mastery theory. The meta-analysis found that mastery learning predicts higher examination scores, reduced variation in examination scores, and more positive academic attitudes with mastery teaching. The effects, however, were not as large as those sometimes claimed for mastery procedures (it is often cited to be able to produce an increase of 2 standard deviations). Such a predicted effect is far larger than the increase of 0.5 standard deviations found in this meta-analysis. Even though an improvement of 0.5 standard deviations may fall far below expectations, it is nonetheless a relatively strong one for
11
an educational effect. Therefore it makes sense to try to implement it into cognitive computer tutors which may be able to replace the more expensive individual human tutoring without sacrificing effectiveness.
1.2 Mastery Learning in Cognitive Computer Tutors
In Corbett's "Cognitive Computer Tutors: Solving the Two-Sigma Problem", Corbett examined the achievement effect size of mastery learning in a cognitive computer tutoring system. His findings suggest that cognitive tutors have closed the gap with and arguably surpass human tutors. The cognitive computer tutor he used is the APT Lisp Tutor from Carnegie-Mellon's Human-Computer Interaction Institute.
APT, like all cognitive tutors, is constructed around a cognitive model of the knowledge students are acquiring. APT uses this knowledge for two purposes: model tracing and knowledge tracing. Knowledge tracing is the process in which the tutor tracks the student's growing problem solving knowledge across problems. In cognitive mastery learning, the student completes an
individualized sequence of problems in each curriculum section until “mastering” each of the cognitive problem solving rules introduced in the section; hence cognitive mastery learning is essentially
knowledge tracing.
Corbett examines three studies of cognitive model-driven instructional interventions that APT, like cognitive computer tutors, uses. The three instructional interventions are (a) model tracing, (b) cognitive mastery learning and (c) cognitive mastery learning with augmented support (scaffolding and step-by-step feedback). He then proceeds to calculate the effect size of each intervention and examines
12
the aggregate effect of these student-adapted interventions.
1.2.1 Model Tracing
Model tracing is the process in which the "cognitive model enables the tutor to trace the student's solution path, providing immediate step-by-step feedback on problem solving actions and advice on steps that achieve problem solving goal". (Corbett) In Corbett's study, he uses the APT Lisp Tutor with model tracing turned on for the experimental group and model tracing turned off for the control. Students in the control group instead were given problem sets with answers (no step-by-step solution) so that it was similar to doing practice problems. Model tracing yielded an achievement effect size of +0.75 SD compared to the conventional problem solving condition. Students in the model tracing condition finished the fixed problem set in 1/3 the time required by students in the conventional group.
1.2.2 Cognitive Mastery Learning
A second study compared students working through the APT Lisp Tutor with just model tracing to students working with both model tracing and cognitive mastery learning. Students in the model tracing comparison group completed a fixed set of programming problems. Students in the cognitive mastery condition completed this fixed set plus additional problems as individually needed in each curriculum section to master the cognitive programming rules introduced in the section. Cognitive mastery yielded an achievement effect size of +0.89, compared to model tracing. However, students in the cognitive mastery condition had to complete 40% more problems than students in the fixed
curriculum condition and therefore spent about 15% more time in the program than students in the fixed curriculum condition.
13
1.2.3 Cognitive Mastery Learning with Augmented Support
In a recent study, Corbett compared the standard cognitive mastery learning condition (as in the previous study) with cognitive mastery learning that has augmented support (scaffolding only). The achievement effect size of the cognitive mastery learning with the augmented support was +0.42 SD. Furthermore, students in that condition reached mastery in about 25% less time than the condition without the augmented support.
1.2.4 Aggregate Effect of the Three Instructional Interventions
Corbett calculated that the aggregate effect size of the three instruction interventions (model tracing, cognitive mastery learning and cognitive mastery learning with augmented support) to be 1.76 SD. This is virtually as large as that obtained by the best human tutors. Even with the extra time cost of cognitive mastery, students would be finishing in no more than 40% the time required due to the help of augmented support and model tracing. So by integrating mastery learning into cognitive computer tutoring systems, the empirical evidence that Corbett presented suggest that it is almost possible to solve Bloom's "two-sigma problem", which states that students provided with individual tutors typically perform at a level about two standard deviations (two "sigma‟s") above where they would perform with ordinary group instruction.
1.3 Literature Review Conclusion
After reviewing Kulic & Kulic's meta-analysis of mastery learning and Corbett's examination of mastery learning in cognitive computer systems, it is clear that implementing mastery learning is the next step in developing our ASSISTment intelligent tutoring system.
14
2. IMPLEMENTATION
2.1 Introduction
As mentioned before, the method that we will use to improve ASSISTment‟s tutoring system is Mastery Learning. However, Mastery Learning requires that we generate a large number of
Assistments so that the student can repeatedly tackle different problems. In general we need roughly about 20 to 40 Assistments per mathematical skill. Each Assistment also must have a different answer so the student cannot use the same answer every time. With the old traditional format where we manually generate one Assistment at a time for the students to take, it is extremely difficult to make enough Assistments for our Mastery Learning system. The way to solve this is to use another method; one that allows us to generate Assistments artificially through coding. Thus in order to generate large amounts of Assistments, we used a method that we refer to as, “Variabilization.”
15
2.2 What is Variabilization?
In the Assistments world, it is the use of variables to hold a selected range of numbers, or to set numbers or words in a particular order. Instead of manually creating Assistments, we only have to create one template that can generate multiple Assistments. Depending on the skill that the Assistment reviews, on average one variabilized Assistment can produce up to 50 Assistments, each with different numbers, and answers. We typically referred to these generated Assistments as Instantiated
Assistments. Even though we can generate that many Assistments, we only use about 30 of them. Furthermore, each generated Assistment retains the same content as its parent, which is the template. Overall instead of manually making 30 Assistments, we only have to make one variabilized template.
16
2.3 Design of Variabilized Templates
There are two types of variables that we commonly use in variabilization, a random variable, and a set variable. To create a random variable, we took advantage of a command called “rand().” The way we incorporated this command into a template is shown on the following figure.
Figure 2.1 Randomized Variables
From the above figure, variables, “variable1”, “variable2”, and “variable3” can all generate a random number that ranges from 0-8. Basically we can make use of these variables to manipulate the numbers in a problem. For example, we can change all the numbers in a stem and leaf type problem, so that the answer is always different for each Assistment. Another benefit of this is that it also prevents cheating. The second type of variables we use is set variables. These are variables that allow for numbers or words to always occur together for a particular Assistment. A clearer example of this is shown on Figure 2.2.
17
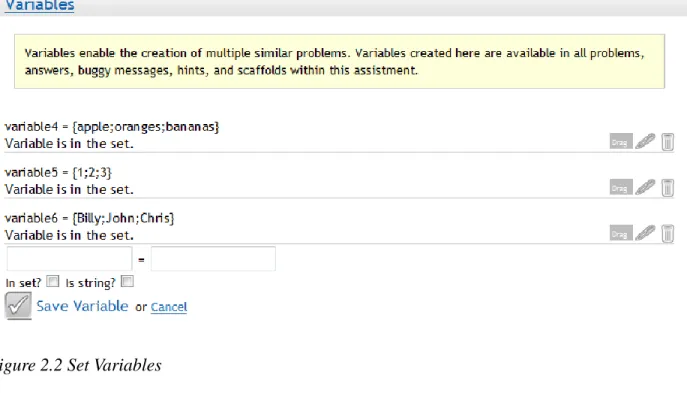
Figure 2.2 Set Variables
From the above figure, since variables “variable4”, “variable5”, and “variable6” are in a set, the values that these variables hold occur together. So, “apple, 1, Billy” will always be shown together in one Assistment, as will “oranges, 2, John”, and “bananas, 3, Chris.” This gives us further control over the numbers that occur in the generated Assistments. For example, if we want to make an Assistment that focuses on division and “non-decimal” answers, then we will use set variables. If we know what numbers will occur together, then we can manipulate the numbers in such a way that the answer is a non-decimal number. Also, we cannot use random variables in this case, since they have a chance of producing an answer that is a decimal.
With the above two forms of variables, we can easily create templates that can generated many different Assistments. A simple “rand(9)” variable can already create up to 9 different Assistments, so with variabilization it is very easy to generate many Assistments. Here is a look of how the main problem of a variabilized template would look like.
18
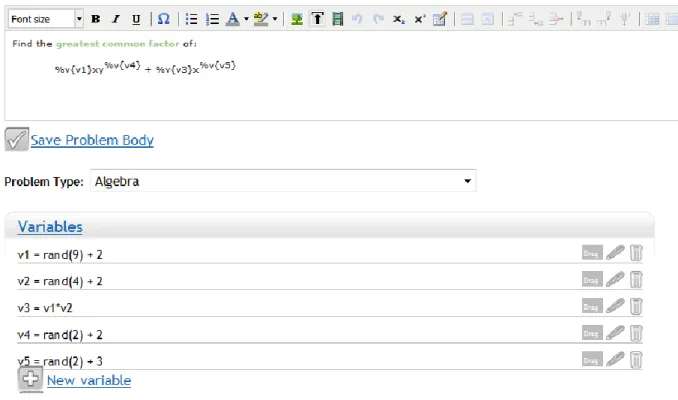
Figure 2.3 Main Problem of Assistment #43052
In order to use these variables in the main problem, hints, or scaffolds, we have to add “%v{}” to the variable name so that Assistments can decipher between variable names, and regular names. Now that we can create the templates, how will it generate Assistments?
19
2.4 Instantiated Assistments
It is actually very easy to generate Assistments through the variabilized templates. Literally, it can be done with a click of a button.
Figure 2.4 Generating Instantiated Assistments
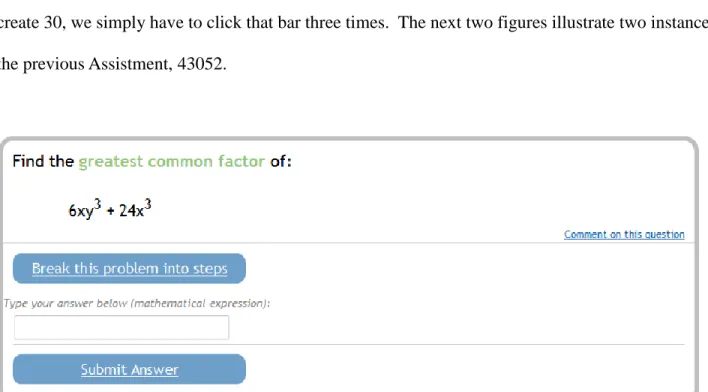
By clicking the above bar, the system will automatically generate 10 Assistments. Since we want to create 30, we simply have to click that bar three times. The next two figures illustrate two instances of the previous Assistment, 43052.
20
Figure 2.6 2nd Instance of Assistment #43052
As shown from the above two figures, both Assistments depict a difference in their values, which also results in a difference in the answer. Thus, this makes it very easy to create up to 30 and more Assistments.
21
2.5 Incorporating Variabilization with Mastery Learning
With Variabilization, we wanted to incorporate it with Mastery Learning. So we decided on the following approach. This approach mainly consists of six steps.
1. We created Variabilized Templates that focuses on particular skills such as histograms, scatter plots, etc.
2. For each template, we generated 30 instantiated Assistments.
3. Next, we bundled all the Assistments with the same skill into one problem set. 4. Students will be tested on the material from these problem sets.
5. In order to achieve mastery for that skill, students will have to satisfy one of the two conditions: -Get the first Assistment correct on the problem set.
-Get three in a row correct on the problem set.
6. Those who do not achieve mastery will continue doing Assistments from the problem sets that they are assigned.
22
2.6 Content Walkthrough
This section discusses the types of Assistment in a Mastery Learning problem set that focuses on the skill, Box and Whisker. This problem set is made of the instantiated Assistments generated from 3 variabilized templates. Thus, this set has 90 Assistments, but we will only take a look at a 6.
2.6.1 Assistment #30059
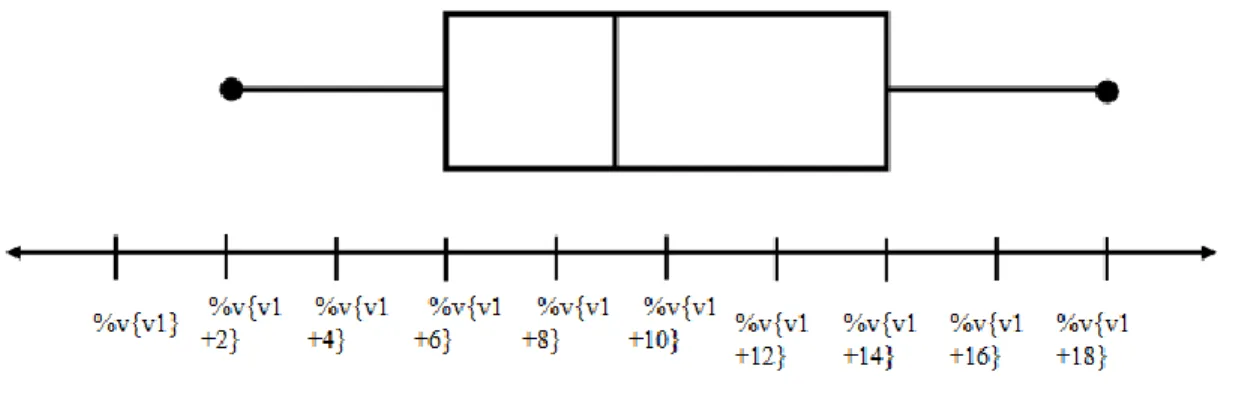
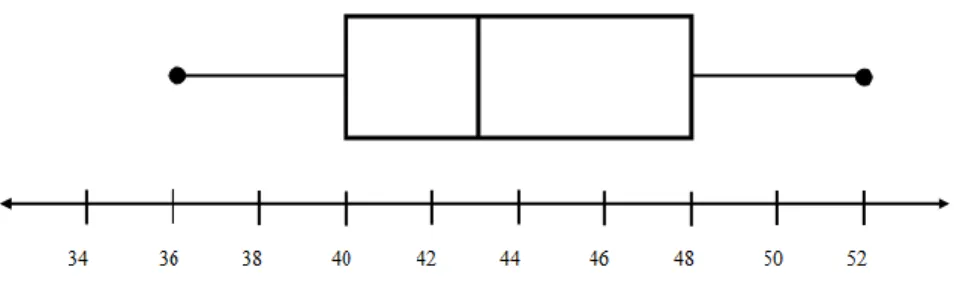
The following example is one that focuses on finding the median in a box and whisker plot. This figure only portrays the main problem of that Assistment.
Figure 2.7 Main Problem of Assistment #30059
This Assistment asks the student to find the median using a box and whisker plot. However, the “median line” on this plot lies between two numbers on the number line. Thus, in order to get the correct answer, the student must average those two numbers together. Here is the first instance of the above template.
23
Figure 2.8 1st Instance of Assistment #30059
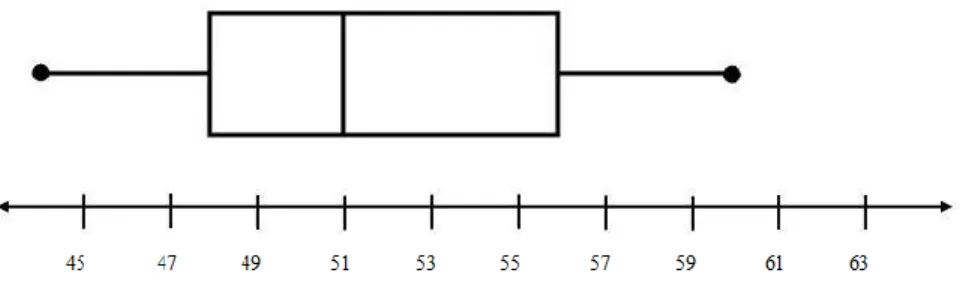
Here is the second instance from the same template.
24
On the first example, the number line starts at 34 and increments by 2 until it gets to 52. The answer for this one is 43. On the other hand, for the second example the number line starts at 45 and
increments by 2 until it gets to 63. The answer for this one is 54. There is a clear difference in answers between Figure 2.8 and Figure 2.9. Thus for this particular template, the numbers on the number line vary so that the answer would also vary.
2.6.2 Assistment #30799
This next variabilized template also focuses on finding the median using a box and whisker plot. However, the approach to this problem is different from the previous problem.
Figure 2.10 Main Problem of Assistment #30799
The picture for this template is not shown on the above figure, because there are 3 images that this problem uses. To understand this better, take a look at the instances of this template. The first instance is shown on the following figure.
25
Figure 2.11 1st Instance of Assistment #30799
Here is the second instance of the variabilized template.
26
There are two differences between this template and the previous template. For this template, the median line points to a point on the line as opposed to the previous one that points to a section between two points. Another difference is that image for this one changes while the previous one does not. On Figure 2.11, the median line points to the 5th point on the axis, while on Figure 2.12, the median line points to the 4th point on the axis. Since the images for this template varies, Figure 2.10 shows an empty image for the template. Now let‟s take a look at the final template in this Mastery Learning problem set on box and whisker plots.
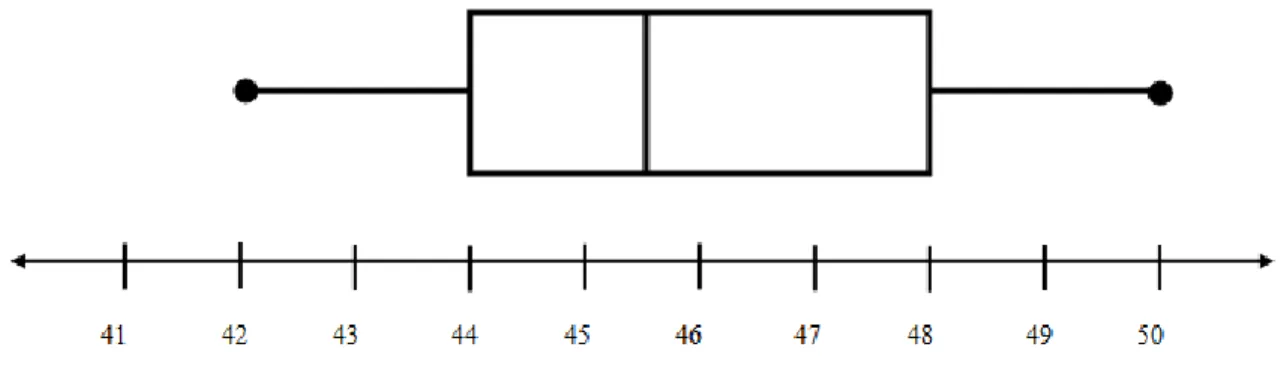
2.6.3 Assistment #30060
The last 30 Assistments in this Mastery Learning problem set involves asking the student to find the range of the box and whisker plot. This template is shown on the following figure.
Figure 2.13 Main Problem of Assistment #30060
27
show any images. But if we take a look at the instantiated Assistments as shown on the next figure, we can clearly see the image.
Figure 2.14 1st Instance of Assistment #30060
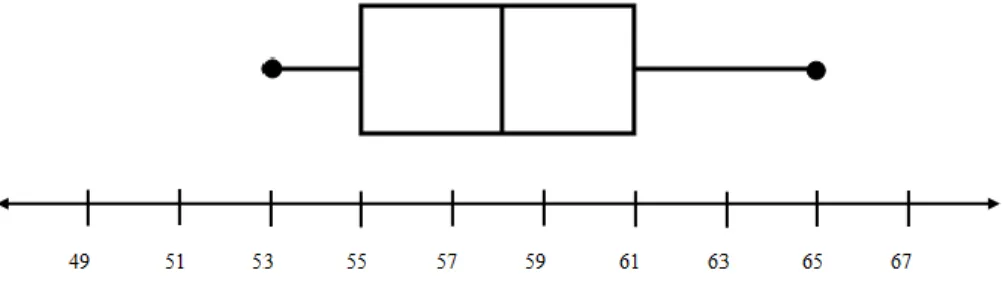
Since this problem involves finding the range, it was necessary to use a few images as well as change the number line. The next figure shows the second instance of this template.
28
Figure 2.15 2nd Instance of Assistment #30060
As shown from the above two figures, the image of the box and whisker plot shrinks or grows in size for each Assistment generated from this template. This allows for more variations of the answer for the range of this plot. Overall, this mastery learning problem set is composed of the three templates in this sub section. In order for a student to master out of this problem set, he or she is required to either get the first problem in this set correct or get 3 in a row correct. Finally, once we have completed our implementation of Mastery Learning, we proceeded to designing the experiment.
29
3. EXPERIMENT
3.1 Hypothesis
The hypothesis of our experiment was Mastery learning would increase the amount learned by the average student who used the Assistment program. We believe by reinforcing the problem areas of students who use Assistment program we can increase the overall amount learned.
30
3.2 Overview
To test our experiment we built Mastery learning problem sets, that each focused on one
specific skill. A Mastery learning problem set consists of 50 problems of the specific skill presented in a random order. When a student has to take a mastery learning problem set, they can finish it in one of three different ways. The student can either test out by getting the first problem in the set correct, or if the student gets the first problem wrong they can test out by getting three correct answers in a row. The third way a student can finish a mastery learning problem set is by completing all 50 problems without getting three correct answers in a row. If a student gets the first problem in a mastery learning set correct or gets three correct in a row, they are labeled has having mastered that skill.
The Mastery learning problem sets also have hints and or scaffolding that go along with them. If a student requests hints they automatically get the problem wrong, but are walked through the problem step by step until, they are either given the right answer in the last hint, or they discover the answer for themselves. In addition to this if a student answers a problem incorrectly in the Mastery learning problem set; they are forced to go through the hints until they enter the correct answer.
31
3.3 The Experiment
To test the effectiveness of mastery learning, we ran four separate experiments on two separate groups of students. In each experiment the students were split into two groups, mastery and control. In a normal Assistment assignment all the students would do an Assistment problem set focused on one skill set, and the teacher would get to review the results and see the class problem areas. For this experiment both the mastery and control groups took two tests, the first one the pretest consisted of a set of problems focus around a skill such as data analysis. The post-test was taken two weeks later and was a direct “morph” of the pretest problem set. A morph is essentially a copy of the original problem with some values and names changed as not to be directly the same, an example of a pretest question and its morph are shown below in figures 3.1 and 3.2. For the experiment, both the mastery and control groups received the pretest at the same time. The difference was after the pretest the control group did no extra learning on the skill tested in the pretest, while the mastery group went on to do the mastery learning set or sets associated with each pretest problem. Two weeks after the pretest both the mastery and control groups took the post-test for the skill given in the pretest.
“Pre-test”
Assistment #28808 "28808 - Variables and Patterns Inv3 #2 morph"
John wants to buy a new toy car. He has $75 already saved up. In order to save enough for the new toy car he is going to add $8 a week to
his savings. How many dollars will he have in total after 4 weeks? Figure 3.1
32
“Post-test morph”
Assistment #31055 "31055 - 28808 - Variables and Patterns Inv3 #2 morph"
Mike wants to buy a new computer. He has $97 already saved up. In order to save enough for the new computer he is going to add $13 a week to
his savings. How many dollars will he have in total after 5 weeks? Figure 3.2
To run our four experiments we used two different test groups. For the first test group, we got four different 8th grade class periods, from the same school with the same teacher. The four periods were split into two different groups, mastery and control, each consisting of two periods. For the second test group we got three more 8th grade class periods from the same school with the same
teacher. This time to get an equal number of mastery and control students one class was split, with half the students in the mastery group and half in the control.
Experiment one was conducted on the first test group, for this experiment the students were tested on Data Analysis. The pretest for Data Analysis in experiment one had the hints turned on, which means when a student got the problem wrong, they were helped by the Assistment program to obtain the correct answer.
Experiment two was also conducted on the first test group, except experiment two tested the students on Moving Strait Ahead. The pretest for Moving Strait Ahead in experiment two had the hints turned on.
Experiment three was conducted on the second test group, this experiment tested the students on Data Analysis. In this experiment however the students were no longer able to get hints on the pretest;
33
therefore cutting off the control group from all Assistment based help. When a student completes a problem with hints disabled they are not told whether or not they were correct, they are just taken to the next problem in the set.
Experiment four was conducted on the second test group, and tested the students on Moving Strait Ahead. The pretest for Moving Strait Ahead in experiment four had the hints turned off.
Since the two test groups had test methods that differed by how the pretest was preformed we will be analyzing each set of data separately to determine if there is a significant difference in the results of the post-test between the mastery and control groups.
34
4. ANALYSIS & RESULTS
The following tables show the results of the experiments. They show the average score of the pretest and posttest in percentages for each group. The average gain (the posttest average score subtracted by the pretest average score) shows by how much each group improved by.
4.1 Experiment 1
n Pretest Average Posttest Average Gain Average Standard Deviation Mastery 40 46% 79% 33% 30.3% Control 38 48% 70% 22% 22.5%P-Value N/A .652 .117 .105 N/A
Figure 4.1
4.1.1 Results
For experiment one, the mastery group got a pretest average of 46% and the control group got an average of 48%. After taking the posttest the mastery group‟s score increased from 33% to 79%, and the control‟s score increased from 22% to 70%. The gains produced a low P-Value of .105, which is not statistically significant, and a medium effect size of .436.
4.1.2 Analysis
Experiment one was done on the data analysis problem set, and taken by the first test group of students. The experiment showed positive results for mastery learning giving a P-Value of .105. While this value is not considered statistically significant, it does tell us there is an 89% chance that the deviation in scores was not caused by chance.
Since hints were activated on the pretest, students received computer based help when they answered a question wrong. As a result, the control group still had a significant gain despite not
35
receiving any mastery learning. However the mastery group still posted an 11% higher gain than the control group.
4.1.3 Special Problem Case 1
Students who had to do the mastery learning problem set for Assistments #27831 showed extremely high pretest/posttest gain scores. Assistment #27831 is shown below in Figure 4.1.1.
“Pre-test”
Assistment #27831 "27831 - Problem 30a - 1998"
The coach of the All-Star Basketball Game needs to pick one of the two players for the team. The table below shows the number of points each of the players scored in his last 10 games.
Name of player Number of points scored in last ten games
Geltz 15, 24, 32, 15, 22, 19, 26, 29, 11, 17 Luna 22, 17, 23, 8, 24, 24, 22, 20, 18, 22
What is the mean number of points scored by Geltz? Figure 4.1.1
The students who took the mastery learning problem set associated with this problem posted an average gain on the post-test of 44%, while their classmates in the control group only showed a gain of 10%. This yields a statistically significant result for this problem set with a P-Value of .0105, and a medium effect size of .552 as shown below in Figure 4.1.2.
n Gain Average Standard Deviation Mastery 40 44% 55.2% Control 38 10% 61.7%
P-Value N/A .0105 N/A
Effect-Size N/A .552 N/A Figure 4.1.2
36
Further analysis of just the mastery learning group with a pivot table shown in Figure 4.1.3, shows the effectiveness of mastery learning on students that got the pretest problem incorrect. The table shows the average scores of each student on the mastery learning section, a lower percentage means the student was forced to do more mastery learning problems, and 100% means the student tested out by getting the first question right. The table below shows all of the students that got the pretest wrong and there gains on the posttest. From the table you can see that 17 out of 22 students who got the pretest wrong got the post-test correct after completing mastery learning.
Post-Test(27831-27906) Mastery Learning Score (%)
Student Names Gain = 0 Gain = 1
Student A 42.00% Student B 100.00% Student C 100.00% Student D 100.00% Student E 66.00% Student F 75.00% Student G 100.00% Student H 100.00% Student I 100.00% Student J 100.00% Student K 60.00% Student L 100.00% Student M 75.00% Student N 100.00% Student O 75.00% Student P 40.00% Student Q 75.00% Student R 100.00% Student S 60.00% Student T 100.00% Student U 100.00% Student V 100.00% Figure 4.1.3
37
4.1.4 Special Problem Case 2
Like the previous special case, students who had to do the mastery learning problem set for Assistment #27832 also showed extremely high pretest/posttest gain scores. Assistment # 27832 is shown below in Figure 4.1.4.
“Pre-test”
Assistment #27832 "27832 - Gr.8 2007 - #13 - Histogram (Morph)"
Abe tested 85 Brand X light bulbs to determine their life spans. The histogram below shows the results of his test.
What was the total number of Brand X light bulbs that had life spans greater than or equal to 900 hours?
Figure 4.1.4
38
with this problem received an average gain in posttest scores of 28%. The control group who did not take the mastery learning set only received an average gain of 7% on the posttest. The data from this individual experiment does not show statistically significant results, but it does have a low P-Value of .118 and a small effect size of .329, these results are shown below in Figure 4.1.5.
n Gain Average Standard Deviation Mastery 40 28% 56% Control 38 7% 64%
P-Value N/A .118 N/A
Effect-Size N/A .329 N/A Figure 4.1.5
We further analyzed this problem set using a pivot table isolating the students that got the pretest question wrong in the mastery learning group, the pivot table is shown below in Figure 4.1.6. The table shows that among the 18 students in the mastery learning group to get the pretest problem wrong, 13 got the posttest correct while only 5 answered incorrectly. Also shown in the pivot table is the percentage correct each student received on the mastery learning problem set, the lower percent correct the more mastery problems the student did.
Post-Test(27832-36639) Mastery Learning Score (%)
Student Names Gain = 0 Gain = 1
Student A 42.00% Student B 100.00% Student C 18.00% Student D 100.00% Student E 50.00% Student F 100.00% Student G 100.00% Student H 100.00% Student I 50.00% Student J 50.00% Student H 75.00% Student K 57.00% Student L 42.00% Student M 61.00%
39
Post-Test(27832-36639) Mastery Learning Score (%)
Student O 100.00%
Student P 100.00%
Student Q 62.00%
Student R 100.00%
Figure 4.1.6
4.1.5 Special Student Case 1
Student 6 from the mastery learning group of experiment one posted a 64% pretest/posttest gain. This special student case shows the positive effect mastery learning can have. Figure 4.1.7 below shows the amount of problems Student 6 completed for each mastery learning set and her gain scores for those problems, indicated by color.
Figure 4.1.7
As you can see from the graph, she did a minimum of two problems on a mastery learning problem set and a maximum of 12 on another. In this case the extra practice given by mastery learning seems to have paid off.
0 2 4 6 8 10 12 14 27826 Venn Diagram 1-2 27842 Table Mode 27841 Table Range 27828 Stem and Leaf 27840 Table Median 27827 Circle Graph 27829 Chart 27831 Table Mean 27832 Histogram 27830 Scatterplot 27833 Box and Whisker
Student 6's Mastery Progress
gain=1 gain=0(1->1)
40
4.1.6 Special Student Case 2
Student 7 is another example of a student who received an exceptional score increase, from the data analysis problem sets mastery learning. Student 7 gained 64% from a pretest score of 36% to a posttest score of 100%. Figure 4.1.8 below shows the amount of problems student 7 completed for each mastery learning set and his gain scores for those problems, indicated by color.
Figure 4.1.8
From the graph you can see that Student 7 did a maximum of 8 mastery learning problems on table median. The gains posted by both Student 7 and Student 6 in this experiment show the effectiveness of the data analysis mastery learning problem sets on helping students with less than average pretest scores.
4.1.7 Conclusion
While the experiment itself did not yield statistically significant results, the four special cases highlight the best parts of mastery learning in this problem set. From the special cases we can see the positive effect that mastery learning can have on some students, particularly low-achieving ones, and
0 1 2 3 4 5 6 7 8 9
Student 7's Mastery Progress
gain=1 gain=0(1->1)
41
the positive effect that certain mastery learning problem sets have on the class.
4.2 Experiment 2
n Pre-Test Average Post-Test Average Gain Average Standard Deviation Mastery 39 59% 78% 19% 13.8% Control 41 60% 78% 18% 14.7%P-Value N/A .765 .948 .741 N/A
Figure 4.2
4.2.1 Results
For experiment two, the mastery group got a pretest score of 59% and the control group got a pretest score of 60%. After taking the posttest, the mastery group gain 19% points for a posttest average of 78%, and the control group gained 8% points for a posttest average of 78%. These gains show no statistically significant results for mastery learning giving a P-Value of .741 and an effect size of .073.
4.2.2 Analysis
Experiment two was done on the Moving Straight Ahead problem set and taken by the first group of students. The results of this experiment show no statistically significant data, with both groups posting gains within 1% of each other. There was no significant difference between the control and mastery groups in the pretest either, so the data does suggest equal improvement from just the hints given on the pretest. However, there is a possible explanation for the results we received. When this test was preformed the students had just finished learning the section covered by the Moving Straight Ahead problem set in class. This could have canceled out the effectiveness of mastery learning due to the students already being fresh in the subject. Also the pretest for this experiment had the hints active,
42
so the students got help on wrong answers. This could have had a negative effect on our test as well because the control group was given opportunity to be corrected for their mistakes.
4.2.3 Special Problem Case 1
On the second main problem of Moving Straight Ahead Assistment #28768, the mastery learning group had significant score increases. Assistment #28768 main problem 2 is shown below in Figure 4.2.1 and required the students to complete two mastery learning problem sets before the post-test.
“Pre-test”
Assistment #28768 “28768 – 8th grade: Moving Straight Ahead – Solve for x”
P. Use the properties of equality to solve the equation for x.
2x – 40 = 60 What is the value of x?
Figure 4.2.1
The students in the mastery learning group got an average gain of 23% on the posttest of this problem, while the control group only received an average gain of 3%. These results yield a P-Value of .109 which is not statistically significant, and a small effect size of .336 shown below in Figure 4.2.2.
n Gain Average Standard Deviation Mastery 39 23% 48% Control 41 3% 59%
P-Value N/A .109 N/A
Effect-Size N/A .336 N/A Figure 4.2.2
43
4.2.4 Special Student Case 1
Student 5 from the mastery learning group got a pretest score of 61% on the moving straight ahead problem set. After taking mastery learning, she received a score of 92% on the post-test, giving her a gain of 31%. Figure 4.2.3 below shows the amount of problems Student 5 completed for each mastery learning set and her gain scores for those problems, indicated by color.
Figure 4.2.3
From the graph you can see there was only one problem that Student 5 did not get right on the posttest. Also Student 5 got some significant practice in inequality solving; she did a total 38 problems between 3 mastery sets. Student 5‟s hard work paid off in all but one problem for the set.
4.2.5 Special Student Case 2
Student 9 is another student who showed an exceptional gain of 31% from the pretest to the 0 5 10 15 20 25 30
Student 5's Mastery Progress
gain=1 gain=0(1->1) gain=0(0->0)
44
posttest on the moving straight ahead problem set. Student 9 went from a pretest score of 61% to a posttest score of 92% after completing the mastery learning associated with moving straight ahead. Figure 4.2.4 below shows the amount of problems Student 9 completed in each mastery learning set and his gain scores for those problems, indicated by color.
Figure 4.2.4
From the graph you see that Student 9 did get a negative gain on one problem, however he also tested out of the mastery learning problem set for that problem meaning he got minimal help. Student 9 did a maximum of 4 mastery problems in one mastery learning problem set. The problems student 9 got the most practice in he either got a gain of zero but got the pre and post-test problems right or got a gain of 1. 0 0.5 1 1.5 2 2.5 3 3.5 4 4.5
Student 9's Mastery Progress
gain=1 gain=0(1->1) gain=-1
45
4.2.6 Conclusion
Overall mastery learning on this problem was not very effective although, on a student level basis, mastery learning did have some positive effects. However, we hypothesize that mastery
learning‟s effect is greatly diminished if the material has just been or is currently being taught in class. It suggests that mastery learning is great for a “refresher” course.
4.3 Experiment 3
n Pre-Test Average Post-Test Average Gain Average Standard Deviation Mastery 39 64% 83% 18% 23.1% Control 41 49% 69% 20% 20.7%P-Value N/A .00318 .0018 .734 N/A
Figure 4.3
4.3.1 Results
For experiment three, the mastery group got a pretest average of 64%, and the control group got a pretest average of 49%. From these two scores we received a P-Value of .00318 which shows their significant difference. On the post-test the mastery learning group scored 83% gaining 18%, and the control group scored 69% gaining 20%. The P-Value of .734 for the gains shows no statistically significant results, we also obtained an insignificant effect size of -.085.
4.3.2 Analysis
Experiment three was done on data analysis, and taken by the second test group of students. The results of experiment three were unexpected, with the control group getting a 2% better gain in scores then the experiment. However in the pretest the mastery learning group scored a much higher average than the control group. This puts the mastery group at a disadvantage for increasing their
46
scores since the groups average started out 15% higher than the control group. The P-Value of the pretest shows in this case there is a 99.7% chance the groups were different to start.
Since the two groups differed so greatly in scores to start, the resulting test data and P-Value for the gains, is not an effective representation of the performance of the mastery learning Assistments. Even though the gains of the mastery group did not outweigh the gains of the control, the mastery group did maintain a significant lead in overall percentage scores with a posttest score of 83%, while the control had a 69%. The P-Value from the posttest shows a statistically significant result, but we cannot make much of it because, of the two groups extreme difference to start.
4.3.3 Special Problem Case 1
One of the skills that the mastery learning students improved significantly on is Assistment #27828, which is an Assistment problem that focuses on the concept of “Stem and Leaf”. Figure 4.3.1 illustrates the main problem of this Assistment.
“Pre-test”
Assistment #27828 "27828 - 2201 - Problem 8 - 2003"
The stem-and-leaf plot below shows the ages of the people who bought skateboards at a store during a sale. What is the median age of the people who bought skateboards during the sale?
47
Figure 4.3.1
After completing the mastery learning problem sets for this Assistment, the experimental achieved a gain of 30%. On the other hand, the control group only had a gain of 15%. Using these averages, we computed the p-value for this problem which resulted in 0.299. Also, the standard deviations only yield an effect size of 0.127.
n Gain Average Standard Deviation Mastery 43 30% 0.558 Control 33 15% 0.667
P-Value N/A .299 N/A
Effect-Size N/A .226 N/A Figure 4.3.2
To further analyzing our data, we constructed a pivot to view the number of students who got the posttest correct after doing mastery learning. This table is shown on Figure 4.3.3.
Post-Test(27828-27904 )
Mastery Learning Score (%)
Student Names Gain = 0 Gain = 1
Student A 100.00% Student B 100.00% Student C 75.00% Student D 100.00% Student E 100.00% Student F 100.00% Student G 100.00% Student H 100.00% Student I 100.00% Student J 0.00% Student K 100.00% Student L 63.00% Student M 100.00% Student N 100.00% Student O 50.00% Student P 0.00%
48
Student Q 100.00%
Student R 75.00%
Figure 4.3.3
Out of the 18 students who got this Assistment incorrect on the pretest, 15 of those students managed to answer this Assistment correctly. From the 15 students who answered this Assistment correctly on the posttest, 13 of them tested out of the mastery learning problems. This is a tremendous improvement, considering that most of the students, who got the problem incorrect on the pretest, got the problem correct on the posttest.
4.3.4 Special Problem Case 2
Another mastery learning problem set that showed the greatest difference in gain between the experimental group and control group is Assistment #27832, which focuses on Histograms. Figure 4.3.3 shows the main problem for this particular Assistment.
“Pre-test”
Assistment #27832 "27832 - Gr.8 2007 - #13 - Histogram (Morph)"
Abe tested 85 Brand X light bulbs to determine their life spans. The histogram below shows the results of his test.
49
What was the total number of Brand X light bulbs that had life spans greater than or equal to 900 hours?
Figure 4.3.4
The average gain of the experimental group for this Assistment is 12%, while the gain of the control group is -12%. Instead of improving from past performances, the control actually worsened without mastery learning. The averages and standard deviations from Figure 4.3.4 yield a p-value of 0.113 and an effect size of 0.365. Both values are relatively close to being statistically significant.
n Gain Average Standard Deviation Mastery 43 12% 0.625 Control 33 -12% 0.650
P-Value N/A .113 N/A
Effect-Size N/A .365 N/A Figure 4.3.5
We conducted a more in-depth analysis of this Assistment by performing a pivot table, which is shown on following figure.
Post-Test(27832-36639)
Mastery Learning Score (%)
Student Names Gain = 0 Gain = 1
Student A 62% Student B 33% Student C 75% Student D 0% Student E 50% Student F 42% Student G 66% Student H 40% Student I 60% Student J 75%
50 Student K 100% Student L 75% Student M 66% Student N 66% Student O 75% Student P 75% Student Q 80% Figure 4.3.6
From our pivot table, it is quite clear that students who took mastery learning showed an improvement on this Assistment during the posttest. Out of the 17 students who got this Assistment incorrect on the pretest, 10 of them got it correct after doing mastery learning.
4.3.5 Special Student Case 1
One of the students who showed a significant increase in gain is Student 25. This student scored 36% on her pretest, but after taking mastery learning, she aced the posttest with a score of 100%. The gain of these two scores is 64%. Her hard work is easily depicted from the number of mastery learning problem sets that she completed. Out of the 12 mastery learning problem sets that Student 25 was assigned, she managed to complete and test out every single one of them. The following is the outline of her mastery learning progress.
51
Figure 4.3.7
The above histogram shows the number of mastery learning problem sets that Student 25 completed. Four of the problem sets (purple bars) showed that Student 25 did not gain anything. She got the pretest and the posttest correct on those problems. The remaining 8 problem sets show that Student 25 did indeed gain from doing the mastery learning sets. The highest number of Assistment that she completed is 9, which is from the set involving Histograms. Overall, mastery learning helped improve her test scores tremendously.
4.3.6 Special Student Case 2
Another student who performed similar to Student 25 is Student 7. This student failed the pretest miserably with a mere 9%, but showed significant improvement by passing the posttest with a 72%. The difference of these two scores is 63%. Likewise to Student 25, Student 7 also completed and tested out of all 12 of the mastery learning problem sets that he was assigned. This next figure
0 1 2 3 4 5 6 7 8 9 10
Student 25's Mastery Progress
Gain = 1 Gain = 0 (1->1)
52
outlines his mastery learning progress.
Figure 4.3.8
The maximum number of Assistments that this student completed is 11, from Box and Whisker plots. After doing so many Assistments, he achieved a gain. Although there are 3 problem sets that this student did not improve on, he was able to gain something from the other 9 problem sets. Obviously, the result of this is that he passed the posttest.
4.3.7 Conclusion
In conclusion, students who took mastery learning improved greatly on their posttest scores. Most of the students who failed the pretest managed to pass and even to some extent ace the posttest. Although there are some students and Assistments that mastery learning did not improve, in general mastery learning helped a great deal on data analysis.
0 2 4 6 8 10 12
Student 7's Mastery Progress
Gain = 1 Gain = 0 (1->1) Gain = 0 (0->0) Gain = -1
53
4.4 Experiment 4
n Pre-Test Average Post-Test Average Gain Average Standard Deviation Mastery 39 63% 81% 18% 13.8% Control 40 69% 74% 5% 13.7%P-Value N/A .149 .114 .000145 N/A
Figure 4.4
4.4.1 Results
For experiment four the mastery group got a pretest average of 63% and the control group got a pretest average of 69%. On the post-test the mastery group got an 81% average gaining 18% from the pretest, and the control group got 74% gaining 5% from the pretest. The results in the gains between the mastery and control groups produced statistically significant results with a P-Value of .000145, and a large effect size of .968.
4.4.2 Analysis
Experiment four was done on the moving straight ahead problem set, and taken by the second test group of students. The results given by experiment four were interesting; we got a statistically significant P-Value from the gains of an impressive .000145. We also received a large effect size of .968, which is almost 1 standard deviation difference between the two groups. The only limiting factor to our data is the pretest P-Value reports that there is an 85% chance the two groups were different to start. However the mastery group started 6% lower in average score then the control group, but on the pretest scored 7% above the control. The P-Value on the posttests suggest that there is only a 11% chance that their difference in scores were caused by chance, and even if you consider this value more highly then the gain value, there is still a relatively low P-Value of .11.
Also here you can see the significance of just receiving the mastery learning and no computer based help, because hints in the pretest were turned off and students got no corrections on their
54 mistakes.
4.4.3 Special Problem Case 1
One of the problem sets that students learned the most from involves solving inequalities, Assistment #28778. The main problem for this Assistment is shown on Figure 4.4.1.
“Pre-test”
Assistment #28778 "28778 - 8th grade: Moving Straight Ahead - Morph 2003 grade 8 #13"
Which graph below represents the solution to the inequality below? 2(2x - 3) ≥ x + 3
Figure 4.4.1
For this particular skill, the mastery group had an average gain of 23%, while the control group had an average of -23%. The result of these average values is a p-value of 0.00614 which makes this problem significant. We are 99.4% confident that this difference in gain is not contributed by
randomness. Our large effect size of 0.683 also contributes to the significance of this Assistment.
n Gain Average Standard Deviation Mastery 31 23% 0.669 Control 40 -23% 0.660
P-Value N/A .006144 N/A
Effect-Size N/A .683 N/A Figure 4.4.2
55
4.4.3. For this Assistment, there were 3 mastery learning problem sets that were made to tutor it.
Mastery Learning Score (%)
Post-Test(28778-37003) 28778(1) 28778(2) 28778(3) Student Names 0 1 0 1 0 1 Student A 100% 29% 22% Student B 100% 100% 100% Student C 100% 100% 75% Student D 66% 100% 55% Student E 41% 44% 100% Student F 27% 28% 26% Student G 60% 33% 100% Student H 75% 42% 100% Student I 40% 41% 100% Student J 100% 36% 66% Student K 100% 27% 100% Student L 29% 100% 100% Student M 100% 75% 60% Figure 4.4.3
From the above table, it is evident that most students who complete all 3 mastery learning problem sets were able to get this Assistment correct on the posttest. Out of the 13 students who got this problem incorrect on the pretest, 10 of them were able to get this correct on the posttest.
Therefore, the experimental group was able to learn greatly from mastery learning for solving inequalities. This result will be very important in the future.
4.4.4 Special Problem Case 2
Another Assistment that mastery learning helped students improve on involves understanding line-slope concepts. This Assistment, #28775 had two main problems, which are shown on the following figure.
“Pre-test”
56
a. What is the slope of the line graphed above?
b. Write an equation for this line in the form y = ____________ Figure 4.4.4
The average gain of the experimental group is 71% while the gain of the control group is only 28%. The huge difference in gain yielded a p-value of 0.00342 and an effect size of 0.859. Both of these values are statistically significant, meaning that the results of the two groups are independent of one another and that the results are not caused by random occurrence.
57 n Gain Average Standard Deviation Mastery 31 71% 0.461 Control 40 28% 0.506
P-Value N/A .000342 N/A
Effect-Size N/A .859 N/A Figure 4.4.5
From our p-value test and effect size, we wanted to further analyze this Assistment. Thus, we conducted a pivot to see how many students from the experimental group improved because of mastery learning. Since this problem involves two main problems, we had to perform two pivot tables. The first pivot, shown on Figure 4.4.3 illustrates the results from the first main problem.
Average of 28775 Mastery Learning
Mastery Learning Score (%)
Student Names Gain = 0 Gain = 1
Student A 100% Student B 38% Student C 44% Student D 75% Student E 42% Student F 41% Student G 21% Student H 0% Student I 50% Student J 35% Student K 100% Figure 4.4.6
From this table, only about 6 of the students who got this problem wrong on the pretest, got it correct on the posttest. Since this problem only involves finding the slope of a line, it is relatively straightforward. Thus, only a few students got this problem incorrect on the pretest, making it difficult to see if mastery learning was the cause of their improvement. However, the next pivot table shows quite evidently the value of mastery learning.
58
Average of 28775 Mastery
Learning Mastery Learning Scores (%)
Student Names Gain = 0 Gain = 1
Student A 100% Student B 38% Student C 100% Student D 60% Student E 55% Student F 0% Student G 44% Student H 100% Student I 75% Student J 75% Student K 42% Student L 44% Student M 0% Student N 60% Student O 21% Student P 0% Student Q 62% Student R 50% Student S 35% Student T 60% Student U 100% Student V 75% Student W 100% Figure 4.4.7
The second main problem for Assistment #28775 focuses on writing the line-slope equation using the y-intercept and the slope. (y = mx + b) From Figure 4.4.7, we can clearly see that out of the 23 students who got this main problem wrong, 18 (ignoring the 0% students) of them improved after doing mastery learning.
4.4.5 Special Student Case 1
In the mastery group, Student 3 scored 100% on the posttest after scoring only 53% on the pretest two weeks before. The tremendous amount of effort that this student has put into completing the Moving Straight Ahead problems finally paid off. He spent hours answering some of these mastery
59
learning problem sets. He had average scores of 19%, 27%, 28%, and 26% on several of them. From the averages of 19%, 27%, 28%, and 26%, Student 3 answered correctly 5/26, 3/11, 6/21, and 4/15 respectively. Even though for these four problem sets, Student 3 never managed to test out of them, his hard work allowed him to get them correctly on his posttest. The following figure outlines his mastery progress in much more detail.
Figure 4.4.8
From the table, Student 3 achieved a gain in 8 of the problem sets. For the ones that he did not improve on, he answered that problem correct on both the pretest and the posttest. Overall, mastery learning significantly helped increase Student 3‟s scores on the tests.
0 5 10 15 20 25 30
Student 3's Mastery Progress
Gain = 1 Gain = 0 (1->1)
60
4.4.6 Special Student Case 2
Another student who performed similarly like Student 3 is Student 22. He too scored 100% on the posttest after scoring only 53% on the pretest. His results also showed a gain of 47%. Student 2„s working habit is portrayed by the number of mastery learning problem sets that he tested out of. Out of the 12 problem sets that he was assigned, he managed to test out of 11 of them.
Figure 4.4.9
From the table, we can clearly see for the problems that this student got wrong on the pretest; he was able to make up for them in the posttest. There were 6 Assistments that Student 22 improved on. The result of his effort is achieving a perfect score on the posttest.
0 1 2 3 4 5 6 7 8 9 10
Student 22's Mastery Progress
Gain = 1 Gain = 0 (1->1)
61
4.4.7 Conclusion
Overall the results from experiment 4 were very positive. The p-value, effect size, individual student cases, and Assistment cases all depict that mastery learning help students improve on some of the concepts of pattern-finding.
62
5. DISCUSSION
5.1 Experiments
Experiment # Strand Type Significant Results? Test Group
1 Data Analysis Yes 1
2 Moving Straight Ahead No 1 3 Data Analysis No 2 4 Moving Straight Ahead Yes 2 Figure 5.1
Figure 5.1 above shows the four experiments and whether we got significant results or not from each. As you can see we did not get consistent results from our experiments, the first test group
showed significant results for data analysis and the second group did not. Also the first test group showed no significant results for Moving Straight Ahead, and the second test group did. However we do have some hypothesis on why the two experiments did not show significant results.
Experiment two was conducted around the time the students were learning the same material in the class room. This leads us to suggest a hypothesis that mastery learning is more effective for
someone who is out of practice on the material, or does not have high background knowledge of information. However this still does not explain the ineffectiveness of the test run in experiment two because, the average pretest score for the class was a 60%, and in experiment four on the same pretest the average score was 66% but this test showed significant results.
Experiment three had a very large difference in pretest scores between the mastery group and the control group; the mastery group had a 64% average while the control had a 49% average. This large difference could have allowed the control group to gain a lot of percentage points even by chance on the post-test. Based on the results of the two tests a third test is needed to tell for sure, whether data
63
analysis produces significant results or not.
Our third hypothesis based on the full experiment, relates to the way in which mastery learning is conducted. For this test the students should not have been allowed to test-out of mastery learning after only one problem, especially if they got the pretest problem wrong. While one problem is still some mastery learning, it is minimal and compared to the four problems you do if you get the first wrong, it is little work. We hypothesize, the tests would show better results if all students were made to do at least 3 mastery learning problems before testing out.
5.2 Variabilized Mastery Learning
One of the problems with the tests, and the Assistments mastery learning in general is the way in which the problem sets are produced. The Variabilized templates used to produces the problem sets work very well in some cases, but in others do not. For example it is very hard to get variety into a problem set using graphs, since many times this involves making sets. Also in some cases the
variabilization of problems causes the hints to be more generalized and less effective than the original. However, in the more recent Variabilized Assistments this is fixed by using worked examples of a problem similar to the one currently being tested. What this comes down to is some mastery learning sets are more effective than others due to the fact that Variabilized templates work better for that skill, and this can hinder the overall effect of the mastery learning test.
64
6. CONCLUSION
From the results we are unable to conclude significant results for either of the two mastery learning strand types. However after reviewing our data and that of our peers, one conclusion that can be drawn is that mastery learning does not negatively affect the student gains. Sometimes experiments report great gains sometimes not, our experiments does seem to show that mastery learning is helpful for low-achieving but hardworking students and it might be good for students who need to review old material. The special student cases had a failing grade on the pretest; however, the mastery learning seemed to helped them do well on the posttest. The primarily reason for their success is their relentless effort in answering most if not all of the mastery learning problem sets that they were assigned. There were numerous cases in which students answered anywhere between 14 to 30 Assistments just to test out of the problem set.
Furthermore, there were several exceptional Assistments that students learned more from as opposed to others. In general these Assistments involved concepts that were relatively difficult to grasp at first sight; thus, requiring several hours of practice to master. For data analysis, these Assistments consist of but are not limit to box and whisker plots, stem and leaf plots, mean, median, mode, and range. And for pattern finding concepts, the particular useful mastery learning problem sets are solving for variables, solving inequalities, and understanding line-slope-intercept. Even though there were many students who benefited from our experiment, there are also some who did not.
Although some students did not gain as much from mastery learning as opposed to others, a possible explanation for this lies in their working conditions, and their behaviors. Under their
environment, some students are much more prone to cheating than others, which results in a negative gain in pretest to posttest scores. Lastly, mastery learning can only aid a student in learning the material only if the student makes an attempt to better themselves. Those who are unwilling to work