On the sequencing of the human genome
Robert H. Waterston*†, Eric S. Lander‡, and John E. Sulston§
*Genome Sequencing Center, Washington University, Saint Louis, MO 63108;‡Whitehead Institute兾Massachusetts Institute of Technology Center for
Genome Research, Cambridge, MA 02142; and§Wellcome Trust Sanger Institute, Wellcome Trust Genome Campus, Hinxton, Cambridge CB10 1SA,
United Kingdom
Communicated by Aaron Klug, Medical Research Council, Cambridge, United Kingdom, December 21, 2001 (received for review November 7, 2001)
Two recent papers using different approaches reported draft sequences of the human genome. The international Human Ge-nome Project (HGP) used the hierarchical shotgun approach, whereas Celera Genomics adopted the whole-genome shotgun (WGS) approach. Here, we analyze whether the latter paper provides a meaningful test of the WGS approach on a mammalian genome. In the Celera paper, the authors did not analyze their own WGS data. Instead, they decomposed the HGP’s assembled se-quence into a ‘‘perfect tiling path’’, combined it with their WGS data, and assembled the merged data set. To study the implications of this approach, we perform computational analysis and find that a perfect tiling path with 2-fold coverage is sufficient to recover virtually the entirety of a genome assembly. We also examine the manner in which the assembly was anchored to the human ge-nome and conclude that the process primarily depended on the HGP’s sequence-tagged site maps, BAC maps, and clone-based sequences. Our analysis indicates that the Celera paper provides neither a meaningful test of the WGS approach nor an independent sequence of the human genome. Our analysis does not imply that a WGS approach could not be successfully applied to assemble a draft sequence of a large mammalian genome, but merely that the Celera paper does not provide such evidence.
T
wo scientific papers (1, 2) recently appeared reporting ‘‘draft’’ sequences of the human genome. One was the product of the international Human Genome Project (HGP), and the other was the product of the biotechnology firm Celera Genomics. The two groups set out by using different method-ologies, and each collected independent data sets.In principle, the availability of two papers on the human genome has much potential scientific benefit. In addition to the comparison of two independently derived genome sequences, it should also allow methodological analysis of the sequencing strategies used for insights concerning the design of future genome-sequencing efforts.
Here, we focus on the methodological issues of genome sequence assembly. In general, genomic sequencing projects employ the same basic technique of shotgun sequencing devel-oped by Sanger and others shortly after the invention of DNA sequencing around 1980 (e.g., see ref. 3). To determine the sequence of a large DNA molecule, the method begins by breaking up the DNA into smaller random overlapping frag-ments, obtaining sequence ‘‘reads’’ from these fragfrag-ments, then using computer analysis to reassemble the random reads into ‘‘contigs’’. Because of cloning biases and systematic failures in the sequencing chemistry, the random data alone are usually insufficient to yield a complete, accurate sequence. Instead, it is usually more cost-effective to supplement the random data with the collection of sequence data directed to close the gaps and solve remaining problems. The technique has been refined over the ensuing two decades. The initial version, for example, involved sequencing from one end of each fragment. Ansorge and others (4) extended this approach in 1990 to include the sequencing of both ends (paired-end shotgun sequencing), thereby obtaining linking information that could be used to connect contigs separated by gaps into ‘‘scaffolds’’.
The shotgun sequencing technique can be directly applied to genomes with relatively few repeat sequences. The assembly
problem is straightforward, because reads with overlapping sequence can typically be merged together without risk of misassembly. The relatively few gaps and problems can be solved to produce complete sequences. The approach has been applied successfully to produce complete sequences of simple genomes such as plasmids, viruses, organelles, and bacteria. Whole-genome shotgun data alone also has been applied with an almost 15-fold redundancy (5) to produce a draft sequence of the euchromatic portion of the Drosophila genome (3% repeat content), although a clone-based strategy is being applied to convert this to a finished sequence.
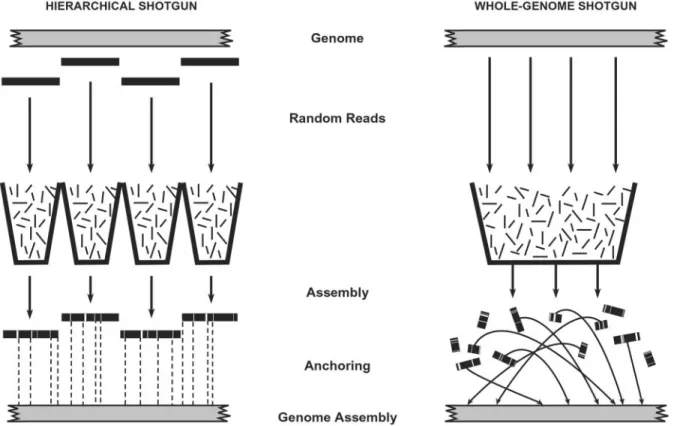
A greater challenge arises in tackling complex genomes with a large proportion of repeat sequences that can give rise to misassembly. Two alternative approaches (Fig. 1) can be taken. Hierarchical shotgun (HS) assembly.In this approach, the ge-nome is first broken up into an overlapping collection of intermediate clones such as bacterial artificial chromosomes (BACs). The sequence of each BAC is determined by shotgun sequencing, and the sequence of the genome is obtained by merging the sequences of the BACs. The HS approach provides a guaranteed route for producing an accurate finished genome sequence, because the sequence assembly is local and anchored to the genome. But it requires some additional preliminary work, including selecting overlapping BACs and preparing shotgun libraries from each BAC.
Whole-genome shotgun (WGS) assembly.In this approach, the genome is decomposed directly into individual random reads. One then attempts to assemble the genome as a whole. The WGS approach avoids the preliminary work but has potential disad-vantages: there is a greater risk of long-range misassembly. The resulting sequence components must be individually anchored to the genome, and the resulting assembly may be difficult to convert to a finished sequence.
Whether to tackle the sequencing of the human genome with the HS or WGS approach was extensively debated in the scientific literature in 1996 and 1997 (6, 7). There was no doubt that the WGS approach could yield a large amount of the human sequence, but there was serious concern that the ultimate cost of producing a finished human reference sequence would be much greater. In fact, the potential cost savings in producing a draft sequence was unclear, because map construction and library production account for a minor fraction (⬍10%) of the total sequencing costs. For these reasons, the HGP elected to use the HS approach.
In 1998, Celera Genomics was formed with the goal of applying the alternative WGS approach to the human genome. Differing opinions were expressed concerning the likely product. Venter (8) projected that the WGS approach would suffice to assemble the entire genome in a small number of pieces. He Abbreviations: HGP, Human Genome Project; HS, hierarchical shotgun; BACs, bacterial artificial chromosomes; WGS, whole-genome shotgun; STS, sequence-tagged sites; CSA, compartmentalized sequence assembly.
†To whom reprint requests should be addressed at: Genome Sequencing Center, Box 8501,
4444 Forest Park Boulevard, Saint Louis, MO 63108. E-mail: [email protected]. The publication costs of this article were defrayed in part by page charge payment. This article must therefore be hereby marked “advertisement” in accordance with 18 U.S.C. §1734 solely to indicate this fact.
estimated that an assembly based on 10-fold coverage would have fewer than 5,000 contigs separated by gaps of⬇60 bp. Such an assembly would include the nucleotide sequence of 99.99% of the human euchromatic genome and would consist of a small number of components that could then be positioned, or an-chored, in the genome. Relatively little work would be required to produce a finished sequence. Olson (9) foresaw a different outcome, projecting there would be more than 100,000 compo-nents. That number of components would be far too many to anchor in the genome by using sequence-tagged sites (STS) as landmarks, resulting in a significant portion of the genome being unanchored. Moreover, he argued that it would be difficult or impossible to use such results as a foundation for producing a finished sequence.
With the recent publications on the human genome sequence (1, 2), it is possible to examine the reported results for insight concerning sequencing methodology. In particular, the Celera authors reported that their paper constituted a successful ap-plication of the WGS approach to a mammalian genome and that they had provided a genome sequence based primarily on their own data. Here, we examine the validity of these conclusions.
Analysis and Results
HGP Data and HS Assembly.The HGP strategy is based on the sequencing of overlapping BACs (⬇170 kb) with known loca-tions in the human genome. BACs are subjected to increasing levels of sequence coverage and completion: draft at ⬇5-fold coverage, deep shotgun at ⬇10-fold coverage, and finished resulting from directed gap closure.
At the time of publication (1), the BACs sequenced to at least draft status covered ⬇94% of the euchromatic genome. The
merged sequence itself had fairly large contigs (half the sequence resided in contigs of ⬎80 kb) and represented ⬇90% of the euchromatic portion of the human genome, roughly equally divided among draft, full shotgun, and finished status. The total sequence coverage was 7.5-fold.
Celera Data and WGS Assembly.The Celera strategy was based on assembling the genome from random sequences generated from both ends of whole-genome plasmid libraries with 2-, 10-, and 50-kb inserts. The authors generated a total sequence coverage of 5.1-fold.
The Celera authors presented no genome assembly based on their own WGS data (2). Thus, their paper provides neither a direct experimental test of the WGS method nor a direct assessment of the Celera data.
Joint Assemblies.The Celera paper presented only joint analyses based on a combined data set including both the HGP data (which had been made available on the world wide web, in keeping with the HGP’s policy of free and immediate data release) and Celera’s own data. The paper reported two joint analyses: a ‘‘faux’’ WGS assembly and a compartmentalized sequence assembly (CSA).
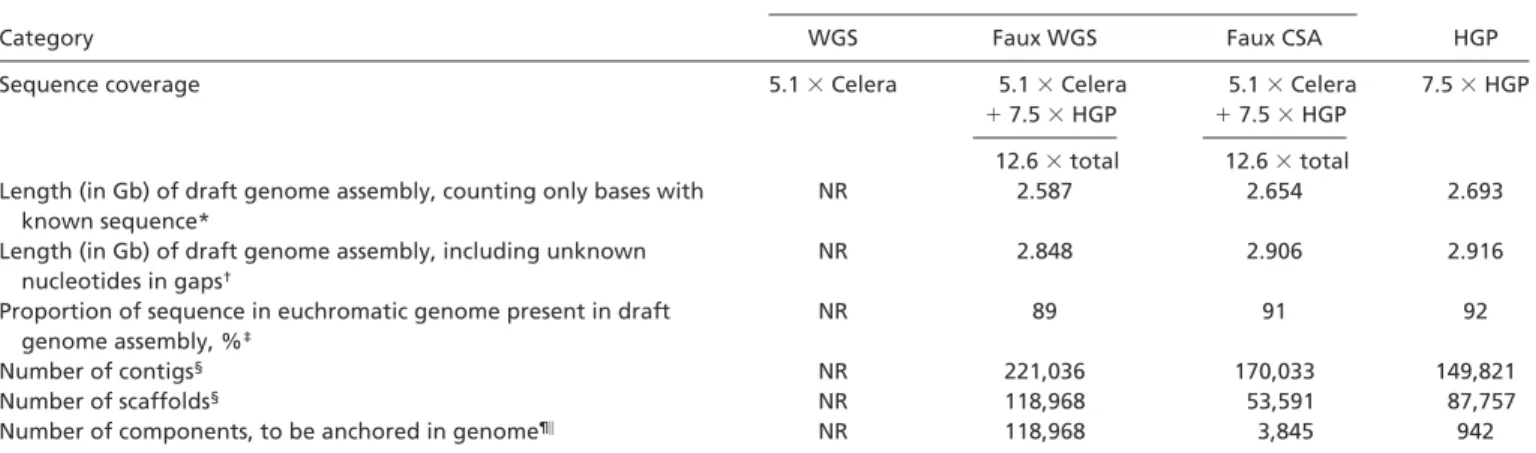
The methods are discussed below, and their output is sum-marized in Table 1. Notably, the joint assemblies do not contain dramatically more total sequence than the HGP assemblies that were used as input. Both the HGP assembly and the joint assembly based on the HGP and Celera data contain⬇90% of the human euchromatic genome. To be sure, the joint assembly contains some additional sequence (estimated to be a few percent) and adds additional ordering information. But the
Fig. 1. Sequencing strategies. (Left) The hierarchical shotgun (HS) strategy involves decomposing the genome into a tiling path of overlapping BAC clones, performing shotgun sequencing on and reassembling each BAC, and then merging the sequences of adjacent clones. The method has the advantage that all sequence contigs and scaffolds derived from a BAC belong to a single compartment with respect to anchoring to the genome. (Right) Whole-genome shotgun (WGS) strategy involves performing shotgun sequencing on the entire genome and attempting to reassemble the entire collection. With the WGS method, each contig and scaffold is an independent component that must be anchored to the genome. In general, many scaffolds may not be anchored without directed efforts. (Contigs are contiguous blocks of sequence; scaffolds are sets of contigs joined by paired reads from both ends of a plasmid insert.)
Waterstonet al. PNAS 兩 March 19, 2002 兩 vol. 99 兩 no. 6 兩 3713
differences in the results using the combined data sets and the HGP data alone are relatively slight.
Faux WGS Reads.The manner in which the joint assemblies used the HGP data are noteworthy. The Celera authors stated that they combined 2.9-fold coverage from the HGP with 5.1-fold coverage from Celera. However, a close reading of the paper shows that the 2.9-fold coverage was derived in an unusual manner that is very unlike shotgun data and implicitly preserved much of the HGP assembly information.
The authors ‘‘shredded’’ the HGP’s assembled sequence data into simulated reads of 550 bp, which they termed ‘‘faux reads’’. Each BAC was shredded to yield 2-fold coverage; given the overlaps between BAC clones, this yielded a total of 2.9-fold coverage. The authors then fed these faux reads into their assembly program, together with their own WGS reads. The stated purpose of shredding the HGP data was to break any misassemblies; this goal is a reasonable one. However, the shredding was done in such a manner that the resulting assembly bore no relation to a WGS assembly. Specifically, the faux reads were not a random 2-fold sampling, but instead comprised perfect 2⫻coverage across the assembled HGP contigs. In other words, the faux reads were perfectly spaced, with each overlap-ping the next by half its length, thereby completely avoiding the problems of gaps, small overlaps, and errors that arise in realistic data (Fig. 2).¶
Faux WGS Assembly. The first joint assembly (faux WGS) was modeled on the WGS approach in the sense that the sequence reads (both actual and faux) were fed into a genome assembly program without additional information. In particular, the ge-nome assembly program did not have explicit information about the overlaps or location of the faux reads in the HGP sequence contigs.
We were curious, however, whether the HGP assembly
infor-mation wasimplicitlypreserved through use of a perfect 2-fold tiling path. We tested this hypothesis by creating simulated data sets from the finished sequence of human chromosome 22 and performing genome assemblies by using a WGS assembly pro-gram,ARACHNE(10, 11).
Y Set A (2⫻perfect tiling path) consisted of a perfect tiling path of 550-bp reads, each overlapping the next by 275 bp, across the finished sequence.
Y Set B (2⫻random coverage) consisted of randomly chosen reads of 550 bp, providing a total of 2-fold coverage. Y Set C (5⫻ random coverage) consisted of randomly chosen
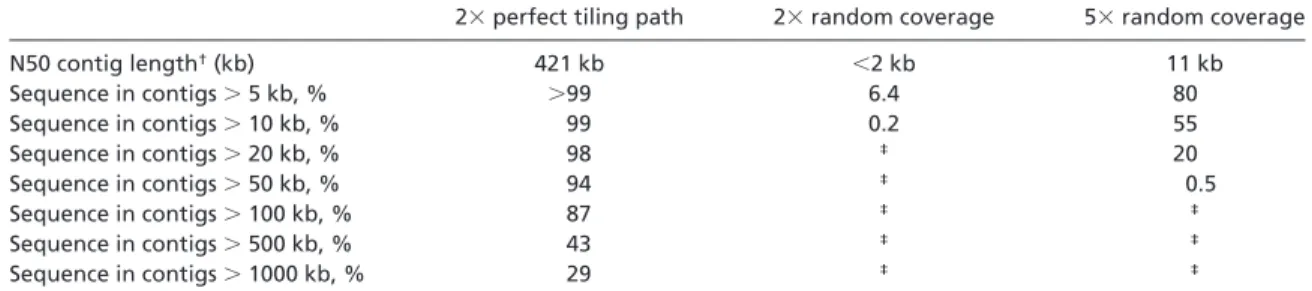
reads of 550 bp, providing a total of 5-fold coverage. We first compared the results of assembling sets A and B (Table 2). The perfect 2⫻tiling path (set A) yields an assembly covering essentially the entire chromosome in huge sequence contigs. More than 99% of the sequence lies in contigs⬎10 kb, and more than 43% in contigs⬎500 kb. The N50 contig length (the lengthLsuch that 50% of the sequence lies in contigs of at leastL) is 421 kb. The huge size of the contigs is not surprising, because the underlying data have no true gaps, and the reads have large overlaps that are readily detected by a shotgun assembly algorithm. By contrast, the random 2⫻coverage (set B) yields tiny contigs. The N50 contig length is ⬍2 kb for the random coverage compared with 421 kb for the perfect tiling path. This result is also not surprising, because the random 2-fold coverage necessarily leaves many true gaps and small overlaps (12). Thus, shotgun assembly programs cannot assemble long contigs from such data.
We next compared the results for sets A and C (Table 2). The 2⫻perfect tiling path yields dramatically larger contigs than 5⫻
random shotgun data. The N50 length is almost 40-fold larger for the perfect tiling path than for the 5⫻ random data (421 vs. 11 kb).
These results show that a fundamental limitation in genome sequence assembly is the random nature of the data. A perfect tiling path avoids this issue and implicitly preserves the under-lying assembly information.
¶See ref. 2. The nature of ‘‘shredding’’ is mentioned in passing on p. 1309, column 3,
paragraph 4; the implications for assembly are not discussed in the paper.
Table 1. Reported statistics for genome assemblies in the HGP and Celera papers
Category
Celera
HGP
WGS Faux WGS Faux CSA
Sequence coverage 5.1⫻Celera 5.1⫻Celera 5.1⫻Celera 7.5⫻HGP
⫹7.5⫻HGP ⫹7.5⫻HGP
12.6⫻total 12.6⫻total
Length (in Gb) of draft genome assembly, counting only bases with known sequence*
NR 2.587 2.654 2.693
Length (in Gb) of draft genome assembly, including unknown nucleotides in gaps†
NR 2.848 2.906 2.916
Proportion of sequence in euchromatic genome present in draft genome assembly, %‡
NR 89 91 92
Number of contigs§ NR 221,036 170,033 149,821
Number of scaffolds§ NR 118,968 53,591 87,757
Number of components, to be anchored in genome¶㛳 NR 118,968 3,845 942
NR, not reported. The HGP and Celera papers differ in how assembly statistics are generally described. The HGP paper typically cites the number of known nucleotides in the assembly, excluding the unknown bases in the gaps. The Celera paper generally cites the total length ‘‘covered’’ or ‘‘spanned’’ by the assembly; this figure includes the roughly 0.25 billion unknown bases in gaps. However, comparable numbers can be extracted from the two papers.
*For Celera, see table 3 in ref. 2. For HGP, see table 8 in ref. 1.
†For Celera, see table 3 in ref. 2. For HGP, see second footnote to table 8 in ref. 1.
‡Number of known bases of draft genome sequence divided by total length of euchromatic portion of human genome (2.92 Gb). §For Celera, see table 3 in ref. 2. For HGP, see table 7 in ref. 1.
¶For Celera’s faux WGS, see table 3 in ref. 2. For Celera’s CSA, see ref. 2, p. 1313, column 2, paragraph 3. For HGP, see tables 7 and 8 in ref. 1.
㛳Components refers to the units that must be independently anchored in the genome. These are scaffolds in the case of WGS and clone contigs in the case of
CSA and HGP.
The results have several clear implications for the faux WGS assembly. First, dissection of the HGP contigs into a 2⫻perfect tiling path suffices to allow their nearly complete reconstruction (even up to hundreds of kilobases) without the explicit need for positional information. Second, a 2⫻perfect tiling path contains much more inherent assembly information than 5⫻ random coverage. It is not surprising, then, that the combined assembly quite faithfully (although not completely) reproduced the fin-ished sequence of chromosome 22.
Thus, for the portions of the genome where sequence was available from the HGP, it is impossible to learn from the paper the respective contributions of the two data sets. On the one hand, the WGS reads can fill gaps, link contigs, and correct misassemblies. On the other hand, sequence from the BAC contigs was used directly in a final assembly step to fill gaps (in a process the authors referred to as ‘‘external gap walking’’). In any case, the fact is that there is very little difference in the coverage and continuity of the faux WGS assembly using the two data sets and the HGP genome sequence.
Anchoring the Faux WGS Assembly.Although the faux WGS as-sembly is not a meaningful test of a true WGS asas-sembly, it is nonetheless worth examining for insight about other issues pertinent to genome assembly. In particular, a key measure of the faux WGS assembly is the proportion of the genome sequence contained in large, anchored components. Although all sequence produced by the HS strategy can be localized to a small region of the genome (namely, a mapped BAC clone), the sequence components produced by the WGS assembly are initially free-floating islands that do not contribute to a genome assembly until they have been anchored. In the current case, the Celera authors aimed to anchor their sequence components by using the HGP’s STS maps.
The faux WGS assembly yielded 221,036 contigs linked
to-gether into 118,986 scaffolds (sets of contigs joined by paired reads from both ends of a plasmid insert) and contained a total of 88.6% of the euchromatic genome (Table 1). If one focuses only on scaffolds larger than 30 kb, their number is small enough to allow them to be anchored. But these scaffolds contain only
⬇2.334 ⫻ 109 bases (see table 3 in ref. 2) or⬇79.9% of the
euchromatic genome, leaving⬇20% of the euchromatic genome unanchored.
To anchor more of the genome, the full set of nearly 119,000 scaffolds must be used. But this quantity vastly exceeds the number that can be anchored by using existing STS maps. Localizing so many scaffolds would require a large directed mapping effort, which could only commence after the assembly was completed.
Moreover, these 119,000 scaffolds still contain only 88.6% of the euchromatic genome. The remaining 11.4% lies in the 25% of the reads that remain unassembled or is missing entirely from the WGS coverage. Clearly, it is not feasible to anchor this portion of the genome.
Compartmentalized Sequence Assembly.The second joint assembly (CSA) used a local clone-based rather than a genome-wide WGS approach. In fact, the CSA was conceptually identical to the HGP’s HS approach, and it explicitly used all of the HGP’s clone-based sequence and map data.
Briefly, the CSA analysis began by assigning Celera’s WGS reads to individual HGP BAC clones (by matching their se-quences to the assembled sequence contigs) then to overlapping sets of HGP BACs, dubbed ‘‘compartments’’ (there was a total of 3,845 HGP compartments). The CSA then performed sepa-rate local sequence assembly on each of the compartments (using both the Celera WGS reads and faux HGP reads corresponding to the compartment). The number of compartments was small enough that nearly all could be readily anchored to the chro-mosomes by using the available HGP map resources.
Fig. 2. Random vs. perfect spacing in 100 kb. (Upper) Two-fold coverage in perfectly spaced reads. (Lower) Two-fold coverage in randomly selected reads. There are frequent regions in which the adjacent reads either fail to overlap or the overlap is too small to allow reliable detection (⬍40 bp). These breaks in continuity are indicated by vertical lines.
Table 2. Implications on assembly using perfect tiling paths of faux data based on simulated data from finished sequence from human chromosome 22*
2⫻perfect tiling path 2⫻random coverage 5⫻random coverage
N50 contig length†(kb) 421 kb ⬍2 kb 11 kb Sequence in contigs⬎5 kb, % ⬎99 6.4 80 Sequence in contigs⬎10 kb, % 99 0.2 55 Sequence in contigs⬎20 kb, % 98 ‡ 20 Sequence in contigs⬎50 kb, % 94 ‡ 0.5 Sequence in contigs⬎100 kb, % 87 ‡ ‡ Sequence in contigs⬎500 kb, % 43 ‡ ‡ Sequence in contigs⬎1000 kb, % 29 ‡ ‡
*The finished sequence of human chromosome 22 was decomposed into random reads of length 550 bp, with the indicated total coverage. The reads were either randomly selected or chosen to comprise a perfect tiling path with overlaps between consecutive reads having constant size. The reads were assembled into contigs using the WGS assembly programARACHNE(10,11).
†Refers to the lengthLsuch that 50% of all nucleotides are contained in contigs of lengthⱖL. ‡⫽less than 0.1%.
Waterstonet al. PNAS 兩 March 19, 2002 兩 vol. 99 兩 no. 6 兩 3715
The construction of compartments closely mirrored the HGP’s construction of clone contigs and used the HGP clone sequences, STS content, and fingerprint clone maps.储The local sequence assembly was similarly straightforward. The compart-ments had an average size of⬇760 kb (only a few times larger than a BAC clone) and were readily assembled by using standard computer programs such as PHRAP(by P. Green, available at http:兾兾www.phrap.org兾). The resulting scaffolds were anchored and then further ordered and oriented by using the HGP’s STS content and fingerprint clone maps.
The CSA thus provides a revised version of the HGP assembly based on the addition of WGS reads to the individual clone contigs. All of the biological analyses reported in the Celera paper were based on the CSA sequence.
Discussion
Here, our primary purpose is to examine whether the recently published paper from Celera Genomics (2) provides insight into the performance of the WGS approach on mammalian genomes. Our analysis indicates that it is not possible to draw meaningful conclusions about the WGS approach because the authors did not perform an analysis of their own data by itself. Instead, they used an unorthodox approach to incorporate simulated data from the HGP. In particular, the paper presented only joint assemblies of Celera’s 5.1-fold WGS data together with a perfect tiling path of faux reads that implicitly retained the full infor-mation inherent in the HGP’s 7.5-fold coverage. Furthermore, the joint assemblies were anchored to the genome by using the HGP’s clone and marker maps.
We should emphasize that our analysis does not imply that a WGS approach cannot, in principle, produce a valuable draft sequence of a mammalian genome. To the contrary, we are optimistic that this approach will be possible with improved computational algorithms. Indeed, we expect that the WGS approach can play a useful role in obtaining a draft sequence from various organisms, including the mouse (13). For the mouse, with 6-fold WGS coverage (13) and the use of improved algorithms (11), it has yielded initial assemblies with N50 scaffold lengths exceeding 1 Mb and N50 contig lengths of 16 kb. Conceivably, such improved algorithms could yield similar re-sults from human WGS data.
Whether the WGS approach alone can provide an efficient technique for producing a finished genome sequence, however, remains an open question. To obtain the complete sequence of the mouse genome (13), the WGS data are being used in conjunction with clone-based data. The WGS assembly has been anchored to an extensive BAC-based physical map by matching the sequence contigs to BAC-end sequences, thereby localizing numerous small contigs and providing longer range continuity. Moreover, the BACs serve as substrates for producing a finished sequence, as is being done in the human and fly. Current experience suggests that clone-based sequencing will remain an essential aspect of producing finished sequence from large, complex genomes.
Although the Celera paper leaves open many methodological issues, it does demonstrate one of the HGP’s core tenets, the value of making data freely accessible before publication. As the analysis above shows, the availability of the HGP data contrib-uted to Celera’s ability to assemble and publish a human genome sequence in a timely fashion. When speed truly matters, open-ness is the answer.
1. International Human Genome Sequencing Consortium (2001)Nature (Lon-don)409,860–921.
2. Venter, J. C., Adams, M. D., Myers, E. W., Li, P. W., Mural, R. J., Sutton, G. G., Smith, H. O., Yandell, M., Evans, C. A., Holt, R. A.,et al. (2001)Science291, 1304–1351.
3. Sanger, F., Coulson, A. R., Hong, G. F., Hill, D. F. & Petersen, G. B. (1982) J. Mol. Biol.162,729–773.
4. Edwards, A., Voss, H., Rice, P., Civitello, A., Stegemann, J., Schwager, C., Zimmermann, J., Erfle, H., Caskey, C. T. & Ansorge, W. (1990)Genomics6, 593–608.
5. Adams, M. D., Celniker, S. E., Holt, R. A., Evans, C. A., Gocayne, J. D.,
Amanatides, P. G., Scherer, S. E., Li, P. W., Hoskins, R. A., Galle, R. F.,et al. (2000)Science287,2185–2195.
6. Weber, J. L. & Myers, E. W. (1997)Genome Res.7,401–409. 7. Green, P. (1997)Genome Res.7,410–417.
8. Marshall, E. & Pennisi, E. (1998)Science280,994–995. 9. Marshall, E. (1999)Science284,1906–1909.
10. Batzoglou, S. (2000) Ph.D. thesis (Massachusetts Institute of Technology, Cambridge).
11. Batzoglou, S., Jaffe, D. B., Stanley, K., Butler, J., Gnerre, S., Mauceli, E., Berger, B., Mesirov, J. & Lander, E. S. (2001)Genome Res.12,177–189. 12. Lander, E. S. & Waterman, M. S. (1988)Genomics2,231–239. 13. Mouse Genome Sequencing Consortium (2001)Genesis31,137–141.
储See ref. 2, p. 1313, column 2, paragraph 3 and p. 1314, column 2, paragraph 2.
Commentary
On the sequencing and assembly of the
human genome
Eugene W. Myers*, Granger G. Sutton, Hamilton O. Smith, Mark D. Adams, and J. Craig Venter Celera Genomics, 45 W. Gude Drive, Rockville, MD 20850
O
n June 26, 2000, Celera Genomics and the International Human Ge-nome Sequencing Consortium (HGSC) announced at the White House the com-pletion of the first assembly of the human genome and the completion of a rough draft, respectively. In February of 2001, the two teams simultaneously published their analyses of the genome sequences generated (1, 2). The joint announcement and subsequent publications were a result of long discussions among Celera and HGSC scientists on reducing the negative rhetoric and demonstrating to the public that both teams were working for the public good. Now three laboratory leaders from the public consortium, Waterston, Lander, and Sulston (WLS), argue that Celera did not produce an independent sequence of the human genome or mean-ingfully demonstrate the whole-genome shotgun (WGS) technique (3). This con-clusion is based on incorrect assumptions and flawed reasoning.Our Starting Point Was a Shredding of Several Hundred Thousand Bactigs, Not of the HGSC Genome Assembly. The key assertion of WLS is that by using information from the HGSC, Celera’s method implicitly re-tained the full assembly structure pro-duced by the HGSC. This is incorrect. As described in table 2 of ref. 1, we combined our data with a uniformly spaced 2⫻
shredding of 677,708 individual bactigs, contigs of bacterial artificial chromosomes (BAC) clones shotgun sequenced by the HGSC,notthe genome assembly reported in ref. 2. The goal of including this se-quence was to take advantage (with attri-bution) of the work of the HGSC to the extent that it would contribute additional sequence coverage. The global order and the overall sequence of the genome were determined by using the set of 27 million mate-paired reads generated at Celera. Mate-pairs are sets of reads that are ad-jacent to one another in the genome and serve to link together nearby segments to promote assembly. The 38.7-fold genome coverage spanned by these mate-pairs provided the long-range order (over mil-lions of basepairs) of both assembly meth-ods reported in ref. 1. Without the Celera
data, the best assembly that we could have produced would have been the 677,708 completely unordered bactigs, assuming that every shredded bactig would recon-stitute itself during assembly as is claimed by WLS.
Simulation Using Chromosome 22 Alone Leads to a Distorted View of Assembly.WLS use a simulation to argue that a uniformly spaced 2⫻ shredding would naturally re-sult in such a reassembly of the HGSC bactig data. However, this exercise was not applied to the genome. Rather, it was applied to a single finished high-quality chromosome, constituting only 1% of the genome. It is thus misleading for the fol-lowing reasons. First, the assembly prob-lem is 100 times more complex for the genome than for a single chromosome, as the complete genome contains approxi-mately 100 times more copies of each repetitive element than chromosome 22. Second, the majority of the HGSC data was in 6–8 kbp bactigs that were some-times overlapping and occasionally misas-sembled, and whose sequence accuracy was as poor as 4% error near the tips. So assembling a shredding of such sequence must permit differences in read overlaps, whereas assembling a shredding of a fin-ished sequence need not. Celera’s assem-bler considers all overlaps at 94% or greater similarity as equivalent (4) and uses the pairing of end-sequence reads as the principal factors for achieving accu-rate order. Traditional assemblers that make local decisions based on the degree of overlap similarity are intrinsically too error prone to be reliable at the scale of
mammalian WGS. Third, unlike the con-tiguous sequence of chromosome 22 used in the simulation, the HGSC data avail-able in September of 2000 consisted of 5% predraft sequence consisting of 1⫻–3⫻
light-shotgun reads of BACs, 75% rough-draft unordered bactigs of BACs derived from 3⫻–5⫻shotgun data of each BAC, and only 20% finished sequences of indi-vidual BACs (table 2 of ref. 1).†
Assembly Simulation with a Real-World Sce-nario Shows No Implicit Reassembly.We re-peated the simulation experiment of WLS, but under a progression of conditions to demonstrate the impact of these real-world factors. With 100% identity (Table 1, first row) required for overlap, chromo-some 22 is reconstituted from shredded reads by Celera’s whole-genome assem-bler to the same degree as in the simula-tion reported by WLS. But when imper-fect overlaps are permitted (94% identity, second row), as is required to truly ac-commodate sequencing errors in the HGSC data, the impact of near-identity repeats just within chromosome 22 be-comes apparent: a much larger number of contigs are generated. When assembled in the context of the remaining 99% of the See companion article on page 3712 in issue 6 of volume 99. *To whom reprint requests should be addressed. E-mail:
†The HGSC data are described by WLS as a 7.5⫻data set, but
it is not a 7.5⫻randomshotgun data set. Different regions of the genome were represented by BACs that had been sequenced to different fold coverage. Having finished 12⫻
sequence in one part of the genome does not improve the result in regions where there is only 2⫻or no data at all.
Table 1. Shredded data does not inherently reassemble Data set Overlap criterion No. of contigs Mean size, kbp N50 size,* kbp 2⫻shred of chromosome 22 100 781 43.2 2,488.5 2⫻shred of chromosome 22 94 2,433 13.8 256.0 Reconstruction of chromosome 22 in a 2⫻shred of all HGSC data
94 10,142 3.6 20.4
2⫻shred of all HGSC data 94 2,081,677 1.7 6.8
In isolation, a perfect 2⫻shred of chromosome 22 reassembles well. In the context of the entire genome and when a provision is made for imperfect overlaps, the degree of reassembly is much lower. *Refers to the minimum lengthLsuch that 50% of all nucleotides are contained in contigs of lengthⱖL.
www.pnas.org兾cgi兾doi兾10.1073兾pnas.092136699 PNAS 兩 April 2, 2002 兩 vol. 99 兩 no. 7 兩 4145– 4146
genome (third row), the reassembled se-quence for chromosome 22 is even more fractured. Finally, if one looks at contig sizes over a shredding of all of the HGSC data, 80% of which is rough draft (fourth row), the picture is even worse. When one (i) permits error in the overlaps, (ii) ex-pands the problem to 100% of the ge-nome, (iii) considers that most of HGSC data is rough draft, and (iv) includes another 5.1⫻ of Celera data, data that further involves polymorphic variation across 5 individuals, WLS’s claim of ‘‘im-plicit reassembly’’ is seen to be completely unfounded.
We shredded the HGSC dataset to overcome errors inherent in HGSC unfin-ished sequence including low-quality bac-tig ends and bacbac-tig misassemblies, and we were not under any illusions that this was akin to random coverage of the genome. A 2⫻ shredding was the minimal way to incorporate all the HGSC data while giv-ing it the least weight in an assembly involving 5⫻ of Celera data. The mate-pair data from Celera’s whole-genome libraries was the driving force for assembly by both methods presented in ref. 1. Thus while neither the Compartmentalized Shotgun Assembly (CSA) nor Whole-Genome Assembly (WGA) represents a completely ‘‘pure’’ application of whole-genome sequencing, the whole-whole-genome sequence dataset produced at Celera de-termined the structure and content of the genome assemblies.
There Are Substantial Quantitative and Qual-itative Differences Between Celera’s Pub-lished Sequence and That of the HGSC. Be-cause Celera and the HGSC both published sequences giving about 2.6 Gbp of the genome and we used the HGSC data in GenBank, one might mistakenly conclude that the two results published in February of 2001 are identical. But parity in the amount of sequence does not imply equality in terms of order or content. Celera’s assembly had substantially better long-range contiguity (half of Celera’s se-quence was in scaffolds over 3.56 Mbp long, whereas half of the HGSC sequence was in scaffolds under 0.27 Mbp long). Moreover, Celera’s end-sequence reads empirically validated the high accuracy of the contigs and their order in scaffolds and
showed the HGSC sequence to have an ordering mistake every 70 kbp (figure 7 of ref. 1).
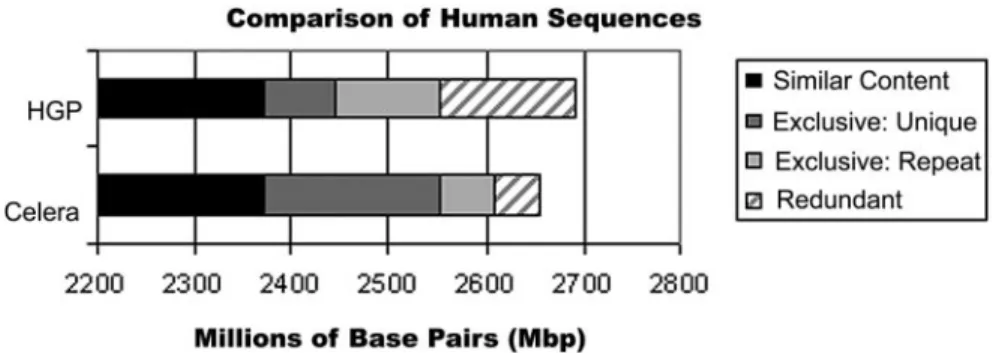
A sequence-level, whole-genome com-parison further shows that there is sub-stantial difference in the content of the two assemblies as summarized in Fig. 1. The HGSC assembly contains about 140 Mbp of redundant data that should have been assembled into the remainder of the genome. Celera’s CSA assembly by con-trast had only 50 Mbp of redundant data. If one removes these artifacts, Celera had 2.61 Gbp and the HGSC had 2.55 Gbp with about 420 Mbp represented in only one assembly or the other, a difference of 15.0% of the combined sequence. A ma-jority of sequence unique to the HGSC assembly is in short segments of 1–3 kbp and is predominantly interspersed repeti-tive sequence. By contrast, most of the sequence unique to the Celera assembly is in large (⬎30 kbp) segments and is non-repetitive in nature. The genome se-quences reported (1, 2) are thus quite different, demonstrating that having 2.6 Gbp of data is not the same as having it properly assembled.
Celera’s assembly was missing the inte-riors of highly similar repetitive elements and the extremely dense repeat regions near the centromeres, whereas the HGSC reconstruction was missing as much as 10% of the unique, information-rich parts of the genome. The basic explanation is that although we input the sum of the two data sets, the Celera assembler only
out-puts that portion of the genome that it can assemble with confidence.
Whole-Genome Shotgun Sequencing as the Paradigm for the Future.We have built the first of a new breed of assemblers for putting together ultra-large shotgun data sets. In 1995, when the Haemophilus in-fluenzae genome was sequenced with a WGS approach (5), the assembler avail-able at the time was not perfect, but it produced a result sufficient to finish the genome with a real economy of effort. Now prokaryotic genomes are routinely sequenced this way (www.tigr.org). The scenario today is the same as that of 1995 with respect to the WGS sequencing of large vertebrate genomes. We agree with the optimism of WLS that WGS will ‘‘play a useful role in obtaining a draft sequence from various organisms, includ-ing the mouse’’ (3). We produced a draft sequence of the mouse genome in June 2001 that has subsequently been of great use in permitting whole-genome analyses (e.g., refs. 6 and 7).
We remain resolute in our goal of pro-viding the most accurate and complete version of the human genome for scien-tists to use in making scientific and med-ical breakthroughs. A careful, indepen-dent reevaluation of the approaches taken by the publicly funded labs could lead to many more genomes being accurately and rapidly sequenced to the benefit of the entire community.
1. Venter, J. C., Adams, M. D., Myers, E. W., Li, P. W., Mural, R. J., Sutton, G. G., Smith, H. O., Yandell, M., Evans, C. A., Holt, R. A.,et al. (2001) Science291,1304–1351.
2. International Human Genome Sequencing Con-sortium (2001)Nature (London)409,860–921. 3. Waterston, R. H., Lander, E. S. & Sulston, J. E.
(2002)Proc. Natl. Acad. Sci. USA99,3712–3716. 4. Myers, E. W., Sutton, G. G., Delcher, A. L., Dew, I. M., Fasulo, D. P., Flanigan, M. J., Kravitz, S. A., Mobarry, C. M., Reinert, K. H., Remington, K. A., et al. (2000)Science287,2196–2204.
5. Fleischmann, R. D., Adams, M. D., White, O., Clayton, R. A., Kirkness, E. F., Kerlavage, A. R.,
Bult, C. J., Tomb, J. F., Dougherty, B. A., Merrick, J. M.,et al. (1995)Science269,496–512. 6. Young, J. M., Friedman, C., Williams, E. M., Ross,
J. A., Tonnes-Priddy, L. & Trask, B. J. (2002) Hum. Mol. Genet.11,535–546.
7. Zhang, X. & Firestein, S. (2002)Nat. Rev. Neu-rosci.5,124–133.
Fig. 1. Celera and HGSC reconstructions are not the same. The black segments, about 2.34 Gbp, agree between the two reported sequences. The dark gray segments represent sequence unique to an assembly that is essentially nonrepetitive, whereas the light gray segments represent repetitive DNA unique to each assembly. The gray hatched segments represent redundant data that should have been assembled with other sequences, and should therefore not be counted.
Commentary
Whole-genome disassembly
Phil Green*
Howard Hughes Medical Institute and University of Washington, Seattle, WA 98195
T
he race to sequence the human ge-nome has garnered a level of popular attention unprecedented for a scientific endeavor. This fascination has partly been caused of course by the importance of the goal; but it also reflects the Olympian nature of the contest, which opposed two capable teams with sharply contrasting cultures (public and private), personali-ties, and strategies. Titanic struggles being the stuff of mythology, it should perhaps not surprise us that a number of myths regarding this race have already emerged. In a recent issue of PNAS, Waterstonet al. (1), leaders of the public effort, help to dispel one of these myths, involving the controversial ‘‘whole-genome shotgun’’ strategy used by Celera.Issues surrounding sequencing strate-gies will no doubt seem arcane to most readers but are worth considering if only because they may significantly influence the pace and cost of DNA sequencing during the remainder of the Genome Era. That a strategy is needed at all arises from the fact that a sequencing ‘‘read,’’ the tract of data obtainable in a single experimental run, is only a few hundred bases in length and contains errors. Getting reliable se-quence of a larger DNA segment there-fore requires a method for generating and piecing together a number of reads cov-ering the segment. Since its introduction by Sanger and colleagues over 20 years ago, the favored method for this purpose has comprised the following steps: an ini-tial ‘‘shotgun’’ phase in which reads are derived from subclones essentially ran-domly located within the targeted region; an assembly phase, in which read overlaps are determined (the main challenge here being to identify and discard false overlaps arising from repeated sequences) and used to approximately reconstruct the un-derlying sequence; and a finishing phase in which additional reads are obtained in directed fashion to close gaps and shore up data quality where needed. The shot-gun phase usually involves obtaining a substantial redundancy of read coverage of the target, typically at least 6–8-fold, to minimize the amount of work required during the labor-intensive finishing phase. For the human genome, which com-prises some 3 billion base pairs, the public effort adopted a well-tested modular
ap-proach in which large fragments of the genome (roughly 150,000 bp in size) were first cloned into a bacterial host (as bac-terial artificial chromosomes or BACs) and then sequenced individually by the shotgun method. Among other advan-tages, this ‘‘clone by clone’’ strategy sim-plifies the assembly problem (by reducing its scale and the likelihood of errors caused by repeats), generates substantial sequence tracts of known contiguity that can be mapped relatively efficiently back to the genome, and yields resources that are useful in the finishing stage and for independent tests of assembly accuracy. A ‘‘draft’’ version of the genome sequence (based on a somewhat lower shotgun depth coverage for most of the clones) obtained in this way was published last year (2).
In contrast, Celera adopted a whole-genome shotgun approach, which pur-ports to accelerate the above process by bypassing the intermediate step of cloning large fragments and instead derives reads directly from the whole genome. The pro-cess is clearly riskier because of the sig-nificantly greater possibility of assembly error, but had been successfully used by Celera to produce a near-complete se-quence of the Drosophila genome (3, 4) with about 2,500 gaps. Its ability to cope with the human genome, which is 30-fold larger and much richer in repetitive se-quences than Drosophila, remained un-clear. Against all odds, Celera demon-strated that it worked (5), producing an independent human genome sequence of comparable or higher quality than that obtained by the public effort.
Or did they?
This is the myth that Waterstonet al.(1) overturn. Far from constructing an inde-pendent sequence, Celera incorporated the public data in three important ways into their ‘‘whole genome assembly.’’ (i) The assembled BAC sequences from the public project were ‘‘shredded’’ in a man-ner that (as Waterston et al. show) re-tained nearly all of the information from the original sequence, and used as input. (ii) In a process called ‘‘external gap walk-ing,’’ unshredded, assembled, public BAC sequences were used to close gaps. (iii) Public mapping data were used to anchor sequence islands to the genome. As a
result, the assembly reported by Celera cannot be viewed as a true whole-genome shotgun assembly. Moreover, accuracy tests in ref. 5, which involved comparison of Celera’s assembly to finished portions of the public sequence, are virtually mean-ingless because the finished sequence was itself used in constructing the Celera assembly.
We are left with no idea how a true whole-genome assembly would have per-formed. It is striking, however, that even with this use of the public data, what Celera calls a whole-genome assembly was a failure by any reasonable standard: 20% of the genome is either missing altogether or is in the form of 116,000 small islands of sequence (averaging 2.3 kb in size) that are unplaced, and for practical purposes unplaceable, on the genome.
Several other myths beyond the one discussed by Waterstonet al.have become widely accepted. One is that the whole genome shotgun approach was in large measure responsible for Celera’s rapid pace at sequencing the Drosophila and human genomes. In fact, their great speed was mainly because of the acquisition of a huge, unprecedented sequencing capacity (some 200⫹capillary machines, each able to produce 500-1000 reads per day) as a result of their corporate ties with a man-ufacturer of these machines. That this was really the key factor is evident from the fact that when the public effort acquired similar capacity, they were able to attain a comparable or higher throughput by using the clone by clone approach.
A third myth is that the whole-genome approach saves money. Although defini-tive judgement here should await a rigor-ous cost accounting, the basic economics of sequencing by the clone by clone ap-proach have apparently not changed greatly over the past 5 or 6 years. Less than 10% of the overall cost goes to BAC mapping and subclone library construc-tion, 50–60% to the shotgun itself (assum-ing a coverage of 6–8⫻), and the remain-ing 30–40% goes to finishremain-ing. Even if it works as intended, the whole-genome ap-proach can save at best the 10% involved See companion article on page 3712 in issue 6 of volume 99. *E-mail: [email protected].
www.pnas.org兾cgi兾doi兾10.1073兾pnas.082095999 PNAS 兩 April 2, 2002 兩 vol. 99 兩 no. 7 兩 4143– 4144
in BAC mapping and subclone libraries; but, as was argued in ref. 6, even this minimal savings is likely to be negated, or worse, by inefficiencies created at the shotgun or finishing stage. TheDrosophila project (3, 4) is a case in point (in fact, the only case we have). Celera generated shot-gun coverage of nearly 15⫻, approxi-mately double what is used in a clone by clone approach, which was necessitated in part by the effective loss of about 1兾4 of the reads (‘‘chaff’’) that could not be incorporated into the whole-genome as-sembly. Moreover, the finishing process (being carried out by G. Rubin and col-leagues) has involved generating reads on a clone by clone basis from a minimally overlapping set of mapped BACs span-ning the genome. Thus, none of the costs that were supposed to be saved by the whole-genome shotgun in fact were, and the effective doubling of the cost of the shotgun itself significantly increased the cost of the whole project beyond that of a clone by clone approach.
A widespread view among many ob-servers has been that, issues like the above aside, the genome race has in any case at least been good for science. In my view this also is a myth. Competition does have the beneficial effects of motivating the competitors to work harder and to criti-cally challenge their opponents’ work (as
with the current paper by Waterston et al.), but it also has the downside of en-couraging shortcuts that may compromise the ultimate result. In the case of the genome race, the downside seems to have outweighed the benefits. For example, Celera reduced the amount of shotgun data it generated from the originally in-tended 10⫻ (7), which is probably the minimal amount necessary to afford any hope of success with a true whole-genome approach, to a mere 3.8⫻ (their article reports 5.1⫻, but this must be reduced by the 26% lost as ‘‘chaff’’), which inciden-tally is only about 1兾2 the amount re-ported for the public project. As a result, it became impossible to objectively com-pare the two approaches. The competition probably did induce Celera to eventually provide greater access to their data than they otherwise would have, although this access is under terms that fall substantially short of the original promise (7) to deposit the data in the public databases, and fails to uphold the essential principle that sci-entific discoveries should form a basis on which other scientists are free to build.
In my view, the effect of the competi-tion on the public side was also undesir-able. Although their rate of sequence pro-duction accelerated greatly after the competition was engaged, this was mainly attributable to the availability of the
higher throughput new technology (capil-lary sequencers). Partially offsetting the throughput gains were apparently gross inefficiencies in the process of sequence acquisition that resulted from the pressure to rapidly process BACs before a mini-mally overlapping set had been identified. Furthermore, it remains quite unclear whether the decision to produce an inter-mediate quality product (the draft) will prove wise in the long run; although the major centers have stated a commitment to finish the genome, motivation of many participants has surely been reduced now that the project is regarded by the public as complete. It remains to be seen whether a truly finished genome will appear by next year as promised.
Is there a lesson in this? I am not sure there is one. Competition is of course a basic fact of nature that we cannot and should not eliminate. The undesirable re-sults it may have produced in this case— widespread misinformation, exaggerated claims, and a compromised product—are mostly due to the high-profile nature of the contest, and perhaps also to the fact that a significant amount of corporate money was riding on the perceived success of one team. The best that those of us on the sidelines can do is to continue to scrutinize the results.
1. Waterston, R. H., Lander, E. S. & Sulston, J. E. (2002)Proc. Natl. Acad. Sci. USA99,3712–3716. 2. International Human Genome Sequencing Consortium (2001)Nature (London)409,860– 921.
3. Adams, M. D., Celniker, S. E., Holt, R. A., Evans, C. A., Gocayne, J. D., Amanatides, P. G., Scherer,
S. E., Li, P. W., Hoskins, R. A., Galle, R. F.,et al. (2000)Science287,2185–2195.
4. Myers, E. W., Sutton, G. G., Delcher, A. L., Dew, I. M., Fasulo, D. P., Flanigan, M. J., Kravitz, S. A., Mobarry, C. M., Reinert, K. H., Remington, K. A., et al.(2000)Science287,2196–2204.
5. Venter, J. C., Adams, M. D., Myers, E. W., Li,
P. W., Mural, R. J., Sutton, G. G., Smith, H. O., Yandell, M., Evans, C. A., Holt, R. A.,et al.(2001) Science291,1304–1391.
6. Green, P. (1997)Genome Res.7,410–417. 7. Venter, J. C., Adams, M. D., Sutton, G. G.,
Kerlavage, A. R., Smith, H. O. & Hunkapiller, M. (1998)Science280,1540–1542.
Revisiting the independence of the publicly and privately
funded drafts of the human genome
T
he field of human genetics had a landmark year in 2001. Two groups published a draft se-quence of the human genome at the same time (1, 2). One paper was from the International Human Genome Project (HGP) (1), a public group that provided open access to their sequence as it was obtained. The other paper was authored by a private group, Celera Genomics (2), who do not provide im-mediate or free access to their sequence data. Accordingly, Celera used both the publicly available data and their inde-pendently generated data in compiling their draft of the human genome. The public group used a conservative, divide-and-conquer strategy in which segments of the genome were first cloned into bacteria to yield bacteria artificial chromosomes (BACs). These BACs were mapped and then se-quenced. The private group used a bolder, whole-genome shotgun (WGS) method in which genome-wide sequence fragments are assembled computationally.In March of 2002, Waterston, Lander, and Sulston, leaders in the HGP, claimed that the public data played a critical enabling role in the Celera as-sembly (3). They argued that Celera’s highly ordered shredding of the HGP data preserved so much of its long-range assembly that the Celera assembly was not independent and was not achieved by the WGS method. PNAS invited two commentaries on this paper. One, by Green (4), concluded that
be-cause Celera’s work was anchored by sequence islands obtained from the pub-lic database, the assembly reported by Celera could not be viewed as a true WGS assembly. The second commen-tary, by some of the leaders of the Celera initiative (5), strongly disagreed with the allegations. They argued that Celera started with shredded bactigs and not with reassembled HGP data. They also criticized the simulation Wa-terstonet al.used to support their argu-ment and said it was based on incorrect and oversimplified assumptions.
From the feedback PNAS received after the publication of these papers, it was clear that the views presented were so divergent that it was very difficult for the scientific community to evaluate the claims. The exact areas of disagreement were not even clear. The major issues in the disagreement were submerged in the incompatible claims. The controversy is not about the validity of the WGS method for sequencing very large ge-nomes, but about whether Celera used this method to assemble the human ge-nome in 2001. If their results depended on the HGP, which is derived from a hierarchical method, then they did not assemble an independent draft se-quence. There is no problem in Celera using the HGP data; it was there for everyone. The disagreement is in how it was used. Was it shredded so well that it only provided additional sequence reads to supplement the extensive ones by Celera? Or was much of the sequence integrity retained? There is also no
question that Celera produced a high-quality draft. The question is only whether the long-range assembly was independent.
Accordingly, we thought that one more round of comments would clarify the situation. Representatives from both the public HGP group and the private Celera group agreed to author a second and final round of perspectives. These papers can be found on pages 3022 and 3025 (6, 7). We used the following ground rules for these invited papers. In the first round, because the HGP group initiated the debate (3), we provided Celera an advance copy of the HGP pa-per so they could prepare their rebuttal commentary (5). We did not show the rebuttal to the HGP group. This second round of the debate has followed similar protocol. The HGP contribution (6), which addresses the first response by Celera and provides new arguments, was sent to Celera for their reply (7). We felt that Celera should have the last word as it was their assembly that was being questioned. Accordingly, the HGP authors did not see, and thus could not comment on, the Celera response.
We asked both groups to stick to the scientific issues, to avoid recrimination, and to explain technical terms clearly. Both contributions were reviewed and revised. We believe that this second round of the debate has clarified the issues surrounding this epoched contri-bution to science.
Nicholas R. Cozzarelli 1. Lander, E. S., Linton, L. M., Birren, B., Nusbaum,
C., Zody, M. C., Baldwin, J., Devon, K., Dewar, K., Doyle, M., FitzHugh, W.,et al.(2001)Nature409, 860–921.
2. Venter, J. C., Adams, M. D., Myers, E. W., Li, P. W., Mural, R. J., Sutton, G. G., Smith, H. O., Yandell, M., Evans, C. A., Holt, R. A.,et al.
(2001)Science291,1304–1351.
3. Waterston, R. H., Lander, E. S. & Sulston, J. E. (2002) Proc. Natl. Acad. Sci. USA 99, 3712–3716.
4. Green, P. (2002)Proc. Natl. Acad. Sci. USA99, 4143–4144.
5. Myers, E. W., Sutton, G. G., Smith, H. O., Adams,
M. D. & Venter, J. C. (2002)Proc. Natl. Acad. Sci. USA99,4145–4146.
6. Waterston, R. H., Lander, E. S. & Sulston, J. E. (2003)Proc. Natl. Acad. Sci. USA100,3022–3024. 7. Adams, M. D., Sutton, G. G., Smith, H. O., Myers, E. W. & Venter, J. C. (2003)Proc. Natl. Acad. Sci. USA100,3025–3026.
www.pnas.org兾cgi兾doi兾10.1073兾pnas.0830968100 PNAS 兩 March 18, 2003 兩 vol. 100 兩 no. 6 兩 3021
More on the sequencing of the human genome
Robert H. Waterston*†, Eric S. Lander‡, and John E. Sulston§
*Department of Genome Sciences, University of Washington, Seattle, WA 98195;‡Whitehead Institute兾Massachusetts Institute of
Technology Center for Genome Research, Cambridge, MA 02142; and§Wellcome Trust Sanger Institute, Wellcome Trust Genome
Campus, Hinxton, Cambridge CB10 1SA, United Kingdom
T
he international Human Ge-nome Project (HGP) and Celera Genomics published arti-cles last year on the sequence of the human genome (1, 2). In a recent article (3), we analyzed aspects of the Celera article.We noted that the article did not re-port an assembly of Celera’s own data but rather reported only joint assemblies based on a data set that included the assembled genome sequence of the HGP. Approximately 60% of the under-lying sequence data and 100% of the mapping data used in Celera’s analysis came from the HGP, and the HGP ge-nome assembly itself contained 90% of the euchromatic sequence of the human genome. We also noted that Celera used various approaches for using the HGP data (referred to as perfect tiling, gap filling,¶and compartmentalized
assem-bly; see Fig. 1) that implicitly preserved much of the HGP assembly information. We concluded that Celera’s assemblies made extensive and inextricable use of the HGP genome information and thus were not an independent assembly of the human genome.
Our critique was not concerned with whether the Celera authors could have produced an independent assembly with their own data; it simply noted that the article (2) did not do so. It did not ad-dress the potential utility of the whole-genome shotgun (WGS) approach; it simply noted that the article was not a meaningful application of the approach. (The utility of WGS for producing draft genome sequence has not been the question. The issue has been whether it provides the best route for producing a finished genome sequence of a complex mammalian genome such as the human or whether clone-based sequencing is more effective; experience to date strongly suggests the latter.) Also, it was not concerned with which strategy or assembly was better; because Celera’s assembly made use of both data sets, meaningful comparisons are impossible.
Our report elicited two commentaries. One, by Green (4), concurred with our analysis. The other, by Myerset al.(five of the Celera authors), raised certain issues about our analysis (5). Specifi-cally, they acknowledge that their ap-proaches preserved the HGP assembly to some extent, but they contend that
the role of the HGP data in the Celera joint assemblies was minor.
Here we address the technical issues raised by Myerset al.We show that the analysis of Myerset al. underestimates the role of the HGP genome assembly in their work because they focus on only one of the ways in which the HGP data were used. Moreover, we note that the major role of the HGP sequence can be directly seen from the properties of the Celera assembly.
Assembly Reconstruction
Genome assemblies are characterized by the degree of sequence continuity, mea-sured by N50 contig length.储The HGP draft genome sequence had an N50 con-tig length of⬇82 kb (see table 7 of ref. 1).
Our main point in ref. 3 was that the approaches of Celera implicitly preserve most HGP assembly information at such length scales. That is, typical-size contigs can be reconstructed largely from the HGP data.
By contrast, Myerset al.assert that Celera’s analysis only preserved the HGP assembly up to scales of⬇7 kb in their WGS assembly (see table 1 of ref. 5).
Even this degree of implicit recon-struction is quite substantial. It is⬇ 13-fold larger than typical read lengths (⬇0.5 kb) and only⬇12-fold smaller than assembled HGP contigs (⬇82 kb). It dramatically simplifies further assembly.
Thus, Myerset al. substantially under-estimate the use of the HGP assembly, because the analysis focuses only on the impact of perfect tiling but does not consider the other uses of the HGP data.
Perfect Tiling Begins the Reconstruction In ref. 3 we illustrated that a genome assembly could be largely reconstructed from a perfect tiling. Specifically, we showed that a WGS assembly program (6) can reconstruct long sequence con-tigs from a perfect tiling of the com-pleted chromosome 22 sequence. Most †To whom correspondence should be addressed at:
Depart-ment of Genome Sciences, University of Washington, Box 357730, Seattle, WA 98195-7730. E-mail: waterston@ gs.washington.edu.
¶Gap filling is referred to as ‘‘external gap walking.’’ The
device is mentioned in passing on pg. 1312 of ref. 2; the implications for assembly are not discussed in the article.
储The N50 length is the lengthxsuch that 50% of the se-quence is contained in contigs of lengthxor greater.
Fig. 1. Uses of the HGP genome assemblies in Celera genome assemblies and impact on assembly. (A) HGP data were used in three ways. (i) Perfect tiling. HGP’s contigs were decomposed (‘‘shredded’’) into perfect tiling paths of uniformly overlapping ‘‘faux’’ reads with no gaps (3). (ii) Gap filling. Gaps between linked contigs (gray) in assemblies were filled by directly taking sequence from unshredded assembled HGP BACs (stippled). (iii) Compartmentalized assembly. The main assembly in ref. 2, used for all biological analyses, was obtained by first matching the WGS reads of Celera to small compartments corresponding to overlapping HGP BACs and then assembling each compartment locally. (B) Average N50 contig lengths for reconstructing a perfect tiling from either a long (⬎1 megabase) or typical (length distribution as in the HGP assembly) contig. The four lines correspond to assembly of the perfect tiling reads alone or with WGS reads (⬎100⫻) and either with or without quality scores. The third line (from ref. 5) has short contigs because lack of quality scores limits overlap detection. The fourth line shows that these limitations are substantially overcome by gap filling (seeGap Filling and Compartmentalized Assembly Extend the Reconstruction).
remaining gaps could then be filled by gap filling.
Myerset al.suggest that this exam-ple was not fully realistic, because per-fect tilings would need to be reassem-bled among a vast sea of WGS reads. We tested this point using our previous criteria (3) but found it had no signifi-cant impact on the ability to recon-struct perfect tilings. Specifically, we compared reconstructing perfect tilings alone vs. amid a huge excess (⬎100⫻) of WGS reads. Even under such an extreme scenario, the N50 contig length remains extremely large (Fig. 1Aii, lines 1 and 2).
Myerset al.also remark that (i) a fin-ished chromosome is not representative of typical HGP contigs, and (ii) Celera’s perfect tilings were constructed from individual HGP bacterial artificial chro-mosomes (BACs) rather than merged BAC sequences. Although true, these points do not affect the analysis. Com-putational analysis shows that small con-tigs are more readily reconstructed than large contigs: The ratio of reconstructed N50 length to input contig length in-creases as contig size dein-creases, ap-proaching 1 for contig sizesⱕ40 kb. Similarly, computational analysis shows that the N50 length of reconstructed perfect tilings is comparable whether one begins with individual BACs or merged BAC sequences.
In short, we confirm our previous conclusion (3) that perfect tilings implic-itly contain most assembly information and that this information is readily ex-tracted by typical assembly pro-grams (6).
Why then do Myerset al.report that they can only partially reconstruct per-fect tilings? The answer seems to lie in the details of the Celera assembler. Most current assembly programs distin-guish between true overlaps and close but spurious matches with related se-quences by exploiting sequence-quality scores (reflecting error rates for each base); even a modest sequence differ-ence at high-quality bases is sufficient to reject spurious matches. Because the Celera assembler does not use quality scores, it employs a much more conser-vative, and thus less powerful, approach for detecting true overlaps; an apparent overlap is accepted only if there is no other sequence in the genome with ⱖ94% sequence identity.** Accordingly,
fewer true overlaps are accepted in the initial assembly stage.
As a result, the Celera assembler can-not fully exploit the assembly informa-tion inherent in the perfect tilings and instead yields only a partial reconstruc-tion of the HGP assemblies (N50⬇
7 kb).
Gap Filling and Compartmentalized Assembly Extend the Reconstruction In focusing only on the initial step of overlap detection, Myerset al.do not consider the subsequent uses of the assembled HGP data that further ex-tend the N50 length. In later stages of the Celera assembly, contigs are linked together by using mate-pair informa-tion, and the resulting gaps are then filled by various methods that may use sequence not included in the initial stages. One of these methods is gap filling, which fills gaps between linked sequence contigs by directly using as-sembled HGP BACs. This device and others largely eliminate any gaps aris-ing from incomplete overlap detection in the HGP-derived perfect tilings in the first stage of assembly.
To exploit gap filling, only a small amount of mate-pair information is needed to establish linkage between contigs. We found that the equivalent of 10% of the Celera WGS data (⬍0.5⫻coverage) readily yielded enough linking information to allow gap filling to fill most gaps in the as-sembled HGP sequence (Fig. 1Aii, line 4). The approach ensures that the con-tinuity of Celera’s joint assemblies should not be worse than that of the HGP assemblies.
Similarly, the compartmentalized as-sembly, the main assembly method used in the article, dramatically decreases the problem of overlap detection due to spurious matches by restricting the anal-ysis to tiny local regions (rather than the whole genome). For example, Myerset al.report that Celera’s assembler can readily reconstruct perfect tilings to N50 lengths of 256 kb when focusing even on a large region such as chromosome 22 (see table 1 of ref. 3).
In short, Celera’s approaches implic-itly reconstruct the HGP sequence to a much greater extent than suggested by Myerset al.
Direct Evidence from N50 Length The most direct evidence of the impor-tance of the HGP data for the Celera work comes from considering the prop-erties of the Celera assembly itself (Table 1).
Celera’s joint assembly has an N50 contig length††of⬇86 kb, which is
nearly identical to that of the HGP as-sembly at⬇82 kb. The similarity be-tween the assemblies is no coincidence.
In fact, it is mathematically impossible to obtain such a large N50 from Celera’s own 5.1⫻WGS coverage. In-deed, our computer simulations (3) show that 5.0⫻WGS should yield N50 of only⬇11 kb. Consistent with this es-timate, Celera recently reported (7) that its draft sequence of the mouse genome based on 5.3⫻WGS coverage had N50 of⬇14 kb.
The large N50 could not even occur from⬇7.1⫻WGS, as Celera implies it used in the joint assemblies by combin-ing 5.1⫻of its WGS data with 2⫻ sam-pling of the HGP assemblies. Simula-tions indicate an expected N50 in the range of 30 kb. Consistent with this, the recent⬇7⫻WGS assembly by the pub-lic Mouse Genome Sequencing Consor-tium (8) obtained an N50 of⬇24 kb.
The large N50 (⬇82 kb) of the HGP assemblies was due partly to the HGP’s deeper underlying coverage and the use of localized assembly with programs ex-ploiting quality scores and crucially to the directed reads used in finishing for the clone-based approach. This continu-ity was carried over to Celera’s assembly through various devices such as perfect tiling and gap filling.
Thus, contrary to the suggestion of Myerset al., the sequence continuity of Celera’s assemblies was vastly extended by use of the HGP genome assemblies. Assembly Comparison
Myerset al.cite various statistics to sug-gest that the Celera assembly is radically different from the HGP assembly. In fact, the difference is modest even by their own analysis. Total coverage dif-fers by 2% of the human genome, with Celera adding⬇7% to the HGP and omitting⬇5% it was unable to assem-ble. Sequence continuity was nearly identical (86 vs. 82 kb), and the long-range connectivity was similar (3.6 vs. 2.3 megabases).‡‡
**Myerset al.suggest that Celera’s assembler used weak criteria for overlap detection to cope with low-quality HGP data. In fact, the same criteria were used for Celera’s own work on fly and mouse. The error rate for HGP raw reads was⬍0.1% at most bases and for assembled con-tigs was⬍0.1% at⬎95% of bases.
††The N50 contig length can be calculated from figure 2 of
ref. 9 or directly from the assembly.
‡‡Myerset al.suggest that the HGP has lower long-range
connectivity by focusing on connectivity by paired-end links rather than BAC contigs (see table 6 of ref. 1).
Table 1. N50 contig lengths
Celera human assembly ⬇86 kb
HGP human assembly ⬇82 kb
Expectation for 5⫻WGS ⬇11 kb
Celera mouse assembly (5.3⫻WGS) 14.6 kb
Waterstonet al. PNAS 兩 March 18, 2003 兩 vol. 100 兩 no. 6 兩 3023
Conclusion
Our goal is to respond to the suggestion of Myerset al.(5) that Celera’s assem-bly was largely independent of the HGP genome assembly that was used as input. The data (with a majority of the under-lying sequence information and all map-ping information coming from the HGP), the methodology (with ap-proaches that preserve assembly infor-mation), and the properties of the
as-sembly (extensive sequence continuity, as shown by N50) all indicate that the as-sembly reported in the Celera article is instead appropriately viewed as a refine-ment built on the HGP assemblies. This is not meant to suggest that the Celera arti-cle did not add some sequence, as well as additional order and orientation, beyond the HGP sequence that was used as input to their assembly process.
Of course, the ultimate goal is a fin-ished sequence of the human genome to
serve as a lasting foundation for medi-cine. Perhaps the most important differ-ence between the public and private ge-nome efforts is that only the HGP has chosen to take on the task of converting the draft genome sequence to a finished genome sequence. This goal seems well within reach. As of this writing, the HGP has produced finished sequence covering⬇98% of the euchromatic hu-man genome.
1. International Human Genome Sequencing Con-sortium (2001)Nature409,860–921.
2. Venter, J. C., Adams, M. D., Myers, E. W., Li, P. W., Mural, R. J., Sutton, G. G., Smith, H. O., Yandell, M., Evans, C. A., Holt, R. A.,et al.(2001) Science291,1304–1351.
3. Waterston, R. H., Lander, E. S. & Sulston, J. E. (2002) Proc. Natl. Acad. Sci. USA 99,3712– 3716.
4. Green, P. (2002)Proc. Natl. Acad. Sci. USA99, 4143–4144.
5. Myers, E. W., Sutton, G. G., Smith, H. O., Adams, M. D. & Venter, J. C. (2002)Proc. Natl. Acad. Sci. USA99,4145–4146.
6. Batzoglou, S., Jaffe, D. B., Stanley, K., Butler, J., Gnerre, S., Mauceli, E., Berger, B., Mesirov, J. & Lander, E. S. (2001) Genome Res. 12, 177– 189.
7. Mural, R. J., Adams, M. D., Myers, E. W., Smith, H. O., Gabor Miklos, G. L., Wides, R., Halpern, A, Li, P. W., Sutton, G. G., Nadeau, J.,et al.(2002) Science296,1661–1671.
8. Mouse Genome Sequencing Consortium (2002) Nature420,520–562.
9. Aach, J., Bulyk, M. L, Church, G. M., Comander, J., Derti, A. & Shendure, J. (2001)Nature409, 856–859.