Microfinance Performance: Does Financing Choice Matter?
Peter W MuriuDepartment of Finance, Birmingham Business School, University of Birmingham, 116 Edgbaston Park Road, Birmingham, West Midlands, B15 2TY, United Kingdom
Abstract
Since the seminal work by Modigliani and Miller in (1958) and the subsequent revision of their initial position (1963), several studies have shown that capital structure influences performance of corporate entities. Although the empirical evidence remains mixed and contestable, microfinance industry appears to have been neglected in this research agenda. This paper examines the impact of financing choice on microfinance performance. The study is pioneering in using system GMM estimators in studies of microfinance performance. The analytical framework uses an unbalanced panel dataset comprising of 210 MFIs across 32 Sub-Sahara Africa countries operating from 1997 to 2008. We test the robustness of the models with different specifications that confirm the general result. The estimation results show that a proportionally higher deposit-assets ratio is associated with improved profitability. However, the magnitude of this effect is sensitive to MFI age. MFIs with a higher portfolio-assets ratio are more profitable. But the impact also depends on MFI age. Consistent with the agency costs hypothesis, the results show that highly leveraged MFIs are more profitable. This calls for the development of appropriate regulatory policies that would enable MFIs to access long-term debt to enhance profitability and to strengthen the financial stability.
JEL classification: F3, G21, G32
Keywords: Microfinance institutions; sub-Sahara Africa; performance, capital structure
1. Introduction
A profitable microfinance industry is vital in maintaining the stability of the financial system. Low profitability weakens the capacity of microfinance institutions (henceforth MFIs) to absorb negative shocks, which subsequently affect solvency. Why is financing choice important for MFIs profitability? First, MFIs access to grant funding and other safety net protections may increase incentives for risk shifting or lax risk management, potentially affecting profitability. Second, a higher leverage can enhance profitability during good economic times but can also increase the riskiness of the firm’s earnings stream.
Table 1 shows that MFIs have two broad funding options beyond debt which include deposits (if regulation allows), and equity (commercialization). Deposits may be a cheaper option than debt or equity if volume and terms leverage potential market demand. It is evident that MFIs in Africa rely more on savings to finance their activities. Mature MFIs are more likely to have been licensed to mobilize deposits which translate to a higher deposit-assets, deposit-loans and loans-assets ratio, ceteris paribus. Similarly, mature MFIs have higher debt-equity composition. As MFIs get older, the weight of external financial sources steadily decreases while debt-equity gradually becomes a more important source of finance. It also appears that NGO type of MFIs rely more on debt financing relative to other type of MFIs, perhaps because many are not regulated to mobilize deposits. This is also replicated on the ‘for profit’ status.
Table 1: Financing Structure
Debt to equity Deposits to loans Deposits to total assets Portfolio to assets
Units (%) (%) (%) (%)
Year 2006 2007 2008 2006 2007 2008 2006 2007 2008 2006 2007 2008 Age1 New (1-4 yrs) 2.5 3.4 2.9 4.0 6.2 0.0 2.7 3.7 0.0 76.4 71.2 77.9 Young (5-8 yrs) 1.8 2.7 3.1 0.0 1.1 4.8 0.0 1.0 2.1 81.7 80.6 74.4 Mature (over 8 yrs) 2.9 3.2 3.4 10.1 6.2 1.4 4.9 4.6 3.3 78.1 79.4 79.3 Charter Type Bank 1.2 1.7 1.9 69.3 64.0 66.3 41.6 41.4 51.0 67.3 68.0 71.6 Credit Union 3.9 4.6 4.4 79.8 80.8 71.9 61.7 62.1 61.0 80.6 78.6 78.8 NBFI 2.7 3.3 3.5 0.0 0.0 0.0 0.0 0.0 0.0 80.4 81.0 81.4 NGO 1.3 1.7 2.0 0.0 0.0 0.0 0.0 0.0 0.0 80.6 80.9 80.7 Methodology Individual 3.7 4.2 4.0 20.4 16.9 31.0 9.5 9.7 20.8 80.5 82.2 83.0 Individual/ Solidarity 1.9 2.5 2.9 0.6 0.7 0.4 0.1 0.4 0.3 79.9 79.1 77.5 Solidarity 1.7 2.4 2.8 19.8 19.0 20.4 11.3 13.9 13.9 67.6 70.4 72.7 Village Banking 2.0 2.2 2.6 0.0 0.0 0.0 0.0 0.0 0.0 77.2 79.1 79.7 Profit Status Profit 4.1 4.3 4.3 21.1 26.8 21.5 16.1 11.9 17.2 73.0 71.9 71.5 Not for Profit 1.7 2.1 2.5 0.0 0.0 0.0 0.0 0.0 0.0 80.8 80.9 81.0 Region Africa 2.3 2.5 2.7 54.4 51.2 49.1 31.2 34.0 34.9 66.7 66.5 67.3 Asia 4.5 1.4 4.9 23.3 23.5 24.2 11.2 14.8 11.7 74.0 71.0 73.5 ECA 1.8 2.7 2.9 0.0 0.0 0.0 0.0 0.0 0.0 87.2 86.7 89.1 LAC 2.5 2.6 3.2 0.0 0.0 0.0 0.0 0.0 0.0 80.5 81.2 82.2 MENA 0.6 0.8 0.9 0.0 0.0 0.0 0.0 0.0 0.0 82.1 81.0 82.0 Source: MicroBanking Bulletin, September 2010 (Issue No. 20)2.
Voluntary deposits3 are a source of inexpensive and sustainable source of funds for MFI lending but, deposits may require widespread branching and other expenses which has implications on MFIs profitability. MFIs with access to donor funds may not respond to funding pressures to operate efficiently or may deliberately choose outreach over profitability by serving poorer or rural clients with higher delivery costs (Armendáriz and Morduch, 2010). The shift from donor dependence to that of raising funds from capital markets also raises fundamental questions regarding the role of funding instruments on MFIs profitability.
Studies on the impact of capital structure on firm performance have in most cases been carried out in developed economies on large and listed firms. Although several research questions remain unresolved in the banking industry, due to informational opaqueness (Berger and Bonaccorsi, 2006), it similarly remains so for the microfinance industry where information asymmetry is also severe. The basic Modgliani and Miller (1958), principles are applicable to banking institutions, but only after accounting for the fundamental differences on how lenders operate (Cebenoyan and Strahan 2004). Though this has motivated researchers to examine the impact of capital structure on performance, the main focus has been on non-financial firms.
The empirical evidence as a whole is mixed and remains contestable. Using data on commercial banks in the USA, Berger and Bonaccorsi (2006) show that higher leverage is related to higher profit efficiency. Bogan (2009) investigates the impact of existing sources of funding on the efficiency and financial sustainability of MFIs. He finds causal evidence to the effect that more use of grants by MFIs decreases operational self-sufficiency (OSS). Although his focus is not on profitability, his study nevertheless fails to control for endogeneity and other country and firm level covariates.
While focusing on small and medium enterprises (SMEs) capital structure and profitability, Abor (2005) shows that short-term debt ratio is positively correlated with return on equity. This confirms Michaelas et al. (1999) who found a positive impact on performance but is inconsistent with Caesar and Holmes (2003), Esperance et al. (2003), Chiang et al. (2002), who document a negative relationship between profitability and both long-term and short-term debt. Other studies that find high levels of debt in the capital structure to decrease firm's profitability include Gleason et al (2000), Hirota (1999), Krishnan and Moyer (1997), Rajan and Zingales (1995). Although studies on microfinance are rare, most of these findings are consistent with pecking order theory. With mixed evidence in the literature, it is clear that financing choice and profitability is an important research agenda in the microfinance industry.
The main goal of this study is therefore to investigate the role of individual funding instruments in influencing MFIs profitability. To achieve this objective, we employ dynamic panel data analysis to a broad sample of 167 MFIs across 32 Sub-Sahara Africa economies, for the period 1997-2008. Rather than delve into whether
1 Microbanking Bulletin Tables classify MFIs into three categories (new, young, and mature) based on the maturity of their microfinance operations. This is calculated as the difference between the year they started their microfinance operations and the year of data submitted by the institutions.
2 Available at http://www.themix.org/publications/microbanking-bulletin/2010/09/microbanking-bulletin-september-2010-issue-no-20
3 "Deposits'' in this study is applicable to any type of instrument used by MFIs to mobilize deposits and is not restricted to any particular type of instrument, such as time deposits or savings accounts.
profitability is directly related to particular stages of a life cycle pattern of funding (see Helms, 2006), this study uncovers the role that individual funding instruments play in determining MFI profitability. In spite of a possible association between capital structure and microfinance profitability, there have been no systematic studies for a large group of MFIs with a focus on Africa that provide robust evidence on how variations in funding affect MFI profitability.
We explore this issue by addressing the following research questions: does the source of funding matter on microfinance profitability? What is the optimal mix of debt and equity that ensures profitability? It is in light of these research questions, that this study seeks to broaden and deepen our understanding on the impacts of MFIs capital structure on profitability.
This study makes contributions to the existing knowledge four fold. First, since capital constraints have hindered the expansion of MFIs activities in Africa (Lafourcade, et al 2006), the question of how best to finance MFIs is crucial. Understanding the role played by various instruments of funding is important both to the shareholders and MFIs management—who are interested in making effective decisions that would boost MFIs profitability.
Second, the huge interest in MFI investment vehicles1 makes this study unique. There has been a rapid growth in foreign investment by various funds that tend to be more commercially oriented, such as the Dexia Microcredit Fund and MicroVest (Abrams and Ivatury, 2005). Any evaluation of microfinance profitability without factoring the role played by various investment vehicles that target their money towards MFIs, would be incomplete.
Third, at the policy level the outcome of this study is important to the MFI managers and regulators when making choices on alternative funding instruments. Firm managers who are able to identify the optimal capital structure are rewarded for minimising a firm's cost of finance thereby maximising the firm's revenue. From a creditor's perspective, it is possible that the financing structure improves the understanding of MFIs' risk management strategies.
The remainder of this paper proceeds as follows: the next section describes the theoretical underpinnings. Section 3 outlines the empirical strategy while section 4 describes the econometric approach. Section 5 presents data and the measurements of variables of interest. In section 6 we present the empirical results and explore a number of robustness checks. Conclusions and policy suggestions are offered in the final section by pointing out some unresolved issues.
2. Theoretical underpinnings
One of the important financial decisions confronting a firm is the choice between debt and equity. The seminal paper dealing with irrelevance of debt in capital structure for determining firm value by Modigliani-Miller (1958) included a number of assumptions—one of which was absence of corporate tax. Subsequently when Modigliani-Miller (1963) factored corporate tax in the model, it was found that theoretically the value of a firm should increase with debt because of higher interest tax shield. But monotonic increase of debt for higher tax shield increases bankruptcy cost especially when profitability of the firm is low and fluctuating.
Although we may not be able to determine the exact debt target level objectively in microfinance because of MFIs industrial organization, trade off theory explains that that there is a limit to debt financing and the target debt may vary from MFI to MFI depending on profitability, among a host of other factors. Consistently profitable MFIs with alot of tangible assets that can be offered as collateral for debt may have a higher target debt ratio. Simply put high proportion of fixed interest capital to equity would imply that the MFI is highly indebted and therefore risks becoming insolvent. On the other hand highly leveraged MFIs may perform better by enjoying scale economies, enhancing their ability to boost profitability.
The ‘pecking order’ theory as developed by Myers (1984) is based on the premise that successful firms with high and consistent profitability rarely goes for debt financing. The theory suggests that if the firm issues equity shares to finance a project, it has to issue at less than the prevailing market price. This signals that the shares are overvalued and the management is not confident to service the debt if the project is financed by debt. Thus issue of shares is 'bad news'. On the contrary if external borrowing is used to finance the project, it sends a signal that the management is confident of the future prospect of serving debt. Hence debt is preferred over shares in financing decision. If debt is issued, pricing of debt instrument becomes a problem. To circumvent this problem the management may wish to finance a project by the retained earnings. Thus, financing follows an order, first-retained earning, then-debt and finally equity when debt capacity gets exhausted. This explains why the profitable firm uses less debt.
These preferences exhibit transitivity. MFIs in Sub-Sahara Africa may represent an interesting scenario
1 These include Microfinance Investment Vehicles (MIVs) and private funds. Foreign capital investments in microfinance passed the $10 billion mark in December 2008. Total assets of the top 10 microfinance investment vehicles (MIVs) reached US $3.6 billion at the end of 2009, having grown by 31% in 2008 (CGAP 2009).
since retained earnings are on average zero and perhaps following the pecking order a vast majority may opt for debt since most are not regulated, thus have no access to capital market. Should we find evidence that is consistent with the pecking order theory then our results should highlight a negative relation between capital structure and MFI profitability.
The agency cost theory is premised on the idea that the interests of the firm’s managers and its shareholders are not perfectly aligned. In their seminal paper Jensen and Meckling (1976) emphasized the importance of the agency costs of equity in corporate finance arising from the separation of ownership and control of firms whereby managers tend to maximize their own utility rather than the value of the firm. Agency costs can also arise from conflicts between debt and equity investors. These conflicts arise when there is a risk of default. The risk of default may create what Myers (1977) referred to as an “underinvestment” or “debt overhang” problem. In this case, debt will have a negative effect on the value of the firm and therefore profitability. Alternatively, there may be instances where managers have incentives to take excessive risks as part of risk shifting investment strategies as postulated by Jensen and Meckling, (1976) and Williams (1987). Thus a higher level of leverage may be used as a disciplinary device to reduce managerial cash flow waste through the threat of liquidation (Grossman and Hart, 1982; Williams 1987) or through pressure to generate cash flow to pay interest expenses (Jensen, 1986). In these situations, debt will have a positive effect on the value of the firm and profitability.
Agency costs theory is very relevant in the microfinance industry since incentives of MFIs management and in particular, those of social investors may not be aligned. Some MFIs have continuously received grants and subsidized loans from development organizations to finance their transition into deposit-taking institutions. Grant money and other safety net protections may for example create moral hazard or increase incentives for risk shifting or lax risk management and subsequently affect profitability. Donors and social investors have vested goals inclined towards bolstering outreach while MFI management may be profit motivated. Moreover, regulators may set minimums for equity capital in order to deter excessive risk taking which may affect agency costs directly and alter MFIs’ financing choice with consequences on profitability. This may have an impact on the overall MFI profitability in either direction.
3. Empirical Strategy
3.1 Design of the model
Microfinance industry is characterized by a different production function to that of the conventional retail profit seeking banks or any other corporate entity. The sector is diverse in terms of industrial organizational, with MFIs organized as credit unions, non-governmental organizations (NGOs), banks and non-bank financial institutions. It is therefore plausible that there are additional factors that impact on MFI profitability in addition to firm level specifics. An empirical approach built on theoretical predictions relevant to MFIs may be useful in identifying the impact of various funding instruments that may predict profitability.
Microfinance literature devotes considerable attention to the life cycle model which is basically a process of “NGO transformation”. It posits that sources of MFIs financing are linked to the stages of MFI development (Helms, 2006). However, this does not explain the entire story with respect to financing choice and the subsequent impact on profitability. We abstract from this line of argument since our primary focus is on the impact different sources of funding have on the outcome―profitability. We contend that the life cycle aspect can be accounted for by interacting various parameters of interest with the age of the MFIs. We therefore estimate the following basic regression:
)
1
.
3
.(
...
...
...
...
1 1 1 1 ict m ct M m m j ict J j j N n n ict n ict ict=
a
+
h
P
+
b
C
+
b
C
+
b
C
+
e
P
å
å
å
= = -ict i ictu
m
e
=
+
Where outcome is a measure of the profitability
P
ict of microfinance institution i in year t located in country c, with i=1. . .N, t=1, . . ., T; α is the regression constant,C
nict represents capital structure variables,C
ictjrepresents other MFI or firm-level characteristic, and
C
mct represents country-level characteristics.ict i
ict
u
m
e
=
+
is the disturbance;u
iis the unobserved complete set of MFI-specific effect andm
ictis the idiosyncratic error.h
,
b
are the coefficients to be estimated.P
ict-1 is the one-period lagged profitability andh
is the speed of adjustment to equilibrium. This is a one-way error component regression model, where
)
,
0
(
~
s
u2u
iIIN
and independent ofm
it~
IIN
(
0
,
s
m2)
.Due to the significant differences that exist in the Sub-Sahara Africa economies microfinance industry, we test for potential country effects. We also test for time effects which may be present in the error component of the model. We contend that failure to account for these two effects is likely to bias our estimates. The econometric
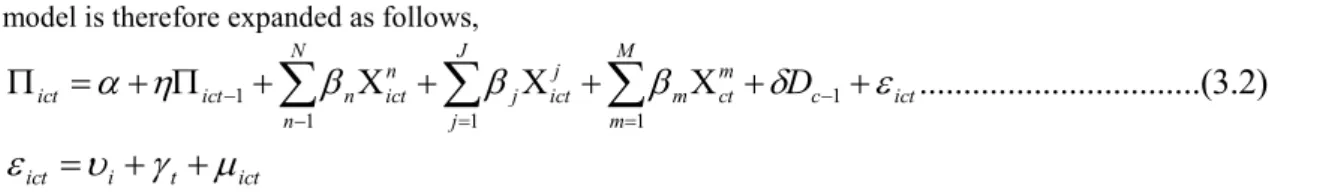
model is therefore expanded as follows,
)
2
.
3
..(
...
...
...
1 1 1 1 1 c ict m ct M m m j ict J j j N n n ict n ict ict=
a
+
h
P
+
b
C
+
b
C
+
b
C
+
d
D
+
e
P
-= = --å
å
å
ict t i ictu
g
m
e
=
+
+
Where, D denotes the country-specific dummy variables.
e
ict=
u
i+
g
t+
m
ictis the disturbance;g
tis the unobservable time effects, whereu
iis the unobserved complete set of MFI-specific effect andm
ictis the idiosyncratic error. We tested country and time hypotheses separately as well as jointly, by H0:g
2=g
3= ……=T
g
=0 and presented the results in the The Lagrange Multiplier (LM) tests in Table 2 shows that for Sub-Sahara Africa microfinance industry, both country and time specific dummy variables are insignificant. Hence, we proceed with the estimation of model 3.1Table 2: Tests for time and country effects
Model LM test P-value
0
...
3 2=
D
=
D
C=
D
χ2 (32) = 126.20 0.8200 Tg
g
g
2=
3=
...
χ2 (12) = 4.19 0.79900
...
2 3 3 2=
D
=
D
C=
=
=
t=
D
g
g
g
χ2 (44) = 35.44 0.8910Where
g
t and Ds represent time and country dummies. 3.2 Conceptual frameworkCapital structure defines various sources of MFI financing. Some MFIs use more of borrowed funds than equity or vice versa. The impact of more debt is on the various risks perceived by the providers of equity capital which is construed to have significant impact on the cost of capital. High proportion of fixed interest capital to equity would imply that the MFI is highly leveraged and therefore risks becoming insolvent. Investing in MFIs with a higher debt/equity ratio may be riskier, especially in times of rising interest rates, due to the additional interest charges.
On the contrary, highly leveraged MFIs may perform better by enjoying scale economies, thus are better able to deal with moral hazard and adverse selection, which enhances their ability to deal with risk. Additionally, debt instrument in the capital structure allows investor to discipline management by reducing the discretionary power of the management on free cash flow of the firm (Harris and Raviv, 1990). This in turn may boost profitability. We therefore postulate an indeterminate relationship between debt indicators and MFI profitability. Deposit to assets ratio is only applicable to MFIs that mobilize deposits1. A proportionally larger deposit-assets ratio will typically lead to an overall lower cost of funds, assuming that the deposits mobilization program is efficient. The higher the ratio, the more the MFI must rely on external funding, which is often a more costly source of funding than deposits. MFIs may also effectively use local depositors as in the case of Irish loan funds (Hollis, and Sweetman, 2007) not just for funding, but also because of the important discipline that depositors can impose on expenses management—which has an impact on profitability. We therefore postulate a positive relationship between MFIs that mobilize deposits and profitability.
Portfolio to asset ratio may also affect profitability. In the empirical banking literature, portfolio to asset ratio is often used both as a measure of credit risk and lending specialization. Loans are less liquid and more risky than other assets in MFI’s portfolio. The risk of default emanating from adverse selection and moral hazard issues, and the additional costs incurred in managing credit risk, requires MFIs to apply a risk premium to the interest rate charged for the loan. MFIs with a relatively high portfolio to asset ratio may therefore be at greater risk of failure.
However, if portfolio to asset ratio is interpreted as a measure of lending specialization, a high portfolio to asset ratio might indicate that MFI benefits from informational advantages, which may reduce intermediation costs and enhance profitability (Freixas, 2005). Larger share of loans to total assets may therefore translate to more interest revenue because of the higher risk. However, MFI loans are subject to significantly higher transaction costs than retail profit seeking banks, which include cost of funds for on-lending, the loan loss, and administrative costs (Cull et al 2009a). That notwithstanding, profitability should increase with a larger share of loans to assets as long as interest rates on loans are liberalized and the MFI applies mark-up pricing. We therefore predict a positive relationship between portfolio to asset ratio and MFI profitability.
1 "Deposits'' in this study is applicable to any type of instrument used by MFIs to mobilize deposits and is not restricted to any particular type of instrument, such as time deposits or savings accounts.
Control variables
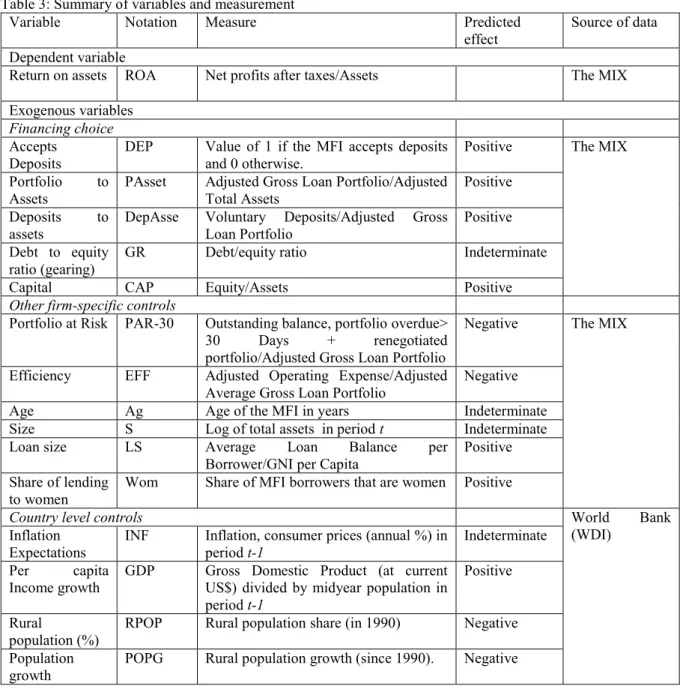
Most of the control variables in equation (3.1) are the same as those used in the other studies of MFI performance (Ahlin et al, 2011; Cull, et al, 2007; 2009; 2011). Additional MFI-specific characteristics are captured by share of lending to women. Existing literature with respect to share of lending to women remains contestable. Several studies shows that MFIs with a higher share of lending to women report better repayments, which lowers risk and increases profitability1(D’Espallier et al 2011, Pham and Lensink 2007; Pitt, Khandker and Cartwright 2006; Khandker 2005; Kevane and Wydick 2001; Pitt and Khadker 1998). On the contrary, MFIs that focus on women usually advance smaller loan size, which increases their operational costs (D’Espallier et al 2010; Balkenhol, 2007). The net result is that MFIs with a female focus have, on average similar overall profitability measures. We therefore predict an indeterminate effect on profitability a priori.
The regressions also include a number of country-level controls. We use two proxies for the macroeconomic environment; inflation and GDP per capita growth. GDP per capita2 growth is arguably the most informative single indicator of economic progress. It can be considered an approximate summary statistic for the various institutional, technological, and factor-accumulation related ingredients of development. Inflation expectation is measured at time t-1 annual % change of the GDP deflator at market prices for each country where the MFI is located for each year.
Further country-level controls include rural population share (in 1990). Microfinance is heavily dependent on personal contact for its execution. MFI clients may however often live in inaccessible locations3. Group lending may be more difficult in sparsely populated areas. We also include rural population growth (since 1990). McIntosh, de Janvry and Sadoulet (2005) found that most of the microfinance entry in Uganda in the 1990s occurred in rural areas. On the contrary, Arun and Hulme, (2008) shows that the provision of MFIs mainly focuses on the cities, towns and major rural trading centres. We therefore control for the possibility that rapidly growing rural areas may attract MFIs with a different profitability profile.
4. Econometric approach
When estimating equation (3.1), we are likely to encounter endogeneity problem: Berger and Bonaccorsi, (2006) observes that the mixed results in the previous empirical studies may be due to the possibility of reverse causation from performance to capital structure. If firm performance affects the choice of capital structure, then failure to take this reverse causality into account may result in simultaneous-equations bias. Further, a common empirical regularity in data suggests that MFI profitability could be very persistent due to imperfect competition, informational opacity, and serial correlation in regional/macroeconomic shocks (Berger et al, 2000). The presence of the lagged dependent variable
P
ict-1gives rise to autocorrelation.Because of the endogeneity problem, OLS estimation of the impact of financing structure on MFI profitability is biased4. We tackle these problems by moving beyond the methodology currently in use in the empirical literature of bank profitability (mainly fixed or random effects)5. We resort to the system GMM6 method of Blundell and Bond (1998). System GMM estimator is more suited to estimate MFI profitability equations in our empirical framework, than the first-differenced GMM estimator applied by some previous studies (see for example Flamini et al, 2009). MFIs profitability outcomes may be highly persistent so their lagged levels might
1 Indeed Armendáriz and Morduch (2010), points that Grameen Bank originally had a majority of male clients but decided to concentrate almost entirely on women due to repayment problems related to male clients1 and perhaps because female entrepreneurs face tighter credit availability compared to men (Fletschner 2009), even though they do not pay higher interest rates (Bellucci, et al 2010).
2 Ahlin et al (2011) use a similar measure. Demirgüc-Kunt and Huizinga (2000) used the annual growth rate of GDP and GNP per capita to identify such a relationship, while Bikker and Hu (2002) used a number of macroeconomic variables such as GDP, the unemployment rate and interest rate differentials.
3 Long distances raise transport costs and reduce factor mobility. The average population density on the continent (77 people per square kilometre) is among the lowest in the world (World Bank, 2009). With such high unit costs, it is hard for MFIs to make small loans without relying on explicit or implicit subsidies.
4 The estimation methods based on the OLS principle are vulnerable to the omitted variable bias if some important determinants of MFI profitability are not included among the regressors.
5 Studies that have used fixed or random effects include for example Flamini et al (2009); Sufian and Habibullah (2009). Kosmidou (2008), Hsiu-Ling et al (2007)
6 There are two types of GMM estimators that have been frequently used. The first one is the first-difference GMM estimator, developed by Arellano and Bond (1991), which uses first-differenced equations with suitable lagged levels as instruments. The second one is the system GMM estimator, developed by Arellano and Bover (1995) and Blundell and Bond (1998), which augments the former by addition of equations in levels with lagged first-differences as instruments. At times the lagged levels of the regressors are poor instruments for the first-differenced regressors. Thus, one should use the augmented version known as system GMM. The system GMM estimator uses the levels equation (e.g. equation (3.1) ) to obtain a system of two equations: one differenced and one in levels. By adding the second equation, additional instruments can be obtained. Thus the variables in levels in the second equation are instrumented with their own first differences. This usually increases efficiency.
be very weak instruments for the first differenced equations. In this situation, the first-differenced GMM estimator potentially suffers from a downward bias (Blundell and Bond, 1998) so the additional set of first-differenced instruments and equations in levels make the system GMM estimator more efficient by overcoming the weak instrument problem inherent to the first-differenced GMM estimator. The system GMM estimator also controls for unobserved heterogeneity.
The last challenge is the risk of omitted variables. To that end, we follow a general to specific strategy by estimating an equation with all possible regressors according to the existing literature. We, then, test through a Wald test the joint hypothesis that the coefficients of the variables that are not significant individually are equal to zero. If not rejected, we re-estimate the model only with the controls which were significant in the general regression. Otherwise, we test a less restrictive hypothesis but still trying to reduce the number of non-significant regressors to the maximum extent possible. We stop reducing the number of regressors when we can reject that the remaining set of coefficients of the control variables is equal to zero.
Finally, to confirm the validity of the instruments, we perform Hansen's or Sargan test of over-identifying restrictions, which is asymptotically distributed as
c
2(
k
)
wherek
denotes the number of over-identifying restrictions and a test of serial correlation among the residuals. We also test whether Arellano-Bond orthogonality conditions are fulfilled.5. Data and measurement
In order to capture the dynamics of relationship between capital structure and microfinance profitability in the backdrop of the theoretical underpinnings detailed in sections 2, the study used a dataset containing 2,004 observations. This corresponds to 167 MFIs for the period 1997-2008 that varies from a minimum of 10 in 1997 to a maximum of 167 in 2005 based on their financial accounts. This spans across 32 SSA economies, four different regions namely West (67), East (53), Central (17) and Southern Africa (30). Our panel is unbalanced1 since not all MFIs have information for every year—some MFIs may have closed as others enter the market.
The dataset was assembled from two sources the principal being the MIX Market database2. MFI level data was drawn from the Mix Market (http://www.mixmarket.org)3. It is a publicly available website that contains information on more than 1800 MFIs, more than 100 investors (e.g. Calvert Foundation), and nearly 200 partners (umbrella organizations that facilitate multiple MFIs’ operations)4.
With regard to MFI types, the breakdown by institutional type is as follows: 55 “credit unions", 15 “banks”, 54 “non-bank financial institutions” and 43 “non-governmental organizations (NGO)"s. We only included MFIs for which microfinance represents 91-100 percent of the activity for analysis5. Finally, we restricted the sample to MFI’s whose fiscal year corresponds to the calendar year, for comparability with the annual country -level macroeconomic and institutional development data. We merged the MFI -level dataset with country--level data from World Development Indicators (WDI).
We analyze the impact of different sources of MFI funding on profitability which include; (i) accepts deposits dummy (ii) deposits relative to assets ratio, (iii) loans relative to assets ratio and (iv) debt to equity ratio (gearing). Given that capital structure data is MFI specific and collected from MixMarket, we used the MixMarket definitions of key variables. Deposits to assets ratio measures the relative portion of the MFI’s total assets that is funded by deposits. Accepts deposits dummy variable is a binary variable which indicates whether or not the MFI mobilizes deposits. This variable is given a value of 1 if the MFI accepts deposits and set to 0 if otherwise. Loans to assets ratio is measured as the ratio of gross loan portfolio/total assets. Gearing ratio (GR) or debt to equity ratio is measured by the ratio of debt and debt-like instruments to capitalization namely short term debt + long term debt divided by total shareholders' equity or simply the debt/equity ratio. It is a measure of the percentage of capital employed that is financed by debt and long term finance.
Studies on firm performance employ various measures to test the predictions of different capital structure hypothesis. Some of the measures of performance that have been used over the years include financial ratios (Mehran, 1995), stock market return and their volatility (Cole and Mehran, 1998; Saunders et al., 1990) and also, Tobin’s Q (Himmelberg et al., 1999; Zhou, 2001). For the purpose of this study we use return on assets (ROA) as our profitability proxy. The Microfinance Financial Reporting Standards recommends the use of ROA as measures of profitability rather than financial self-sustenance (FSS) and operational self-sustenance (OSS). It is a financial
1 We opt for an unbalanced panel not to lose degrees of freedom.
2 The MIX Market and Micro Banking Bulletin databases are produced by the Microfinance Information Exchange (MIX), www.themix.org. Data on individual MFIs in the Micro Banking Bullet are confidential and can only be used with the permission of the respective MFI
3 Data on individual MFIs in the MicroBanking Bulletin are confidential and can only be used with the permission of the MFI 4 This information is taken from the mixmarket.org website during December 2010
5 Here the percentage of operations devoted to micro-finance and institutional type are reported only as current variables rather than year-by-year.
metric that is well established and understood across the finance spectrum. As such, it is a useful measure regardless of the legal status or mission of an MFI.
Due to data limitations, the empirical analysis does not address (i) grants (ii) retained earnings, (iii) share capital, (iv) debt relative to assets and (v) commercial funding liabilities ratio. We leave this for future research. All the empirical findings should be viewed in that light. Table 3 shows all variables definitions, source and measurements.
Table 3: Summary of variables and measurement
Variable Notation Measure Predicted
effect
Source of data Dependent variable
Return on assets ROA Net profits after taxes/Assets The MIX
Exogenous variables
Financing choice
Accepts Deposits
DEP Value of 1 if the MFI accepts deposits and 0 otherwise.
Positive The MIX Portfolio to
Assets
PAsset Adjusted Gross Loan Portfolio/Adjusted Total Assets
Positive Deposits to
assets
DepAsse Voluntary Deposits/Adjusted Gross Loan Portfolio
Positive Debt to equity
ratio (gearing)
GR Debt/equity ratio Indeterminate
Capital CAP Equity/Assets Positive
Other firm-specific controls
Portfolio at Risk PAR-30 Outstanding balance, portfolio overdue>
30 Days + renegotiated
portfolio/Adjusted Gross Loan Portfolio
Negative The MIX
Efficiency EFF Adjusted Operating Expense/Adjusted Average Gross Loan Portfolio
Negative
Age Ag Age of the MFI in years Indeterminate
Size S Log of total assets in period t Indeterminate
Loan size LS Average Loan Balance per
Borrower/GNI per Capita
Positive Share of lending
to women
Wom Share of MFI borrowers that are women Positive
Country level controls World Bank
(WDI) Inflation
Expectations
INF Inflation, consumer prices (annual %) in period t-1
Indeterminate Per capita
Income growth
GDP Gross Domestic Product (at current US$) divided by midyear population in period t-1
Positive
Rural
population (%)
RPOP Rural population share (in 1990) Negative Population
growth
POPG Rural population growth (since 1990). Negative
6. Empirical results and discussion
6.1 Descriptive statistics
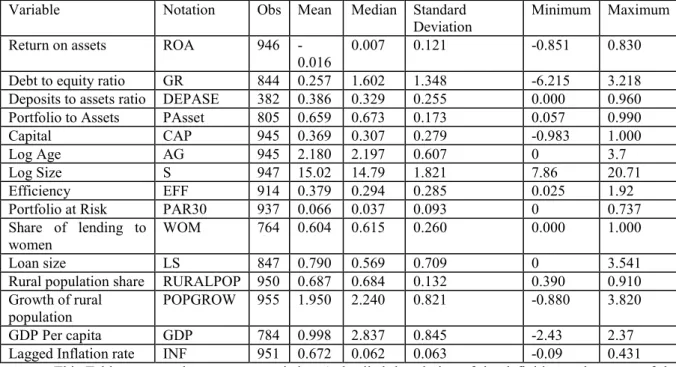
Descriptive statistics of all variables are reported in Table 4. Profitability is widely dispersed suggesting that the overall mean profitability may be driven by a few MFIs. It remains to be seen which MFI characteristics explain the wide dispersion of profitability measure. The distributions of 'age' and of 'size' variables indicate considerable heterogeneity in these characteristics. On average, majority of the MFIs lend about 66% of their assets. Most of the MFIs are not highly leveraged as shown by the mean gearing ratio of 0.26, suggesting a considerable dependence on other sources of funding (e.g voluntary savings) for their operations. This is further corroborated by the negatively skewed gearing ratio, suggesting that more MFIs may be employing less of debt in their capital structure. The standard deviation, the minimum and maximum values of gearing ratio is an indication of an industry which is highly unevenly distributed with regard to leverage levels. Existing evidence shows that whereas most MFIs at the global level rely heavily on donations and retained earnings to fund their activities, Sub-Sahara Africa
MFIs fund only 25 percent of their assets with equity (Lafourcade, et al 2006). Are these deposits significant in explaining MFIs profitability? We uncover the magnitude and direction of this variability in the next section. Table 4: Summary statistics
Variable Notation Obs Mean Median Standard
Deviation
Minimum Maximum
Return on assets ROA 946
-0.016
0.007 0.121 -0.851 0.830
Debt to equity ratio GR 844 0.257 1.602 1.348 -6.215 3.218
Deposits to assets ratio DEPASE 382 0.386 0.329 0.255 0.000 0.960
Portfolio to Assets PAsset 805 0.659 0.673 0.173 0.057 0.990
Capital CAP 945 0.369 0.307 0.279 -0.983 1.000
Log Age AG 945 2.180 2.197 0.607 0 3.7
Log Size S 947 15.02 14.79 1.821 7.86 20.71
Efficiency EFF 914 0.379 0.294 0.285 0.025 1.92
Portfolio at Risk PAR30 937 0.066 0.037 0.093 0 0.737
Share of lending to women
WOM 764 0.604 0.615 0.260 0.000 1.000
Loan size LS 847 0.790 0.569 0.709 0 3.541
Rural population share RURALPOP 950 0.687 0.684 0.132 0.390 0.910 Growth of rural
population
POPGROW 955 1.950 2.240 0.821 -0.880 3.820
GDP Per capita GDP 784 0.998 2.837 0.845 -2.43 2.37
Lagged Inflation rate INF 951 0.672 0.062 0.063 -0.09 0.431
This Table presents the summary statistics. A detailed description of the definition and sources of the variables is given in Table 3. Data has been winsorized at 10%
6.2 Correlations
The bi-variate relationships shown in the Appendix Table 1 are consistent with the argument that MFI that mobilizes retail deposits from the public are more profitable perhaps because deposits constitute cheaper funding compared to borrowed funds. An interesting observation is the positive and significant gearing ratio correlations with profitability. This may be an indication that more debt relative to equity is used to finance increased microfinance activities and that long term borrowings positively impact on profitability.
The negative rural population share (in 1990) correlation with profitability may reflect on the difficulties encountered by MFIs in employing group lending mechanism in sparsely populated areas. Of particular concern however is the high and significant bivariate correlation between population share and growth of rural population―which calls for separate inclusion of the two variables in the estimation model. The rural population growth variable is significantly correlated with greater lending to women, suggesting the importance of rural controls. Other bi-variate relationships follow expectations based on the existing literature that has used this database. Although most correlation coefficients among variables of interest are low, they are nevertheless significant but not perfect linear. Panel regression analysis allows us to investigate the strength of these correlations after controlling for other relevant covariates.
6.3 Estimation results
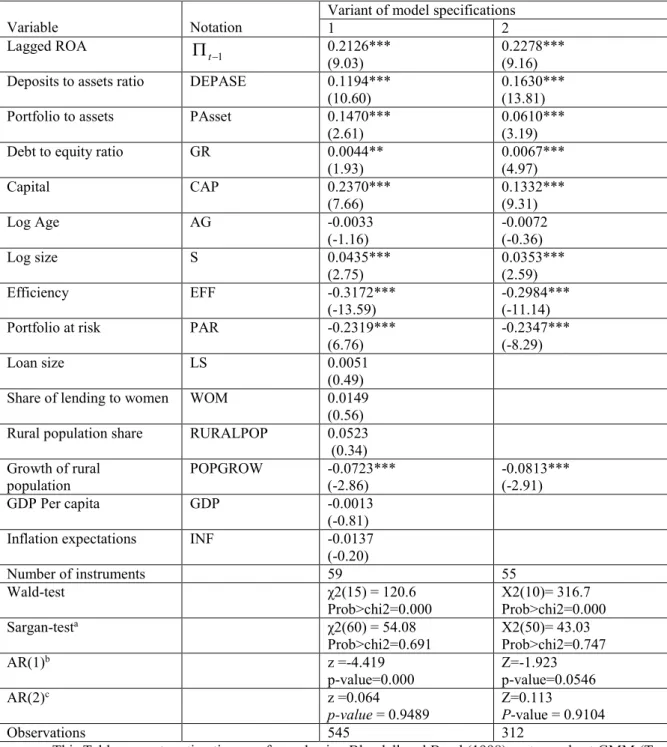
Table 5 reports results from our basic specification using ROA as the profitability measure. Interesting and new findings emerge. Our preferred system GMM estimates in model 2 suggest that source of funding is important for MFI profitability in Sub-Sahara Africa economies, which is an overwhelming support for our main hypothesis. In particular larger share of deposits to assets appears to boost MFI profitability. A plausible interpretation of these results is that a proportionally larger deposit base will typically lead to an overall lower cost of funds for the MFIs with an implication of improved profitability―assuming that the deposits program is efficient. Consistent with Cull, et al (2011), MFIs should therefore broaden their services toward mobilizing (more) deposits. This is important as it would also broaden the lending capacity of MFIs. These results are however contrary to García-Herrero, (2009) who do not find significant results in the Chinese banking industry. It is however far from a fore-drawn conclusion that what holds true for the traditional banking sector will also hold for MFI’s.
Table 5: The impact of financing choice on MFI profitability
Variable Notation
Variant of model specifications
1 2 Lagged ROA 1
-P
t 0.2126*** (9.03) 0.2278*** (9.16) Deposits to assets ratio DEPASE 0.1194***(10.60)
0.1630*** (13.81)
Portfolio to assets PAsset 0.1470***
(2.61)
0.0610*** (3.19)
Debt to equity ratio GR 0.0044**
(1.93) 0.0067*** (4.97) Capital CAP 0.2370*** (7.66) 0.1332*** (9.31) Log Age AG -0.0033 (-1.16) -0.0072 (-0.36) Log size S 0.0435*** (2.75) 0.0353*** (2.59) Efficiency EFF -0.3172*** (-13.59) -0.2984*** (-11.14)
Portfolio at risk PAR -0.2319***
(6.76) -0.2347*** (-8.29) Loan size LS 0.0051 (0.49) Share of lending to women WOM 0.0149
(0.56) Rural population share RURALPOP 0.0523
(0.34) Growth of rural population POPGROW -0.0723*** (-2.86) -0.0813*** (-2.91) GDP Per capita GDP -0.0013 (-0.81)
Inflation expectations INF -0.0137
(-0.20) Number of instruments 59 55 Wald-test χ2(15) = 120.6 Prob>chi2=0.000 Χ2(10)= 316.7 Prob>chi2=0.000 Sargan-testa χ2(60) = 54.08 Prob>chi2=0.691 Χ2(50)= 43.03 Prob>chi2=0.747 AR(1)b z =-4.419 p-value=0.000 Z=-1.923 p-value=0.0546 AR(2)c z =0.064 p-value = 0.9489 Z=0.113 P-value = 0.9104 Observations 545 312
This Table presents estimations performed using Blundell and Bond (1998) system robust GMM (Two-step) estimator. For the definition of the variables see Table 3. Robust z values are in parentheses and significance at the 10%, 5%, and 1% level is noted by *, ** and *** respectively.
The Wald test is a test of the null hypothesis that the coefficients in the given equation are all zero (Greene, 2008). A low value indicates null hypothesis rejection.
a Test for over-identifying restrictions in GMM dynamic model estimation. b Arellano-Bond test that average autocovariance in residuals of order 1 is 0 (H0: no autocorrelation).
c Arellano-Bond test that average autocovariance in residuals of order 2 is 0 (H0: no autocorrelation).
We also find portfolio to asset ratio to influence profitability in the anticipated way. Along this vein, Demirgüç and Huizinga (1999) document that banks with a relatively high share of non-interest earning assets are less profitable. A larger share of loans to total assets may therefore translate to more interest revenue because of the higher risk.
significantly related to profitability. This is consistent with Abor (2005)—but whose focus was on SMEs capital structure and profitability in Ghana. This suggests that profitable MFIs employ more debt in their capital structure. Intuitively, most profitable MFIs in Sub-Sahara Africa could be financing their operations with long-term as opposed to short-term debt instruments. If higher debt to equity ratio were to increase profitability by a greater margin than the cost of the debt, then the shareholders would benefit as more earnings are being spread among the same number of shareholders.
The effect of other MFI-specific and macroeconomic variables on profitability is in line with expectations, with notable exception of MFI age, loan size, share of lending to women which are insignificant. The insignificant result on share of lending to women coefficient may point to the fact that high repayments may not necessarily translate to profitability, perhaps because MFIs with more women clients are also less efficient and therefore less profitable (Hermes, Lensink, and Meesters 2011). This confirms D’Espallier, et al (2010) that MFIs which focus on women usually extend smaller loans, which reduces their operational efficiency and subsequently lowers profitability1.
The results also provide strong evidence that credit risk represents a serious obstacle to microfinance profitability as shown by the negative coefficient on PAR while capital adequacy matters for MFI profitability. Rural population share (in 1990) similarly turns out as insignificant perhaps because the bulk of the population in Sub-Sahara Africa is rural with a low population density at 77 people per square kilometre. This is among the lowest in the world (World Bank, 2009). We however find rapidly growing rural areas to be negatively associated with profitability which suggests that microfinance operations may be more difficult in rural areas characterized by weak infrastructure. MFIs that chose to locate in urban settings could therefore be more profitable.
The coefficient on the lagged dependent variable is about 0.2 and significantly greater than zero. This implies that there is some moderate persistence in microfinance profitability. It is plausible that if there is a shock to profitability level in the current year, about 20% of the effect will persist into the following year.
6.3.1 Interaction effects
The study further sought to establish if a combination of MFI specific factors jointly explain MFIs profitability. Although evidence adduced so far in the previous studies shows MFI age may not be relevant on influencing profitability, it could be the case that portfolio-assets (PAsset) ratio depends on MFI age (AG). Young MFIs are less likely to have been licensed to mobilize deposits and therefore may have a higher loans-assets ratio, ceteris paribus. From this perspective, we interact age with portfolio-assets ratio (AGXPAsset) and age with deposits to assets ratio (AGXDEPASE). Moreover, portfolio-assets (PAsset) ratio could also be influenced by the extent of credit risk exposure. We thus interact portfolio-assets ratio with PAR (PAssetXPAR).
MFI age may also affect the debt-equity composition because the weight of external financial sources steadily decreases while equity becomes a more important source of finance, as firms mature. In addition, mature MFIs may have lower debt ratios as they accumulate deposits and/or plough back into business the retained earnings. Towards this end we interact age with debt-equity ratio (AGXGR). There could also be an association between deposit mobilization and gearing ratio. Since deposits are a cheap source of funding, MFIs that mobilize deposits may be able to offset the cost of long term debt with implications on higher profitability. If this is found to non-negligibly predict profitability, then it may be the optima mix of the MFIs capital structure. We therefore interact being licensed to collect public deposits with debt-equity ratio (ACDEPXGR).
MFI age may also affect changes in the PAR rate. Older MFIs are likely to have more information capital through relationship lending which generates valuable information about the borrower’s quality in line with Berger, and Udell (2006) theoretical postulations. Hence, their ability to screen borrowers is likely to be better than that of younger MFIs. The adverse selection problem is likely to be more acute for younger MFIs, at any given average quality of borrowers. We therefore interact age with PAR (AGXPAR). The estimated coefficients is a good measure of the length of time period MFI needs before it accumulates enough information capital to overcome the adverse selection effect. We thus augment the baseline model with interaction terms and report the results in Table 6.
1 Although women entrepreneurs are known to repay loans swifter than men, they also receive smaller loans. Additionally, on average they have smaller-scope business projects and are poorer relative to men.
Table 6: The impact of financing choice on MFI profitability-with interaction effects
Variable Notation Estimation coefficients
Lagged ROA
1
-P
t 0.1169***(4.14)
Deposits to assets ratio DEPASE 0.1288***
(9.49)
Portfolio to assets PAsset 0.0786***
(4.45)
Debt to equity ratio GR 0.0102**
(2.18) Capital CAP 0.1162*** (4.59) Log Age AG -0.0022 (-1.26) Log size S 0.0649*** (4.13) Efficiency EFF -0.2496*** (7.67)
Portfolio at risk PAR -0.1977***
(-4.90) Growth of rural
population
POPGROW -0.0352**
(-2.20) Portfolio-assetX Portfolio at risk PASSETXPAR 0.2282
(0.76)
AgeXPortfolio-asset AGXPASSET 0.0163***
(4.37)
AgeXDeposit-asset ratio AGXDEPASE 0.0023***
(4.05)
AgeXGearing AGXGR 0.0002
(0.52)
AgeXporfolio at risk AGXPAR -0.0102
(-1.61)
Accept depositsXgearing ACEPXGR 0.0041***
(6.43) Number of instruments 60 Wald-test Χ2(16)= 315.0 Prob>chi2=0.000 Sargan-testa Χ2(40)= 37.30 Prob>chi2= 0.6925 AR(1)b Z=-2.30 P-value = 0.0021 AR(2)c Z= 1.29 P-value = 0.7985 Observations 276
This Table presents estimations performed using Blundell and Bond (1998) system robust GMM (Two-step) estimator. For the definition of the variables see Table 3. Robust z values are in parentheses and significance at the 10%, 5%, and 1% level is noted by *, ** and *** respectively.
The Wald test is a test of the null hypothesis that the coefficients in the given equation are all zero (Greene, 2008). A low value indicates null hypothesis rejection.
a Test for over-identifying restrictions in GMM dynamic model estimation. b Arellano-Bond test that average autocovariance in residuals of order 1 is 0 (H0: no autocorrelation).
c Arellano-Bond test that average autocovariance in residuals of order 2 is 0 (H0: no autocorrelation).
While our previous findings are preserved, the results from interacted variables indicate that older MFIs that mobilize deposits are more profitable. This implies that over time, older MFIs have higher deposit to assets which translates to lower cost of capital and higher profitability. We also find that portfolio-assets ratio depends on age of the MFI with an implication on higher profitability. Our hypothesis that the effect of credit risk on MFIs profitability diminishes with the age of the MFI, is not supported here as indicated by the negative and insignificant sign of the interaction of the portfolio at risk with MFI age. The negative and insignificant coefficient on the interaction term AGXPAR indicates that this effect does not rise or decline with the age of the MFI. Our hypothesis that older MFIs may have accumulated sufficient information capital to counteract the negative effect of default rate is not supported here. This is contrary to McIntosh, de Janvry, and Sadoulet (2005) who shows that young MFIs are willing to enter the market where other MFIs are already present to take advantage of the effect of training and screening already conducted on clients by the incumbent lenders.
6.3.2 Robustness
In order to test the robustness of the results, we perform some alternative regressions. We estimate fixed effect regressions as a robustness test for the results with the GMM system method, at least for the sign of the coefficients and report the results in Table 7. A fixed effect model can account for regional, country or MFI differences. Using fixed effect regressions does not fundamentally change the picture. The significance and the direction of influence of the capital structure variables shown in the estimations are preserved.
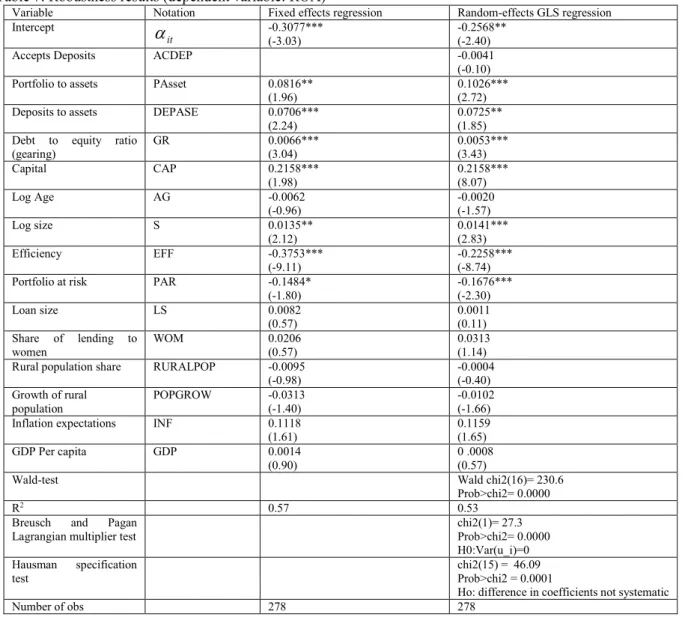
One limitation of using system GMM estimator is that the differencing removes any time invariant explanatory variable which does not allow us to control for the policy choice variable of mobilizing public deposits. Without necessarily controlling for profit persistence, a random effect model seems to be our choice model. A random effect (RE) model may also control for the potential correlation that may exist between regressors and for unobservable individual MFI effects. We therefore re-estimate equation 3.1 in a linear fashion by assuming random effects. While the number of observations is considerably reduced, some of our findings hold. In particular, Table 7 shows that mobilizing deposits dummy variable has no impact on profitability and does not significantly alter our results. Perhaps what matters is the magnitude of the deposits. Larger share of deposits to assets also appears to boost MFI profit, while MFIs with higher loans to assets ratio are more profitable. Better capitalized MFIs are more profitable, while higher gearing translates to greater profitability.
Table 7: Robustness results (dependent variable: ROA)
Variable Notation Fixed effects regression Random-effects GLS regression Intercept it
a
-0.3077*** (-3.03) -0.2568** (-2.40)Accepts Deposits ACDEP -0.0041
(-0.10) Portfolio to assets PAsset 0.0816**
(1.96)
0.1026*** (2.72) Deposits to assets DEPASE 0.0706***
(2.24)
0.0725** (1.85) Debt to equity ratio
(gearing) GR 0.0066*** (3.04) 0.0053*** (3.43) Capital CAP 0.2158*** (1.98) 0.2158*** (8.07) Log Age AG -0.0062 (-0.96) -0.0020 (-1.57) Log size S 0.0135** (2.12) 0.0141*** (2.83) Efficiency EFF -0.3753*** (-9.11) -0.2258*** (-8.74)
Portfolio at risk PAR -0.1484*
(-1.80) -0.1676*** (-2.30) Loan size LS 0.0082 (0.57) 0.0011 (0.11) Share of lending to women WOM 0.0206 (0.57) 0.0313 (1.14) Rural population share RURALPOP -0.0095
(-0.98) -0.0004 (-0.40) Growth of rural population POPGROW -0.0313 (-1.40) -0.0102 (-1.66) Inflation expectations INF 0.1118
(1.61) 0.1159 (1.65) GDP Per capita GDP 0.0014 (0.90) 0 .0008 (0.57)
Wald-test Wald chi2(16)= 230.6
Prob>chi2= 0.0000
R2 0.57 0.53
Breusch and Pagan Lagrangian multiplier test
chi2(1)= 27.3 Prob>chi2= 0.0000 H0:Var(u_i)=0 Hausman specification test chi2(15) = 46.09 Prob>chi2 = 0.0001
Ho: difference in coefficients not systematic
Number of obs 278 278
This Table presents the results from regressions conducted to determine the influence of financing choice on MFI profitability in Africa. t-statistics are in parentheses and significance at the 10%, 5%, and 1% level is noted by *,** and *** respectively. For the notation of the variables see Table 3.
7. Conclusions, policy implications and further research
In the context of Sub-Sahara Africa microfinance industry, this study is pioneering in analyzing the impact of financing choice on microfinance profitability. While most information on the financing choice is highly
fragmented, this study has taken a first empirical step to synthesize the information in order to better understand the link between MFI funding and profitability. We find evidence that financing structure matters.
Although previous empirical evidence on the impact of capital structure on firm performance remains mixed and contestable, microfinance sub-sector appears to have been neglected in this research agenda. This study identifies a series of novel findings. Among the new key findings is that highly leveraged microfinance institutions are more profitable. This study therefore calls for the development of appropriate regulatory policies that enable MFIs to have access to long-term debt to improve on their profitability. This may include relaxation of the listing requirements in the capital market.
Another new finding is that a proportionally higher deposit-to-assets ratio is associated with improved profitability, assuming that the deposits mobilization program is efficient. From this perspective, voluntary deposit mobilization may help MFIs achieve independence from donors and investors, which is particularly important in periods of liquidity constraints. Savings mobilization provides MFIs with inexpensive and sustainable source of funds for lending. This perhaps explains why it is an indispensable element for well-performing MFIs. Deposits may however require widespread branching and other expenses. But for MFIs to mobilize deposits, they require a license which calls for transition to regulation. Whereas MFIs in several Latin American countries have made progress in the transition to regulation and market funding (Jansson, 2003), unregulated and NGO structures still dominate Sub-Sahara Africa. Such MFIs are constrained in financing options, with no license for deposits mobilization and no shareholder structure for attracting equity other than grants.
We also find that higher portfolio-to-assets ratio may translate to more interest revenue and therefore profitability because of the higher risk. Although contrary finding has been documented in the banking literature (see for example García-Herrero, 2009), it is a novel finding in the microfinance industry. Portfolio to assets ratio is however very much influenced by regulation. Moreover, administered lending and deposit rates may result in the misallocation of credit. Since MFIs in Sub-Sahara Africa are capital constrained an optimal combination of long-term debt instruments and deposits would prove worthwhile.
Another interesting finding is that older MFIs that mobilize deposits are more profitable. Older MFIs have higher deposit to assets which translates to lower cost of capital and higher profitability. Portfolio-assets ratio similarly depends on age of the MFI with an implication on higher profitability. These findings have responded to the main aim of this paper appropriately.
This work is a first attempt to study the influence of capital structure on microfinance profitability in Sub-Sahara Africa economies. Future research could address the impact of (i) grants (ii) retained earnings, (iii) share capital, (iv) debt relative to assets and (v) commercial funding liabilities ratio on microfinance profitability. A focus on country-specific studies that may provide country-level policy conclusions would also be relevant. Other issues that could be tackled in future research include the impact of capital structure on MFIs profitability while controlling for contract design and the industrial organization. Additionally, recently available data could be used to clarify important issues that could affect the direction of microfinance. For example the interaction of economies of scope in the provision of deposits and loans and the subsequent influence on profitability are yet to be estimated for various environments.
References
Abor, J. (2005), The effect of capital structure on profitability: an empirical analysis of listed firms in Ghana, The Journal of Risk Finance, 6:438-47.
Abrams, J., and Ivatury, G (2005), The market for foreign investment in microfinance: opportunities and challenges CGAP
Ahlin, C., Lin, J and Maio, M (2011), Where does microfinance flourish? Microfinance institution performance in macroeconomic context, Journal of Development Economics, 95:105-120
Arellano, M and Bond, S. (1991), ‘Some tests of specification for panel data: Monte Carlo evidence and an application to employment equations’. Review of Economic Studies, 58:277-297.
Arellano, M and Bover, O. (1995), Another look at the instrumental variables estimation of error-component models. Journal of Econometrics, 68:29-51.
Armendáriz de Aghion, B. and Morduch, J. (2010), The Economics of Microfinance, Second. Edition. MIT Press, Cambridge, MA.
Arun, T and Hulme, D (2008), Microfinance-A way forward, Brooks World Poverty Research Institute Working Paper No.54, The University of Manchester.
Balkenhol, B (2007), 'Efficiency and sustainability in microfinance in “Microfinance and public policy; outreach performance and efficiency”, ILO, Palgrave Edition, New York.
Bellucci, A., Borisov, A and Zazzaro, A (2010), Does gender matter in bank–firm relationships? Evidence from small business lending, Journal of Banking and Finance, 34:2968-2984
Berger, A., Bonaccorsi di Patti, E., (2006), Capital structure and firm performance: A new approach to testing agency theory and an application to the banking industry, Journal of Banking and Finance, 30:1065-1102
Berger, A.N., Bonime, S.D., Covitz, D.M., Hancock, D., (2000), Why are bank profits so persistent? The roles of product market competition, information opacity and regional macroeconomic shocks. Journal of Banking and Finance, 24:1203–1235
Berger, and Udell (2006), A more complete conceptual framework for SME finance, Journal of Banking and Finance, 30:2945-2966
Bikker, J and Hu, H. (2002), ‘Cyclical patterns in profits, provisioning and lending of banks and pro-cyclicality of the new Basel capital requirements’. BNL Quarterly Review, 221:143-175.
Blundell, R and Bond, S. (1998), ‘Initial conditions and moment restrictions in dynamic panel data models,’
Journal of Econometrics, 87:115-143.
Bogan, V. (2009). Capital structure and sustainability: An empirical study of microfinance institutions, mimeo. Caesar, G. and Holmes, S. (2003), Capital structure and financing of SMEs: Australian evidence”, Journal of
Accounting and Finance, 43:123-147.
Cebenoyan, A. S., and Strahan, P. E. (2004), “Risk management, capital structure and lending at banks.” Journal of Banking and Finance, 28:19-43.
CGAP (2009), Microfinance Investment Vehicles (MIV) survey, market data and peer group analysis, Washington D.C.
Chiang, Y.A., Chang, P.C.A. and Hui, C.M.E. (2002), Capital structure and profitability of the property and construction sectors in Hong Kong, Journal of Property Investment and Finance, 20:34-53
Cole, R.A. and Mehran, H. (1998), “The effect of changes in ownership structure on performance: evidence from the thrift industry”, Journal of Banking and Finance, 21:895-947.
Cull, R., Demirgüc-Kunt, A and Morduch, J. (2007), ‘Financial performance and outreach: a global analysis of leading microbanks’, Economic Journal, 117:F107-F133.
Cull, R., Demirgüç-Kunt, A., Morduch, J. (2009), Banks and microbanks, World Bank Policy Research Working Paper Series No 5078, The World Bank
Cull, R., Demirgüc-Kunt, A., and Morduch, J. (2011), The effect of regulation on MFI profitability and outreach.
World Development, 39:949-965
D’Espallier, B., Guérin, I and Mersland, R (2010), Gender bias in microfinance, World Development, forthcoming D’Espallier, B., Guérin, I and Mersland, R (2011), ‘Women and Repayment in Microfinance’. World Development,
39:758-772
Demirgüc-Kunt, A., Huizinga, H., (1999), Determinants of commercial bank interest margins and profitability: Some international evidence. World Bank Policy Research Working Paper No. 1900
Demirgüc-Kunt, A., Huizinga, H. (2000), ‘Financial structure and bank profitability’. Policy Research Working Paper Series 2430. The World Bank. Washington, DC.
Esperance, J.P., Ana, P.M.G. and Mohamed, A.G. (2003), Corporate debt policy of small firms: an empirical (re)examination, Journal of Small Business and Enterprise Development, 10:62-80.
Faulkender, M., and Petersen, M. A. (2006), “Does the source of capital affect capital structure.” The Review of Financial Studies, 19:45-79.
Fehr, D., and Hishigsuren, G. (2006), Raising capital for microfinance: sources of funding and opportunities for equity financing.” Southern New Hampshire University, Working Paper No. 2004-01
Flamini V., McDonald C.A. and Shumacher L.B. (2009), “The determinants of commercial banks profitability in Sub-Saharan Africa” IMF Working Paper No. 09/15.
Fletschner, D. (2009), Rural women’s access to credit: market imperfections and intrahousehold dynamics, World Development, 37:618-631
Freixas, X (2005), Deconstructing relationship banking, Investigaciones Econ´omicas, 29:3-31.
García-Herrero, A., Gavilá, S., Santabárbara, D (2009), What explains the low profitability of Chinese banks?
Journal of Banking and Finance, 33:2080-2092
Gleason, K. C., L. K Mathur, and I. Mathur, (2000), “The Interrelationship between culture, capital structure, and performance: Evidence from European Retailers”, Journal of Business Research, 50:185-191.
Grossman, S. J., and Hart, O. D (1982), “corporate financial structure and managerial incentives,” In: The Economics of Information and Uncertainty. Ed. by J. J. McCall. Chicago: The University of Chicago Press, 123-155.
Harris, M. and A. Raviv (1990), ‘Capital structure and the informational role of debt’, Journal of Finance, 45:321-49.
Helms, B. (2006), Access for All: Building Inclusive Financial Systems. Washington, D.C.: International Bank for Reconstruction and Development. The Consultative Group to Assist the Poor (CGAP).
Hermes, N., Lensink, R., and Meesters, A. (2011), Outreach and efficiency of microfinance institutions, World Development, 39:938-948
Himmelberg, C.P., Hubbard, R.G. and Palia, D. (1999), Understanding the determinants of managerial ownership and the link between ownership and performance, Journal of Financial Economics, 53:353-84