Developing Non-Parametric Density Estimation on Genetic Evolution Computing
as a Cloud Based Sensor Fusion Method
Taking Psychiatric Major Depressive Disorder Detection as an Application Example
Tsu-Wang Shen, Ph.D., Fang-Chih Liu
Department of Medical Informatics Tzu Chi University
Hualien, Taiwan [email protected]
William Shao-Tsu Chen, M.D.
Department of Psychiatry Tzu Chi General HospitalHualien, Taiwan [email protected] Abstract—Biomedical cloud computing offers on-demand
healthcare services. A sensor fusion method is developed based on non-parametric density estimation on genetic evolution computing. Our method provides a potential solution for decision making on flicking features when not all measurements of sensors appear at the input end. The method was applied on major depressive disorder detection as an application example and it was successfully for MDD classification regardless different combinations of sensor monitoring.
Keywords- Non-Parametric Density Estimation, Genetic Evolution, Cloud Computing, Sensor Fusion, Depressive disorder
I. INTRODUCTION
Cloud computing is defined to use computing resources that are delivered as a service over Internet. Cloud computing entrusts remote services with data storage, information analysis, hardware infrastructure, software applications, and computation [17-18], currently including IaaS (infrastructure as a service), PaaS (platform as a service), SaaS (software as a service), StaaS (storage as a service), and Mega-scale web services. Moreover, after portable devices becomes successfully blooming in the consumer markets, mobile cloud computing turns to be essential. As mobile cloud computing facilitates a wide spectrum of smart applications, the need for fusing various types of data available in the cloud grows rapidly. Some fascinating applications show the enormous possibilities on cloud computing. Undoubtedly, social and sensor data play an important role in such applications, but typically processed separately. Especially, in the biomedical cloud, there is enormous data steaming, including mining genomic data such as DNA sequencing, RNA expression, proteomic data, metabolomics data and small molecule screening, text mining of the biological literature and electronic medical records, and clinical bio-signals / images containing EEG, ECG, X-rays, functional MRI, and scanning microscopes. Hence, the biomedical cloud is currently at an intersection point between genome technology, cloud computing and biological data mining. There are strong needs to build a globally applicable cloud computing platform capable of
supporting a new paradigm of data intensive, cloud-enabled predictive medicine.
II. BIOMEICAL CLOUD COMPUTING
Biomedical cloud computing offers on-demand computational services over the web by major healthcare providers. The cloud opens many new medical opportunities nowadays by increasing the capability of creating predictive models of disease detection, progression and therapeutic response in order to connect phenotypic data to biomarker profiles and therapeutic treatments. Under this infrastructure, a medical device is not only to be considered as physical monitoring machines but also to be evolved into a communication media between a human body and web healthcare services. Moreover, the benefits of sharing information of medical machines among multiple clinics are become possible. For foreseeable future, the biomedical cloud has to become smart enough to unit those information from multiple sources along with heterogeneous, inconsistency data in time scale. Hence, the intelligence of the biomedical cloud will be more essential and it will add extra values on current clouds [17-18]. However, missing data is a critical issue due to different troubles, for example, dysfunction concerning networks of sensors. Many available methods are not able to overcome the issue that affects the prediction and the reliability effectively [8-9]. Fig.1 described the personal information that is generated in the different time. However, a successful SaaS should smart enough to fuse those heterogeneous data to create an integrated service.
Figure 1. A successful cloud servce integates heterogeneous and time-scale inconsistency data into one united service.
III. DETECTION OF MAJOR DEPRESSION DISORDER (MDD) IN THE MEDICAL CLOUD
A. Monitoring on Major Depressive Disorder
Depression is a major public health problem and a leading predictor of functional disability and mortality. The annual economic consequences of depression are huge. Optimal depression treatment improves outcomes for most patients [1]. The diagnostic criteria are defined in the Diagnostic and Statistical Manual of Mental Disorders, 4th ed., Text Revision (DSM-IV-TR) [2]. The lifetime prevalence of major depressive disorder (MDD) was 16.2%, and the 12-month prevalence was 6.6% [3]. However, physicians tend to under-recognize and misdiagnose depression in medical settings [4]. Eliseo et al. (1990) revealed primary care physicians could only recognize 64% of patients with MDD and 29% patients with sub-threshold depression [5].
It is essential to provide an objective measurement on depression. Many kinds of bio-signals are paid a lot of attention lately because it is well known that MDD influences physiological mechanisms significantly. Literally, many kinds of bio-signals, such as electroencephalography (EEG), electromyogram (EMG) and electrocardiogram (ECG), reflect mood and body conditions [6-7].
B. Bring the MDD Detection into the Biomedical Cloud Because cloud technologies of medical sensing are mature and MDD impacted public health so dramatically, monitoring patients’ psychiatric conditions over the cloud become much more realizability. To reach the goal of correctly measurement, it is essential to select the appropriate artificial intelligence method to fuse heterogeneous data. However, it becomes challenging to design a biomedical AI service to overcome such inconsistency or to eliminate possible one or multiple measurement absences. However, the fusion of heterogeneous features is still an open question, especially with flicking features in medical cloud different from persons or physiological conditions, because contradictory classification features may exist [8-9]. It is critical to fuse multiple physiological heterogeneous features that are extracted from different bio-signal sources in order to provide more accurate computer-aided diagnoses and avoid possible flicking feature interference caused by individual differences and measurement noise.
To eliminate flicking feature interference, a medical fusion system in cloud should be able to deal with the following five scenarios: (i) multiple observation sources; (ii) multiple diagnostic systems; (iii) multiple users on the same system; (iv) multiple accesses; (v) multiple representations of the same feature [10]. The five scenarios potentially indicate that a metric-based approach may have solutions for the fusion of heterogeneous and flicking features. The goal of our proposed method is try to design a SaaS to identify the
most essential features for a wide range of pattern recognition classifiers without projecting features into other domains, even when the biomarkers may appear indistinctly (flicking).
IV. METHODOLOGY
Basically, our system structure follows the fusion principles of the Joint Directors of Laboratories (JDL) to fuse the information from multiple sensors, which indicates the levels of the data fusion process through source preprocessing, object refinement (feature selection), situation refinement (QDM-ranking), impact assessment (non-parametric density estimation for decision making), process refinement (performance measurement) and cognitive refinement (optional).
Figure 2. The system structure for heterogeneous feature fusion from different devices.
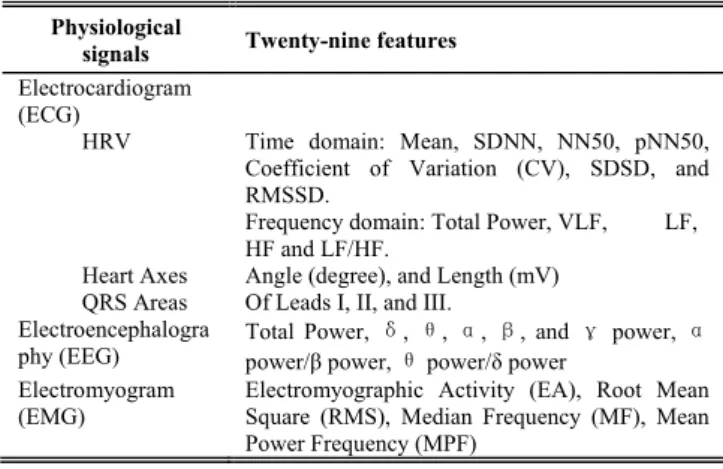
The goal of applying multiple features is to eliminate the bias of a single feature or single category feature to describe a certain disease. As in a physician's diagnosis, a disease should be observed objectively from different aspects. The 29 features (in Table I) contain time domain and frequency analysis of HRV, ECG heart axis, QRS areas, frequency-related EEG features, and EMG features for evaluating muscle force and fatigue.
TABLE I. BIO-SIGNAL FEATURES FOR MDD CLASSIFICATION
Physiological
signals Twenty-nine features Electrocardiogram
(ECG)
HRV Time domain: Mean, SDNN, NN50, pNN50, Coefficient of Variation (CV), SDSD, and RMSSD.
Frequency domain: Total Power, VLF, LF, HF and LF/HF.
Heart Axes Angle (degree), and Length (mV) QRS Areas Of Leads I, II, and III.
Electroencephalogra
phy (EEG) Total Power, power/β power, δθ, θ power/, α, δβ power , and γ power, α Electromyogram
(EMG) Electromyographic Activity (EA), Root Mean Square (RMS), Median Frequency (MF), Mean Power Frequency (MPF)
A. Experiment setup and data acquisition
This study was carried out according to Tzu Chi Hospital IRB097-29 regulations. We invited patients who were diagnosed with MDD (ICD-9: 296.2, 296.3) at the Department of Psychiatry, Tzu Chi General Hospital, Hualien, Taiwan to participate. We collected data from MDD and healthy control groups (45 people each, including 19 males and 26 females) matched for gender and age (MDD: 41.96±11.73 years; Control: 42.42±11.63 years). Their ages ranged from 18 to 65 years. The MDD and control groups are identified by the Hamilton Depression Rating Scale (HAMD-17), the Beck Depression Inventory (BDI), and the Beck Anxiety Inventory (BAI) scales. Finally, the 90 subjects were separated into two gender-age matched groups as training and testing datasets, with 30 and 60 subjects, respectively. All data were collected in the morning, from 9:00 am~12:00 pm, to fix the possible biorhythm factors. The lead I and II ECG, front head EEG, and splenius capitis muscle EMG were sampled at 500Hz using MP35 (BioPack Inc.) acquisition units. These bio-signals were recorded for 2 minutes at rest and about 22 minutes during the Test of Variables of Attention (T.O.V.A.™) [11]. The TOVA is an important tool for the evaluation of attention.
B. Cloud Sensor Fusion Method
The kernel of our fusion system is based on three major techniques, including quartile discriminant measure theory, genetic evolution computing and non-parametric density estimation, which will be addressed separately as follows.
1) Quartile discriminant measure (QDM) theory
Sammon [12] provided an algorithm to rank the discriminatory qualities of all features, the so-called parametric overlap measure. However, Sammon’s discriminant measure is that the global summation can be misleading in some cases, according to practical experience. A QDM method has been developed to offer an equation to quantize the distances within clusters and between clusters at feature-based points of view. It measures the distances and overlapping areas among features, which provides one of the qualities of desirable features, i.e., a larger QDM score means less overlapping and it is more distinguishable based on norm distance.
For any feature P, the mean values (
i,
j) and variance values (
i,
j) of any two classes can provide us the information needed for discriminant measurement. The formula is defined as follows:) 2 / ) ( ( )) _ ( ( ) _ ( 2 2 1 , 4 1 1 , 4 1 j i j i N j ij i ij N j ij i QDM Quartile p feature q Quartile p feature q (1) In Eq. (1), the ratio qij(feature_P) of the mean distance and square root of the average variance can show how to distinguish between class i and class j. The bigger
qij(feature_P) can indicate the easier approach for
separating class i and class j by using classifiers. For a total of N classes, there are
N
(
N
1) / 2
possible combinations ofqij(feature_P) available for a single feature p. All
qij(feature_P) are then sorted. Then if the number
N(N1) / 2 is less or equal to 4, a median number is selected is to avoid a small number group bias. If
N
(
N
1) / 2
is larger than 4, theQuartile
1/4number is selected. In a sorted (from small to large) number set,Quartile
1/4 is the lowerone-fourth of a distribution.
This approach can successfully avoid some misleading analysis. For most classification and fusion applications, the
Quartile
1/4 operator potentially implies a higher chance of a75% classification performance for each feature, which is a relatively desirable choice for AI ranking, unlike the minimum or maximum operator, which is strongly influenced by the worst and best scenarios, which may be biased. In addition, the worst and best cases are not the major problems for classification. By comparison, the ambiguous overlapping areas of features are the most challenging in pattern classification. Hence, the
Quartile
1/4 operator is used to measure the overall 75% distinguished level, instead of the others.2) Genetic Evolution Computing Applied on Multisensor Fusion
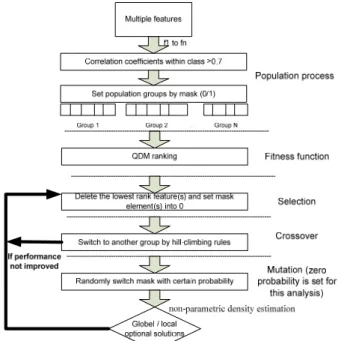
The genetic algorithm (GA) is an evolutionary algorithm inspired by biological evolution and is widely used for optimization and search problems. A traditional genetic algorithm generally involves five stages, including population, fitness function (ranking), selection, crossover and mutation. To apply the GA technologies on cloud computing, a parallel fusion system was developed in figure 3. A designed digital mask is built in the population process to turn on and off the information from different sensors. Practically, a set of n binary masks maps a set of n features for further GA operations. Each mask contains zero or one which means a present or a non-present of the feature values into classify process. After masking, our correlation-based system driven by pre-knowledge of QDM provides fitness scores to approach the optimal solution quickly.
For details, the matrix of correlation coefficients between features is computed to separate features into different populations {[group1],[group2],...[groupN]} . The fitness function combines correlation and QDM ranks to determine the priority of the features. The higher QDM rank in each correlation group is selected by a binary mask {[w1], [w2],
[w3], … [wn]}, where each element wi = 0 or 1. The elements
of masks are inhibited or exhibited by following selection, crossover and mutation (optional) operations. Selection deletes the lowest ranking features; crossover switches population groups for the next elimination; and mutation stochastically changes a single mask component to provide a probability for escaping the local optimal. The best combination for each evolution is kept by the hill-climbing method. Finally, when the performance converges, the
algorithm fuses features to achieve a local optimal solution with a lower time complexity. Unlike traditional GA, for fast processing, the number of eliminated features caused from noise and/or non-present sensors can increase the speed of convergence.
Figure 3. System structure of correlation-based quartile discriminant ranking in the genetic algorithm.
3) Non-parametric density estimation - Parzen window density (PWD)
For decision making on the expert system, Parzen window density (PWD) of non-parametric density estimation play an important rule to fusion the presented features. It measures the overall probability density distribution of all presented features. Eq. (3) is described as follows,
n j j t j d d h x x C x x nh X P 1 1 2 1/2 2 / 2 ( ) ( ) 1 exp C ) 2 ( 1 1 ) ( (3)where n is the number of samples, C is the covariance matrix from n samples, d is the dimension of features, and h is the window size of resolution with h = n-1/d. Finally, the
threshold L is defined as ratio of the probability of
x
dgiven c0 and c1, which is shown in eq. (4),) | ( ) | ( 1 0 c x P c x P L d d (4)
where
x
d is the feature vector. c0 and c1 represent class 1(MDD) and class 2 (controls), respectively. It has to be note that the training process of method is not required.
The advantage of this algorithm is its ability to dynamically change the candidate features based on current inputs from biomedical cloud. For examples, the best
distinguishable features differ from the resting condition to the attention condition for MDD patients. When non-presented data happens, the system would dynamically change to the next optimal decision based on all current inputs.
V. RESULTS
A total 29 features from multiple sensors were extracted from age-gender matched groups with 45 persons each. To evaluate the fusion system, the results are addressed in two aspects, different classifier evaluation and performance comparison on single source and multiple sources.
The QDM-GA approach allows some disappeared features in the biomedical cloud, especially low QDM ranked and non-presented features, and the fusion system stays on a next local optimal solution without retraining the system. Because the system is based on the heuristic knowledge from QDM ranking, only new thresholds
) | ( / ) | (x c0 Px c1 P L d d
need to be recalculates based on clinical pre-knowledge of new combinations of features.
For comparison, an artificial neural network (ANN), which is a division of artificial intelligence, is often applied for soft sensor fusion. In most cases, the ANN mathematical model is an adaptive, learning system that changes the network weights to reach the optimal solution based on external or internal information during the training phase. The solution is also mathematically proofed to achieve minimum decision error in the mean square sense (MSE). For performance evaluation, the QDM-GA is compared with some standard ANNs including (1) back propagation neural network (BPNN), (2) k-nearest neighborhood, and (3) support vector machines (SVM).
Briefly, BPNN is a supervised neural network BPNN is a well-known artificial neural network. BPNN includes three layers: the input layer, hidden layer, and output layer. The error between output and desired signal is fed back to adjust weights to achieve the minimum optimal solution. The sigmoid and pure-linear function was used as an input-to-hidden and hidden-to-output activation function. In this study, the BPNN structure is determined by trial and error with layout N-5-2, meaning that the template length is N with 5 neurons in the hidden layer and 2 neurons in the output layer. The BPNN ran at 10000 epochs for 30 times, the step size was 0.01, and the error for termination was set 0.001.
The k-nearest neighbors algorithm (k-NN) is a method for classifying objects based on closest training examples in the feature space. An object is classified by the distance relationship of its neighbors, with the object being assigned to the class most common amongst its k nearest neighbors. In this study, k = 2, then the object is simply assigned to the class of its two nearest neighbors.
The SVM is related supervised learning methods that analyze data and recognize patterns. The SVM algorithm is based on the structural risk minimization principle of statistical learning theory. The algorithm seeks for a
separating hyperplane to classify groups with corresponding binary labels di{1,1} with a maximal margin and a
minimal error. The optimal separating hyperplane is created by support vectors. The positive and negative samples train a classifier to map the input samples on to another space by using a kernel function. The decision function is given as
m i i i i b x x K d x f 1 ) , ( sgn ) ( (5)whereK(x,xi)is the kernel function, and the dual problem
provides the solution of Lagrange multiplier problem is at a saddle point parameters are determined by maximizing
) , ( 2 1 ) ( 1 1 1 j
d
id
jx
ix
j N i N j i N i i K Q
under the conditions
0 1
d
i Ni
i and 0iCfor i=1,2, …N. The variable Cserves as the regularization parameter that controls the tradeoff between margin and classification error. The SVM model was implemented using the LIBSVM package by Chang and Lin [13]. For this study, radio basis function is chosen as the kernel.
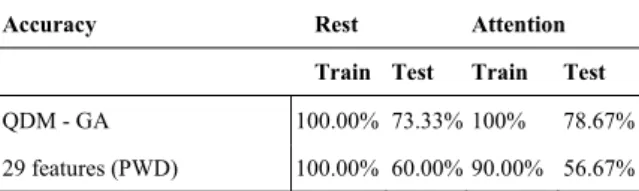
Table II listed the comparison results of different classifiers; the QDM-GA is able to perform the competitive results to other ANN methods with the same amounts of heterogeneous inputs. The results indicated that SVM has the best overall accuracy and our proposed QDM-GA has the better accuracy than BPNN and k-NN classifiers. However, the QDM-GA is capable to search the high performance combinations of features automatically without retraining to adapt weights of ANNs. For instance, it is well known that MDD patients have less regulation ability on autonomic nervous system (ANS). Henceforth, the HRV feature patterns are relatively different during rest and attention conditions [19]. The QDM-GA provides a possible solution to overcome those flicking features and it is suitable to be applied in the cloud services. The same signal features from the same individuals can perform differently on both resting and attention stages, so features are observed as flicking. Hence, our algorithm not only provides better accuracy performances on classification at this kind of situation but also identifies relatively good features for two mental statuses. Table III indicates our proposed method which keeps the same performance of the accuracy to compare with the pure PWD method, even values of features shift caused from mental stage changes.
VI. DISCUSSION
Statistical significant on features does not guarantee for high classification rate according to our dataset. Only four out of 12 QDM selected features are statistically significant. The reason is that significant features may not be unique or essential enough for increasing classification rate. However,
we found that solo ECG and EMG features did not provide the better classification rate than QDM selected features. TABLE II. ACCURACY COMPARISON ON BOTH TRAINING AND TESTING DATASETS BY USING DIFFERENT METHODS
Accuracy Rest Attention Train/pre- modeling Test Train/pre- modeling Test QDM-GA 100.00% 73.33% 100% 78.67% BP 99.56% 63.33% 99.89% 76.67% k-NN2 100 % 66.67% 100 % 50.00% SVM 100% 76.89% 100% 84.89%
TABLE III. ACCURACY, SENSITIVITY, AND SPECIFICITY COMPARISON FOR BOTH RESTING AND ATTENTION CONDITIONS
Accuracy Rest Attention
Train Test Train Test
QDM - GA 100.00% 73.33% 100% 78.67% 29 features (PWD) 100.00% 60.00% 90.00% 56.67%
VII. CONCLUSION
Summary, heterogeneous features were successfully fused for MDD classification based on a QDM-ranked GA by using a correlation matrix and QDM. That shows a potential example of cloud computing with multiple sensor applications. Our proposed method worked successfully to increase system performance, even with bad measurements, highly correlated features, high dimensionality, and/or flicking features, based on the changes in the physiological situation.
In cloud applications, it is common to deal with very large number of classes, such as biometric identification and medical problem solving. Neither a database with a fixed number of samples of each class nor a feature space transformation is required to implement the QDM-GA method. It is hoped that the proposed methods may provide a new thinking in the artificial intelligence, biomedical cloud computing, remote sensing and signal processing fields.
ACKNOWLEDGMENT
This work was supported by the Taiwan National Science Council under Grant 102-2221-E-320-004-.
REFERENCES
[1] J.M. Donohue, and H.A. Pincus, "Reducing the societal burden of depression: a review of economic costs, quality of care and effects of treatment", Pharmacoeconomics, vol. 25, p.p.7, 2007.
[2] American Psychiatric Association, "Diagnostic and statistical manual of mental disorders", American Psychiatric Association, Washington, DC, 2000.
[3] R.C. Kessler, P. Berglund, O. Demler, R. Jin, D. Koretz, K.R. Merikangas, A.J. Rush, E.E. Walters, P.S. Wang, "National Comorbidity Survey Replication, The epidemiology of major depressive disorder: results from the National Comorbidity Survey Replication (NCS-R)", JAMA, vol.289, p.p.3095-3105, 2003.
[4] G.E. Simon, M. VonKorff, "Recognition and management of depression in primary care", Arch Fam Med, vol.4, p.p.99-105, 1995.
[5] E.J. Perez-Stable, J. Miranda, R.F. Munoz, Y.W. Ying, "Depression in medical outpatients", Underrecognition and misdiagnosis, Arch Intern Med., vol.150, p.p.1083-1088, 1990.
[6] A. Hänsel and R. von Känel, "The ventro-medial prefrontal cortex: a major link between the autonomic nervous system, regulation of emotion, and stress reactivity?", BioPsychoSocial Medicine, vol.2, p.p.1-5, 2008.
[7] A.C. Nugent, E.E. Bain, J.J. Sollers, J.F. Thayer, W.C. Drevets, "Alterations in neural correlates of autonomic control in females with and without major depressive disorder", International Journal of Psychophysiology, vol.69, p.p.194, 2008.
[8] A. Lay-Ekuakille, G. Vendramin, A. Trotta, Predicting VOC Concentration Measurements: Cognitive Approach for Sensor Networks, IEEE Sensors Journal, vol.11, issue 11, pp.3923-3030, 2011.
[9] A. Lay-Ekuakille, G. Vendramin, A. Trotta, Spirometric Measurement Post-Processing: Expiration Data Recovery, IEEE Sensor Journal, Vol.10, n.1, pp.25-33, 2010
[10] S. Prabhakar and A.K. Jain, "Decision-level fusion in fingerprint verification", Pattern Recognition, vol.35, p.p.861-874, 2002.
[11] L.M. Greenberg and I.D. Waldman, "Developmental normative data on the test of variables of attention (T.O.V.A.)", J Child Psychol Psychiatry, vol.34, p.p.1019-1030, 1993.
[12] J.W. Sammon, "Interactive pattern analysis and classification", Computers, IEEE Transactions on, C-19, p.p.594-616, 1970.
[13] C. Chang, C. Lin, "LIBSVM: a library for support vector machines", LIBSVM, 2009.
[14] A. Khoshnaw, S. Zein-Sabatto, and M. Malkani, "Cross Layers Decision Making and Fusion Model in Layered Sensing Systems," in Multisensor, Multisource Information Fusion: Architectures, Algorithms, and Applications 2012. vol. 8407, J. J. Braun, Ed., ed, 2012.
[15] B. Patnaik, J. D. Mohod, and S. P. Duttagupta, "Distributed multi-sensor network for real time monitoring of illumination states for a reconfigurable solar photovoltaic array," Proceedings of the 2012 1st International Symposium on Physics and Technology of Sensors (ISPTS), pp. 106-9, 01 01 2012.
[16] R. S. Rand and T. S. Khuon, "Spectral and Spatial Algorithm Architecture for Classification of Hyperspectral and LIDAR," in Multisensor, Multisource Information Fusion: Architectures, Algorithms, and Applications 2012. vol. 8407, J. J. Braun, Ed., ed, 2012.
[17] S. R. Yerva, J. Hoyoung, and K. Aberer, "Cloud based social and sensor data fusion," 2012 15th International Conference on Information Fusion (FUSION 2012), pp. 2494-501, 01 01 2012.
[18] S. Zein-Sabatto, M. Mikhail, M. Bodruzzaman, M. DeSimio, M. Derriso, and A. Behbahani, "Analysis of Decision Fusion Algorithms in Handling Uncertainties For Integrated Health Monitoring Systems," in Multisensor, Multisource Information Fusion: Architectures, Algorithms, and Applications 2012. vol. 8407, J. J. Braun, Ed., ed, 2012. [19] Tsu-Wang Shen, Fang-Chih Liu, Shaw-Ji Chen, and
Shao-Tsu Chen, " Changes in heart rate variability during TOVA testing in patients with major depressive disorder", Psychiatry and Clinical Neurosciences, vol. 67, 35–40, 2013