Economic Growth Centre
Working Paper Series
Profiles, Use, and Perceptions of Singapore
Multiple Credit Cardholders
by
Lydia L. GAN
Ramin C. MAYSAMI
Hian Chye KOH
Economic Growth Centre
Division of Economics
School of Humanities and Social Sciences
Nanyang Technological University
Nanyang Avenue
SINGAPORE 639798
Website:
http://www.hss.ntu.edu.sg/egc/
Website:
http://www.hss.ntu.edu.sg/egc/
The author bears sole responsibility for this paper. Views expressed in this
paper are those of the author(s) and not necessarily those of the Economic
Growth Centre.
Profiles, Use, and Perceptions of Singapore Multiple Credit Cardholders
Lydia L. Gan*
Division of Economics, School of Humanities and Social Sciences, Nanyang Technological University, Singapore
Ramin C. Maysami
School of Business Administration
University of North Carolina at Pembroke, North Carolina, USA, and
Hian Chye Koh
Division of Marketing & International Business,
Nanyang Business School, Nanyang Technological University, Singapore
Abstract
This study analyzes Singapore’s diverse cardholders in search of variations among demographic groups, credit card profiles, and their perceptions with regards to credit card ownership and use, it then discusses possible reasons governing Singaporeans’ credit card ownership and use. A survey was conducted (n = 636), decision trees were then constructed using Chi-square automatic interaction detection algorithm (CHAID) and SPSS software AnswerTree to examine the association between the number of credit cards (target variable) and the demographic characteristics, perceptions and other credit card related variables. The number of credit cards was found to be significantly influenced by income and gender as well as perceptions that include “credit card leads to overspending”, “savings as payment source”, “unreasonable interest rates”, “credit card as status symbol”. The number of credit cards was also affected by credit card related variables such as missing payments sometimes, frequency of use, entertainment expenditures, and petrol purchase. This research provides an in-depth understanding of Singaporean multiple cardholders, thus it is useful in designing marketing strategies for card-issuers as well as anti-debt strategies for policy-makers in Singapore. Despite the importance of consumer credit, virtually no literature or research exists on the ownership and use of credit cards in Singapore, so this paper intends to close this gap. Further, by combining the demographics, cardholders’ profiles and usage patterns with the respondents’ perceptions concerning credit card ownership and use, our study offers a richer analysis to explain consumer behavior than previous literatures.
Keywords: Credit card ownership, credit card use, credit revolving, credit debts, decision tree, Singapore.
JEL Classification: G28
__________________________________________
*Assistant Professor, Division of Economics, School of Humanities and Social Sciences, Nanyang Technological University, Singapore 639798. Phone: +65-6790-5676, Fax: +65-6792-4217. Email:
Introduction
Asia is still an untapped market as far as the credit card industry is concerned. Lafferty Financial Consultancy Group, for example, estimated that in 2000, consumers in Australia, Hong Kong, India, Japan, Korea, Singapore and Taiwan had disposable incomes totaling S$4.46 trillion, slightly less than Europe’s S$5.01 trillion. However, only 7.3 percent of the Asian sum was spent through credit cards compared to 35 percent of the corresponding figure in the United States. The liberalization of the financial sectors in Asia, has resulted in the rapid proliferation of credit card companies and financial companies providing other types of consumer credit. This, coupled with the entry of foreign banks under qualifying full bank (QFB) licenses has greatly increased the number of credit cards available, and hence such spending in Singapore. Despite intermittent periods of rising unemployment and pay cuts, approximately 4.2 million main and supplementary cards were in use as of September of 2005 (Monetary Authority of Singapore, 2005), an increase of 78 percent from the same period in year 2000! According to the Credit Bureau of Singapore (CBS), the primary credit cardholder on average holds 3 credit cards and 60 percent of them own cards issued by more than one bank (The Straits Times, 2004a). According to other statistics, the average household in Singapore owned 3.4 credit cards, compared to 4 per household in Hong Kong and at least 5 credit cards per household in Taiwan (Visa International, 2004a, 2004b, 2004c).
According to statistics from the Monetary Authority of Singapore (2005), the total annual credit card billings in Singapore grew drastically to S$14 billion in 2004, a rise of 13 percent from 2003. This was equivalent to 18 percent of household consumption and 8 percent of total GDP in Singapore in 2004 (Singapore Department of Statistics, 2005). The rollover balance for credit and charge cards in Singapore stood at S$2.7 billion in September of 2005 (Monetary Authority of Singapore, 2005), with approximately 40
percent of cardholders rolled over their credit card balances in March of 2005, compared to a peak of 44 percent in September of 2004 (The Straits Times, 2005d) -- hence creating a healthy source of profits for credit card issuing companies and banks.
A more recent study conducted by Lafferty Group (2004) found that despite being the smallest consumer credit market in Asia, Singapore has one of the highest levels of consumer debt per person in the world. The debt of the average Singaporean was estimated to be 122 percent of his personal disposable income, a rise of 2 percent from 2003. Credit spending, and credit cards in particular, have been singled out as the tool that fueled indiscriminate spending. Recent data from the MAS showed that banks in Singapore wrote off as much as S$196 million in credit card debt in 2004. Although this only translated into approximately 1.5 percent of total credit card billings that year, it represented a rise of 43 percent over the previous year and was seven times higher than a decade ago. Singapore cardholders ran up a median debt of S$1,022 on their credit card accounts while the average monthly balance was approximately S$3,800 in June of 2004 (The Straits Times, 2004a). While this may not seem like much, recent data from the Credit Bureau of Singapore revealed the presence of credit card big spenders – in March 2005 alone, 25,000 cardholders charged at least S$10,000 on their cards, and among them 4,000 charged at least S$20,000 (The Straits Times, 2005d).
Overspending on credit, which attracts as high as 24 percent of the annual interest rate, is the primary cause of bankruptcies in Singapore (The Straits Times, 2005e). Between 2001 and the third quarter of 2005, Singapore had more than 22,765 un-discharged bankruptcy cases, with 2,562 people filing bankruptcies since the beginning of 2005, according to data from the Insolvency and Public Trustee’s Office (Ministry of Law, 2005). Since its inception in August 2003, Credit Counseling of Singapore had counseled 940 financially distressed consumers (The Straits Times, 2005a). As Singapore’s
financial markets have traditionally been heavily regulated, and since the population has been customarily frugal in its credit spending, what started as a convenient means of spending could inadvertently be used as a source of unsecured credit leading to additional and unexpected risk in the financial markets. Of course the additional concerns regarding the social effect of a credit-ridden society cannot be underestimated nor overlooked.
This study analyzes Singapore’s diverse cardholders in search of variations among demographic groups, cardholders’ profiles, and their perceptions with regards to credit card ownership and use. The paper then discusses possible reasons governing Singaporeans’ credit card ownership and use as well as practical implications for card-issuers and policy makers. In spite of the significance of consumer credit, little if any literature or research is available about credit card ownership and use in Singapore. Thus, this study is intended to fill this void by identifying and quantifying the demographics, profiles and usage patterns of cardholders and their perceptions regarding credit card ownership and use.
Literature Review
Soman and Cheema (2002) found that consumers regarded the size of their credit limits as a signal of their future income and hence, were more likely to spend up to the maximum credit limit. Lunt (1992) found that a generous credit limit, quality customer service, fair credit card fees, and interest rates were the factors that count at the point of sale. Gross and Souleles (2002) observed that an increase in credit limits generates an immediate and significant rise in debt. Liquidity constraints would disproportionately affect young and low-income people, and people with low credit scores. Paquin and Squire-Weiss (1998) showed that the personal bankruptcy rate can be explained by the supply of consumer credit, interest rates, the capacities of cardholders to service their debts, and the conditions of the job market. Another study revealed a general consensus that the
consumers’ lack of understanding about the use of credit is a problem in the credit markets (Lee and Hogarthe, 1999). Mandatory disclosure of information such as interest rates may not necessarily assist consumers at arriving at better credit decisions; but rather an increase in consumer understanding in the use of credit can lower the related debts (Warwick and Mansfield, 2000). It is noteworthy that a number of studies have found that credit card defaults and personal bankruptcies were closely related to the rise in the household debt burden (Ausubel, 1997, Kowalewski, 1997, Morgan and Toll, 1997).
Studies that focus on the relationship between credit card use or selection, and attitudinal, demographic and socio-economic characteristics include those of Slocum and Matthews (1969, 1970), who discovered that social class affects consumer attitudes towards credit card usage within certain income categories. Research by Gan et al. (2006), Kinsey (1981), Barker and Sekerkaya (1992), Wasburg et al. (1992), Heck (1987), Arora (1987), Mandell (1972) also found a high income to be an important determinant for increasing the number of credit card accounts as well as increased credit card usage. However, Choi and DeVaney (1995) found income level to be insignificant in determining the use of credit cards while Danes and Hira (1990) showed that middle-income families actually used credit cards more than families of higher income.
Where gender is concerned, Kinsey (1981), and Slocum and Matthews (1970) found gender and marital status to be significant determinants of credit card usage. White (1975), and Adcock et al. (1977), suggested that single males were more likely to use credit cards than females. Contradicting this, both Kinsey (1981) and Arora (1987) found females used their credit cards more frequently, while Armstrong and Craven (1993) found that females tended to have a higher average number of credit cards than males. Ingram and Pugh (1981) concluded that the least number of credit cards were owned by single member households, young married couples, retirees, and sole survivors.
Over the past three decades, there has been a significant increase in the holding and use of general-purpose credit cards with a revolving feature as well as a provision for balances outstanding. Zhu and Meeks (1994) analyzed consumer credit use in low-income families and discovered that age and employment status were significant determinants of the amount of credit outstanding. Younger households and those employed full-time were found to have higher outstanding credit balances as compared to the elderly or the unemployed. A number of studies identified that credit card users tended to overspend relative to those who use cash or checks (Soman, 2001; Feinberg, 1986; Hirschman, 1979). Feinberg (1986), especially concluded that credit cards facilitate spending in terms of itsmotivation, probability, and amount spent.
Literature on the use of credit cards for convenience and protection purposes vs. uses for economic and promotional reasons can be found as early as Slocum and Matthews, (1969), who found that people in the lower socio-economic classes used their credit cards more for installment financing while people in the higher socio-economic groups used credit cards for convenience. Supporting this and going further, Canner and Cyrnak (1986) showed that the major reason for credit card use was convenience, and this factor was positively correlated with income, age, and relative financial liquidity. In contrast, a liberal attitude toward borrowing is related to the use of revolving credit (Canner and Cyrnak, 1986). Kinsey (1981) found that the ease of payment and the risk of carrying cash were major reasons for using a credit card. Kaynak and Harcar (2001) attributed consumers’ perceptions of the ease of credit card use to the evolution of it. Social acceptability and easy access to cash were also seen as push factors for the use of credit cards.
In addition, high income earners emerged among other demographic segments, as more receptive to convenience than credit features (Barker and Sekerkaya, 1992). Kaynak et al. (1995) revealed that consumers with lower and middle incomes are likely to value
credit features more than the service features, such as safety and convenience. This is further supported by Chan (1997) who found that economic factors such as “a long interest-free repayment period” and “a low annual fee” were most important for consumers in Hong Kong when deciding whether to use credit cards. Further, Gan et al. (2006) found that a low interest rate and the absence of an annual fee were the two most valued economic factors in determining credit card selection in Singapore.
Durkin (2000) observed that cardholders favored not only the convenience of open-ended credit lines associated with cards, but they also used credit cards as a source of revolving credit. Lee and Hogarthe (2000) distinguished between card users for convenience and those distinguished as credit revolving cardholders. They observed that convenience users utilized credit cards as a mode of payment and typically paid their balances in full, but revolvers used their card as a mode of financing, and chose to pay the interest charges on the unpaid balance. At least one study (Moschis, 1990) has shown that the convenience users were more likely to be high-income, older adults, who were more inclined to pay their credit card balances in full. Lee and Hogarthe (2000) further concluded that convenience users preferred to have a card with no annual fee and other enhancements, such as frequent flyer miles, than a low interest rate, which the majority of revolvers would prefer most.
Methodology
The purpose of this study is to examine demographic groups, cardholder’s profiles, and usage patterns, and their relationships to card owners’ perceptions of credit card ownership and use. In addition to asking the questions used to identify the respondents’ demographic profiles and credit card usage patterns, the main part of the questionnaire sought to examine the cardholders’ perceptions of credit card ownership in the forms of
statements. These 13 statements were developed according to the credit card trends at the point of the study in Singapore (see Table I), and they were anchored on a Likert-type scale ranging from (1) strongly disagree to (5) strongly agree.
<take in Table I>
Data collection
A survey of consumer perceptions of credit card ownership and use was conducted in November, 2002, and the data was collected from a sample of 636 cardholders from the city business centre as well as the western, eastern, and northern parts of Singapore. Fieldwork was conducted in the form of street-intercept interviews at high human traffic locations. Respondents had to own at least one credit card issued in Singapore. Questionnaires were distributed to these individuals who then completed them on site. Six trained interviewers were engaged in the selection process at each location.
Descriptive Data
Table II presents the demographic composition and credit card usage profile of the survey sample expressed in terms of frequency of response and percentage for each category. Nearly 48 percent of the cardholders are degree holders and 58 percent belong to professional occupations. The sample was comprised of 56 percent male respondents and 44 percent were females, with the majority (39 percent) in the lowest income range (below S$39,999 per annum). The largest responding age group was 26 to 35 years of age (45 percent), followed by 36 to 45 year-olds (31 percent), somewhat in line with national demographic data. The ethnic Chinese and Malay respondents accounted for 83 percent of the total sample, nearly identical to the national statistics on the ethnic composition of the Singaporean population. The majority of our respondents (65 percent) owned 1-2 credit
cards and VISA accounted for 42 percent of the total credit cards owned. 46 percent used their cards at least once a week while 54 percent used them less frequently than one time per week. Further, 70 percent of the respondents paid their monthly credit card bill in full whereas 23 percent of them missed their monthly payment at least once. Payment sources come mainly from salaries (75 percent), followed by savings (18 percent). During the previous year, 29 percent had procured a new credit card account and only 7 percent had transferred their balance to another credit card account.
<take in Table II>
Results and discussion
In analyzing the data, two decision trees are constructed (i.e., the recursive partitioning algorithm is applied). For both decision trees, the target variable is the number of credit cards held by cardholders. The first decision tree examines the association between the number of credit cards and the demographic characteristics, card owners’ perceptions and other credit card related variables of the cardholders. In particular, the input variables are:
(1) Demographic characteristics such as gender, ethnic group, age group, educational level, marital status, occupation and annual income.
(2) Perceptions related to interest rates, annual fees, any related status symbol, overspending, purchase funding, loyalty/rewards program and purchase protection.
(3) Other variables relating to the credit card such as typical monthly payments, missed payments, balance transfers and income sources for payment.
The second decision tree looks at the association between the number of credit cards and the frequency of card usage as well as the use of credit cards for petrol, restaurant
expenses, cash advances, groceries, clothing and shoes, books and magazines, insurance, car installments, furniture and appliances, medical and dental charges, internet shopping, computer hardware/software, utilities, entertainment, travel and other costs.
The Chi-square automatic interaction detection algorithm (CHAID) and SPSS software AnswerTree are used to construct the two decision trees. Decision trees are useful techniques for analyzing the data because they can handle non-linear and interaction effects well. The results can also be represented visually and hence are easier to understand and interpret.
Decision tree results Decision tree 1
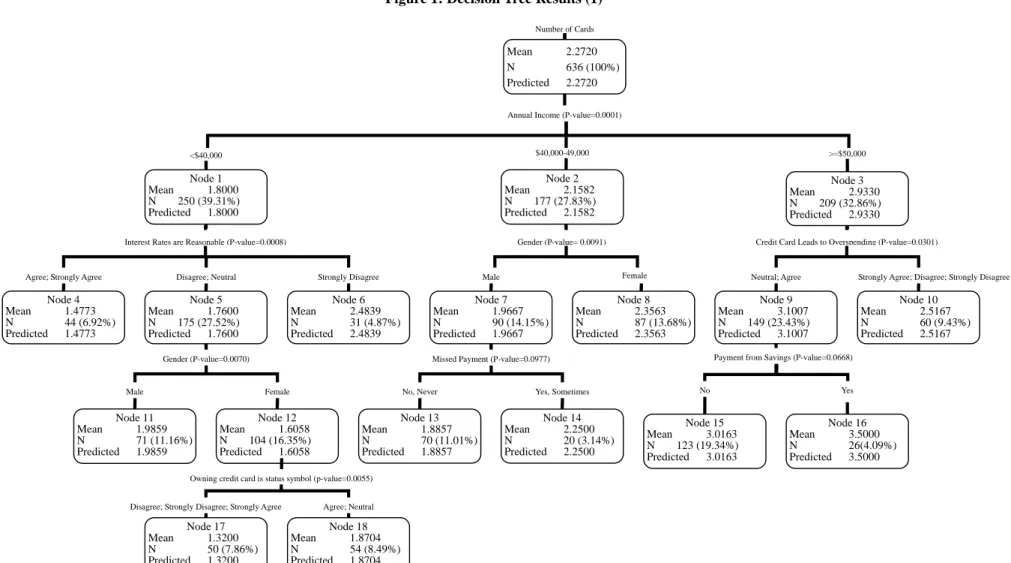
The results of the first decision tree are summarized in Figure 1. As shown, the mean number of credit cards in the sample is 2.27 (see node 0). Annual income is the most important variable associated with the number of credit cards (p-value = 0.0001). In particular, a higher level of annual income is associated with a greater number of credit cards. This is supported by previous studies that found income to be an important determinant for increasing the number of credit card accounts (Gan et al. 2006; Wasburg et al. 1992; Kinsey, 1981) as well as more extensive credit card usage (Kaynak and Harcar, 2001; Heck, 1987; Arora, 1987; Mandell, 1972) in both advanced developing nations (e.g. Singapore and Turkey) and advanced nations (e.g. the United States).
<take in Figure 1>
This study further combines the demographics of respondents with their perceptions about credit card ownership and use. For respondents in the high income group (more than S$50,000 annual income), the perception about credit cards leading to overspending (p-value = 0.0301) and payment of credit card bills from savings (p-value =
0.0668) are the next two most important variables. Those who agree or are neutral about the fact that credit cards lead to overspending and pay their credit card bills from savings own the highest number of credit cards (mean = 3.50, see node 16). On the other hand, those who disagree, strongly disagree or strongly agree that credit cards lead to overspending have a mean number of credit cards of only 2.52. The perception of our high income respondents is consistent with studies conducted in the United States (Soman, 2001; Feinberg, 1986; Hirschman, 1979) that agree credit cards do lead to overspending when viewed from various perspectives. By combining the demographics (e.g. high income) and credit card profile (e.g. financing bills from one’s savings) with perceptions (e.g. credit card leads to overspending) of the respondents, our study specifically found that those who own the most number of cards in our study are higher end income earners who finance their credit card bills from their own savings and hold the view as well that credit card use leads to overspending. Thus, our research offers a richer analysis as compared to previous research in explaining the behavior of cardholders. In this case, we are able to deduce that our respondents are inclined to be prudent/shrewd savers who hold more cards perhaps to take advantage of different discounts and perks offered by various merchants that have ties with different card issuers.
For respondents with annual income of S$40,000 to S$49,000, gender (p-value = 0.0091) and missed payments (p-value = 0.0977) are the next two most important variables. In particular, female credit cardholders in this income group have, on average, 2.36 credit cards as compared to 1.97 for males (see nodes 7 and 8). This is consistent with the Armstrong and Craven (1993) finding that females tend to hold a higher average number of credit cards than males. However, male respondents in this income group who sometimes missed their credit card payments have, on average, 2.25 credit cards as compared to fellow males who never missed payments (mean = 1.89) (see nodes 13 and
14). This is not surprising since those with a greater number of cards would be more likely to miss payments occasionally, having to manage a greater amount of credit card bills.
Finally, respondents with annual incomes below S$40,000 have rather interesting patterns. For this group, the perception that interest rates charged on a credit card are reasonable [1] is the next most important variable (p-value = 0.0008). In particular, those who perceive interest rates to be reasonable have a mean of 1.48 credit cards while those who strongly disagree with this perception have a higher mean of 2.48 (see nodes 4 and 6). This seems counter-intuitive and can probably be explained by the fact that those who strongly disagree with the statement or feel interest rates are unreasonable are more likely to be credit revolvers (instead of convenient users) who tend to hold more cards so as to roll over their credit card debts. This is supported by a number of studies that found lower income earners who value “credit features” such as low interest rates (Kaynak et al., 1995) or use their credit card for “installment or mode of financing” (Slocum and Matthews, 1969; Lee and Hogarthe, 2000) or “as a source of revolving credit” (Durkin, 2000) so as to pay the interest charges on the unpaid balance. Such credit revolvers usually prefer a card with a low interest rate, as suggested by Lee and Hogarthe (2000).
The inverse relationship between incomes and the perception of the level of interest rates comes as no surprise, this being supported by other findings (Gan et al., 2006; Kaynak et al. 1995; Barker and Sekerkaya, 1992; Canner and Cyrnak, 1985, 1986; Kinsey 1981, Slocum and Matthews, 1969) that found lower income earners weighed economic features such as the interest rates (that they might be too high or unreasonable) more than those with higher incomes.
with the perception that interest rates charged on credit card are reasonable, gender is the next most important variable (p-value = 0.0070). Within the lower income group, male respondents actually own more credit cards, on average, than female respondents (1.99 versus 1.61) (see nodes 11 and 12).
Based on the earlier argument, this implies that males are more likely than females to be credit revolvers within the lower income group. Further, for females with lower incomes, the perception that a credit card is a status symbol is the next most important variable (p-value = 0.0055). Females who are neutral or perceive the credit card as a status symbol have a higher mean of 1.87 credit cards
as compared to fellow females who strongly disagree, disagree or strongly agree with this perception
(1.32) (see nodes 17 and 18). This is supported by Gan et al. (2006), who found that the majority of Singapore cardholders do not consider the ownership of credit cards a form of status, thus do not see the need to own more of them. In contrast, at least two Turkish studies found “prestige” as one of the factors affecting how consumers viewed credit cards (Kaynak and Harcar, 2001; Barker and Sekerkaya, 1992). Meidan and Davos (1994) also found that housewives in Greece actually thought “status symbol” was important when selecting a credit card.
The following variables do not appear to be significantly associated with the number of credit cards held: ethnic group, age group, educational level, marital status, occupation, perceptions related to annual fees, purchase funding, loyalty/rewards program and protection, and typical monthly payment and balance transfer options.
Decision Tree 2
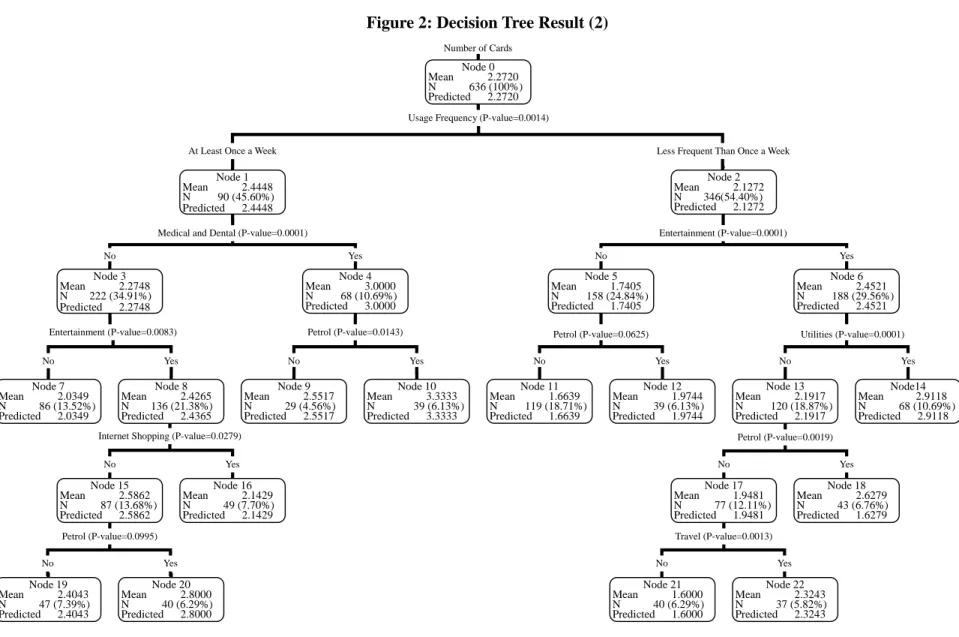
The results of the second decision tree are summarized in Figure 2. As can be seen, respondents who use their credit cards daily or at least once a week tend to hold more cards compared to those who use their credit cards less frequently (mean of 2.45 versus 2.13; p-value = 0.0014). This is supported by Hirschman (1979) who found those with two types of cards are more likely to spend than those with only a single card. For the
former (to be referred to as more-frequent card users), the following card uses are significantly associated with the number of credit cards held: (1) medical and dental [p-value = 0.0001], (2) entertainment [p-value = 0.0083], (3) petrol [p-value = 0.0143 at node 4 and 0.0995 at node 15], and (4) internet shopping [p-value = 0.0279]. Overall, more-frequent card users who hold more credit cards tend to use them for medical and dental expenses as well as petrol purchases (mean = 3.33) (see node 10). Another group also tends to use them for entertainment and petrol but not medical and dental or Internet shopping (mean = 2.80). More-frequent card users with a low average number of credit cards tend to be: (1) those who use their cards neither for medical and dental bills nor for entertainment (mean = 2.03) and, (2) those who use their cards for entertainment and Internet shopping but not medical and dental (mean = 2.14).
<take in Figure 2>
For respondents who use their credit cards less frequently than once a week (referred to as less-frequent card users),the group with the highest average number of credit cards (mean = 2.92) tend to use their credit cards for entertainment (p-value = 0.0001) and utilities (p-value = 0.0001) (see node 14). The group with the second highest mean of 2.63 use their credit cards for entertainment and petrol (p-value = 0.0019) but not utilities. Finally, less-frequent card users who tend to use their credit cards for entertainment only but not utilities, petrol or travel (p-value = 0.0013) have the lowest average number of credit cards (mean = 1.60). In addition, the group with the second lowest mean of 1.66 neither uses their credit cards for entertainment nor petrol.
Overall, the results suggest that holding more credit cards is associated with using them for entertainment and petrol purchases. Also the following card uses do not appear to be significantly associated with the number of credit cards held: expenditures at restaurants, cash advances, groceries, clothing and shoes, books and magazines, insurance,
car installments, furniture and appliances and computer hardware/software.
The link between the number of credit cards carried and their use for entertainment is not surprising as various cards offered ticket discounts from different movie theaters, concert halls and performing arts centers, so such cardholders could be expected to hold a greater number of cards to take advantage of ticket discounts and promotions offered by one card but not by another. The association between petrol purchases and the number of cards could be anticipated as well. Almost every credit card issued by the local banks offers petrol discounts from different petrol companies in Singapore. For instance, United Overseas Bank (UOB) ties up with Royal Dutch Shell to offer petrol discounts or rebates to its cardholders. Similar tie-ups can be found between Citibank and Exxon-Mobil, the Hong Kong and Shanghai Bank (HSBC) and Caltex, and Development Bank of Singapore (DBS) and Singapore Petroleum Company. As Transportation and communication represented 20 percent of household consumption in 2002, and considering the prevalence of an intense petrol price war (The Straits Times, 2002) at the time this survey was conducted, it was not surprising to find cardholders possessing more than one card to take advantage of successive discounts offered by different petrol stations in Singapore. According to a report by Visa International (2004a), Singaporeans hold multiple cards simply because one card may offer benefits such as discounts and promotions that another card does not. This is supported by studies (Carow and Staten, 1999; Schlossberg, 1998; Stavins, 1996) from the United States that found rebates and enhancements such as frequent-use rewards were major reasons for consumers to use their credit cards.
Conclusion and future research
Our research supports previous studies on the significant relationship between the number of credit cards and demographics such as income and gender, and it adds to the
relevant literature concerning an advanced developing economy in Asia. By combining further these demographics and credit card profiles of the respondents with their perceptions towards card ownership and use by means of a decision tree analysis, our research offers a richer analysis to explain cardholder behavior than previous literature. Moreover, our research indicates that Singaporean respondents do not view credit card ownership and use much differently from cardholders from advanced economies such as the United States. Singaporean cardholders are inclined to be more diverse by holding a greater number of cards, mostly to take advantage of discounts, promotions and perks offered by different card-issuing banks. Using the statistics between mid 2003 to mid 2004, the Credit Bureau of Singapore (CBS) estimated Singaporean cardholders possess on average 2.4 to 3.4 cards, although it was not difficult to find someone with more than 6 to 12 credit cards (The Straits Times, 2005e). This is supported by a report by Lafferty Group (2004) that estimated eligible Singaporean cardholders owned more than 4 to 5 general purpose credit cards. Does it imply that multiple-cardholders are easily lured by various discounts/promotions and perks/enhancements offered by different card issuers, and thus are not as loyal as those who hold one or at the most two cards? This will be an interesting research issue to extend across different cultures and regions.
Our research also highlights some marketing strategies card-issuers can adopt in terms of customer segmentation. They would want to target the following potential card users: (1) Higher income earners (for instance, by offering a Platinum card); (2) middle income females (for instance, by offering “ladies” cards as have already been aggressively marketed by at least 2 local banks in Singapore); (3) lower income females who are attracted by the “status symbol” of the card (for instance, by offering card privileges and designs that create a sense of “exclusiveness”); and (4) lower income males who are credit revolvers (for instance, by offering attractively low interest rates for
balance transfers). Once a certain cardholder group has been segmented, card-issuers can analyze and study the group’s behavior in terms of what will boost higher usage. Cross-selling is another strategy card-issuers can adopt to promote card usage as well as cardholders’ loyalty. Our research suggests cross-selling products and services relating to entertainment, sports, leisure and transportation will help card-issuers to extend their customer base effectively. Examples can include discounts or rebates when paying for tickets to various cultural performing arts centers, monthly health club memberships, monthly car insurance installments, and periodic car maintenance services among others.
In terms of cross-selling, Citibank recently introduced a “one-bill” payment service in Singapore. This is a move to tie-up with companies that provide routine monthly services that require recurring monthly payments (The Straits Times, 2005b). Some examples of such payment items include utilities, telephone/Internet/cable TV subscriptions, insurance or income tax installment payments, and club/gymnasium memberships among others. Such a move will encourage cardholders to consolidate their bills into one monthly payment by credit card, ultimately promoting a lock-in of customer loyalty. From the card issuers’ perspective, this translates into higher cardholders’ expenditures and therefore interest incomes without marketing new cards, and thus should be encouraged. For consumers, it can mean cutting down the number of cards owned and being on a faster path to earning loyalty rewards points. Our finding indicates that a lower number of cards owned by a typical cardholder implies better credit management and lower chances of missing payments, and eventually less likelihood of rolling over credit and thus incurring lower credit debts. It seems like a win-win situation for both card-issuers and cardholders, and it fulfills the policy makers’ goal of reducing household debts. However, would the “one-bill” payment service lead to a lesser number of cards owned by a typical cardholder, thus promoting consumer loyalty and resulting in higher
interest income earned for a single car-issuer, or would it lead to a loss of interest income as a result of not marketing new cards? This indeed would be an interesting research issue for both researchers and industry practitioners to explore in the future.
In addition, our research raises a major issue concerning whether the goals of credit-issuing banks are consistent with those of the government. For instance, the selling of more cards to the lower income credit revolvers by card issuers may encourage credit roll-over, thus it may not be in line with the government’s goal of reducing credit debts. Further, do credit-issuing banks really wish for cardholders to get out of their credit debts or do they wish to continue earning interest incomes from the latter’s debts? There have been cases of local banks offering prizes to cardholders just to stay in debt (The Straits Times, 2005c). For instance, one bank recently gave away PDA mobile phones to cardholders who pay only the minimum monthly balances while another bank offers cash to those who do not pay up in full! More importantly, are card issuers offering consumers credit limits beyond the latter’s ability to service payments? Studies have shown that generous credit limits can lead to immediate and significant debt (Gross and Souleles, 2002) and even personal bankruptcies (Paquin and Squire-Weiss, 1998). Indeed a number of studies in the United States (Ausubel, 1997, Kowalewski, 1997, Morgan and Toll, 1997) found that the rise in the household debt burden was closely related to credit card defaults and personal bankruptcies. This is true in the case of Singapore too (The Straits Times, 2005d, 2005e).
Our research thus raises the social responsibilities of card-issuers, and it points to the need for active regulatory roles played by agencies such as the Monetary Authority of Singapore (MAS) in formulating control measures to prevent recurring credit debts that can lead to personal bankruptcy. The MAS can ensure that card-issuing banks follow certain sets of guidelines to achieve the goal of reducing the credit debts. For instance,
card-issuing banks can contribute by: (1) lowering the credit limits [2] on the credit card even though that may compromise their marketing goal of selling more cards; (2) assigning each cardholder an appropriate credit limit according to the latter’s ability to pay; (3) imposing an “outstanding credit limit” in which cardholders are required to pay off the balance they owe beyond that limit within, for instance, 3 months, before they can incur new debts; (4) raising the monthly minimum payment [3] on credit cards to discourage cardholders from rolling over their debts.
Furthermore, in curtailing personal bankruptcy as a greater goal of the society, agencies such as the Consumer Association of Singapore (CASE), the Credit Bureau of Singapore (CBS), and Credit Counseling Singapore (CCS) can all play their respective roles. On the one hand, CASE, the local consumer protection agency, can continue to feedback consumers’ concerns to the banks and urge the latter to lower interest rates on credit card debts. On the other hand, CBS, since its inception in October 2002, had set up a database to help banks pool information on consumers to better manage their risks. Banks that participate can disclose and receive credit histories of customers to assess their credit-worthiness. This development is likely to lower credit defaults and delinquency rates, eventually reducing household bankruptcies.
Finally, our research also highlights the social responsibilities of consumers. While it is true that consumers ultimately are financially responsible for their own debts, they have social responsibilities too. Some consumers, however, are quite naïve in terms of credit features such as the interest rates charged and credit limits available to them (Warwick and Mansfield, 2000). In some instances, consumers do not even realize they habitually spend more than their incomes (Mapother, 1999). A study in the United States showed that mandatory disclosure of information such as interest rates, may not necessarily help consumers make better credit decisions; instead, a better understanding
of credit use on the consumers’ part can lower their debts (Warwick and Mansfield, 2000). This is supported by Lee and Hogarthe, (1999), citing the consumers’ lack of understanding in the use of credit as a problem in the credit markets. Credit Counseling Singapore (CCS), a local non-profit organization, is correcting this shortcoming by: (1) providing credit education to the public to help them to manage their money and use their credit responsibly; and (2) counseling the financially distressed and helping them to negotiate a schedule of payment with the banks. Since the set up of CCS in August 2003, the number of debtors seeking credit counseling has increased from 150 in October 2004 to 1,000 by November 2005 (The Straits Times, 2004b, 2005a). However, in the long run, cardholders are ultimately responsible for their debts; hence, future research can focus on general attitudes of cardholders towards credit debts and whether debt is seen as something cardholders can control, and if not, whether they would seek help from any known sources.
Endnotes
[1] At the time of the writing, most credit card companies and card-issuing banks in Singapore charged an annual interest rate of 24 percent, with the exception of Maybank’s eCard and Flash card (15 percent).
[2] Credit limit for credit cards is restricted to a maximum of 2 months salary in Singapore, although some banks grant exceptions to some clients on a case-by-case basis.
[3] Most local banks in Singapore currently charge a monthly minimum payment at 3 to 5 percent of balance or S$50, whichever is higher.
References
Adcock, W.O., Hirschman, E.C. and Goldstucker, J.L. (1977). “Bank credit card users: an update profile”, Advances in Consumer Research, Vol. 4, pp. 236-241. Armstrong, C.J. and Craven, M.J. (1993). “Use and payment practices among a
sample of college students”, Proceedings of the 6th Annual Conference of the Association for Financial Counseling and Planning Education, pp. 48-159.
Arora, R. (1987). “Consumer knowledge of finance charges on credit card purchases”, in Hawes, J. (Ed.), Development in Marketing Science, Vol. 10, Proceedings of the 11th Annual Conference of the Academy of Marketing Science, Florida, pp. 15-18. Ausubel, L.M. (1997). “Credit card defaults, credit card profits, and bankruptcy”,
American Bankruptcy Law Journal, Vol. 71, pp. 249-270.
Barker, T and Sekerkaya, A. (1992). “Globalisation of credit card usage: the case of a developing economy”, International Journal of Bank Marketing, Vol. 10 No. 6, pp. 27-31.
Canner, G.B. and Cyrnak, A.W. (1986). “Determinants of consumer credit card usage patterns”, Journal of Retail Banking, Vol. 8 No. 1 and 2, pp. 9-18.
Canner, G.B. and Cyrnak A.W. (1985). “Recent development in credit card holding and use patterns among USA families”, Journal of Retail Banking, Vol. 7 No. 3 and 2, pp. 63-74.
Carow, K.A. and Staten M.E. (1999). "Debit, credit, or cash: survey evidence on gasoline purchases”, Journal of Economics and Business, Vol. 51 No. 3, pp. 409-421.
Chan, R.Y. (1997). “Demographic and attitudinal differences between active and inactive credit card holders - the case of Hong Kong”, International Journal of Bank Marketing, Vol. 15 No. 4, pp. 117-125.
Choi, H.N. and DeVaney S. (1995). “Factors associated with the use of bank and retail credit cards”, In McKenzie, S.B. and Stayman, D.M. (Eds), Proceedings of the Society for Consumer Psychology, American Psychology Association, La Jolla, CA. pp. 152-159.
Danes, S.M. and Hira T.K. (1990). “Knowledge, beliefs, and practices in the use of credit cards”, Home Economics Research Journal, Vol. 18, pp. 223-235.
Durkin, T.A. (2000). “Credit cards: use and consumer attitudes, 1970-2000”, Federal Reserve Bulletin, September 2000.
Feinberg, R.A. (1986). “Credit card as spending facilitating stimuli: a conditioning interpretation”, Journal of Consumer Research, Vol. 13 No. 3, pp. 348-56.
Gan, L., Maysami, R.C. and Koh, H.C. (2006). “Credit card selection criteria among Singaporean consumers”, Economic Growth Centre working paper, School of Humanities and Social Sciences, Nanyang Technological University, Singapore. Gross, D.B. and Souleles, N.S. (2002). “Do liquidity constraints and interest rates
matter for consumer behavior?” Quarterly Journal of Economics, February, pp. 150-185.
Heck, R.K.Z. (1987). “Differences in utilization behavior among types of credit card”, The Service Industries Journal, Vol. 7 No.1, pp. 41-65.
Hirschman, E.C. (1979). “Differences in consumer purchase behavior of credit card payment system”, Journal of Consumer Research, Vol. 6, June, pp. 58-66.
Ingram, F.J. and Pugh O.S. (1981). “EFT and bank cards: household attitudes and practices”, Journal of Retail Banking, Vol. 3 No. 4, pp. 45-51.
Kaynak, E. and Harcar, T. (2001). “Consumers’ attitudes and intentions towards credit card usage in an advanced developing country”, Journal of Financial Services Marketing, Vol. 6, No. 1, pp.24-39.
Kaynak, E., Kucukemiroglu, O. and Ozmen A. (1995). “Correlates of credit card acceptance and usage in an advanced developing Middle Eastern country”, Journal of Services Marketing, Vol. 9, issue 40, pp. 52-63.
Kinsey, J. (1981). “Determinants of credit card accounts: an application of tobit analysis”, Journal of Consumer Research, Vol. 8 No. 2, pp. 177-82.
Kowalewski, K.J. (1997). “Statement on consumer debt and bankruptcy before the National Bankruptcy Review Commission”, January 23.
Lafferty Group (2004). “Credit cards and consumer lending in Asia-Pacific 2003-2005”, Industry Report.
Lee, J. and Hogarthe, J.M. (2000). “Relationships among information search activities when shopping for a credit card”, Journal of Consumer Affairs, Vol. 34, Issue 2, pp. 330-360.
Lee, J. and Hogarthe, J. (1999). “The price of money: consumers’ understanding of APRs and contract interest rates”, Journal of Public Policy and Marketing, Vol. 18 No. 1, pp. 66-76.
Lunt, P. (1992). “What boosts card usage?” ABA Banking Journal, Vol. 84 No. 7, July, pp. 82-85.
Mandell, L. (1972). “Credit card use in the US”, Institute of Social Research University of Michigan, Internal Report, Michigan, IL.
65 No. 6, p. 78.
Meidan, A. and Davos, D. (1994). “Credit and charge cards selection criteria in Greece”, The International Journal of Bank Marketing, Vol. 12 No. 2, pp. 36-44.
Ministry of Law, Singapore (2005). Available at http://www.minlaw.gov.sg/ipto/bank_fctfgr.html
Monetary Authority of Singapore (2005). “Credit and charge card statistics”, Table I.17. Available at http://www.mas.gov.sg
Morgan, D. and Toll, I. (1997). “Bad debt rising”, Current Issues in Economics and Finance, Federal Reserve Bank of New York, March, pp. 1-5.
Moschis, G.P. (1990). “Older consumer orientations towards marketing activities and responses to new products”, Center for Mature Consumer Studies, Georgia State University, Atlanta.
Paquin, P. and Squire-Weiss, M. (1998). “Personal bankruptcies: study finds four key determinants”, Journal of Retail Banking Services, Vol. 20 No.1, pp. 49-55. Schlossberg, H. (1998). “Enhancing the enhancements”, Credit Card Management,
Vol. 10, Issue 12, pp. 32-39.
Singapore Department of Statistics (2005). Available at http://www.singstat.gov/sg Slocum, J.W. and Matthews, H.L. (1969). “Social class and commercial bank credit
card usage”, Journal of Marketing, Vol. 33 No. 1 (January), pp. 71-78.
Slocum, J.W. and Matthews, H.L. (1970). “Social class and income as indicators of consumer credit behavior”, Journal of Marketing, Vol. 34 No. 2 (April), pp. 69-74.
Soman, D. (2001). “Effects of payment mechanism on spending behavior: the role of rehearsal and immediacy of payments”, Journal of Consumer Research, Vol. 27 No. 4, pp. 460-74.
Soman, D. and Cheema, A. (2002). “The effect of credit on spending decisions: the role of the credit limit and credibility”, Marketing Science, Vol. 21 No. 1, pp. 32-53. Stavins, Joanna (1996). “Can demand elasticities explain sticky credit card rates”,
Federal Reserve Bank of Boston, New England Economic Review, July/August, pp. 43-54.
The Straits Times (2005a). “Emergence of ‘new poor’ a worrying trend: credit agency”, by Lorna Tan, October 28.
The Straits Times (2005b). “Credit card issuers target Mr. bill payer”, by Lorna Tan, October 6.
The Straits Times (2005c). “Get rewarded – for not paying up in full”, by Kelvin Wong, July 20.
The Straits Times (2005d). “Local consumers shuffle their plastic better”, by Kelvin Wong, June 2.
The Straits Times (2005e). “Saying ‘no’ to credit card debt”, by Leong Chan Teik, February 6.
The Straits Times (2004a). “One in ten credit card users here pays bill late”, by Lorna Tan, October 1.
The Straits Times (2004b). “Experts band together to offer credit counselling”, by Su-Yin Yap, October 15.
The Straits Times (2002). “SPC joins latest round of price cuts of diesel”, November 28.
Visa International (2004a). “Credit card use and debt in Singapore”, July. Available http://www.visa-asia.com/ap/sea/valueofvisa/industrywatch/vov_card_usage.shtml Visa International (2004b). “Credit card use and debt in Hong Kong”, August.
Available
http://www.visa-asia.com/ap/sea/valueofvisa/industrywatch/vov_card_usage.shtml Visa International (2004c). “Credit card use and debt in Taiwan”, September.
Available
http://www.visa-asia.com/ap/sea/valueofvisa/industrywatch/vov_card_usage.shtml Warwick, J. and Mansfield, P. (2000). “Credit card consumers: college students’
knowledge and attitude”, Journal of Consumer Marketing, Vol. 17 No. 6/7, pp. 617-626.
Wasburg, C.A., Hira, T.K. and Fanslow, A.M. (1992). “Credit card usage and consumer debt of households”, Journal of Consumer Studies and Home Economics, Vol. 16, pp. 19-32.
White, K.J. (1975). “Consumer choice and use of bank credit cards: a model and cross-section results”, Journal of Consumer Research, Vol. 2 No. 1, pp. 10-18. Zhu, L.Y. and Meeks, C.B. (1994). “Effects of low income families’ ability and
willingness to use consumer credit on subsequent outstanding credit balances”, The Journal of Consumer Affairs, Vol. 28 No. 2, pp. 403-422.
Table I. Perceptions Concerning Credit Card Ownership and Use
a. Interest rates charged on credit card balances are reasonable. b. Credit card annual fees are reasonable.
c. Credit card companies should ensure complete privacy over customers’ information.
d. I am satisfied with the level of service provided by my credit card company. e. Owning a credit card is a form of status symbol.
f. Consumers would be better off if there were no credit cards. g. Consumers tend to overspend when they have credit cards.
h. I have no qualms about switching credit card companies due to poor service. i. Credit cards are useful because they allow purchase before funds are actually
available.
j. I use credit cards because they offer loyalty and reward programs. k. Credit cards are useful because they can be used anytime at most places.
l. I use credit cards because they offer protection against loss/damage of purchased goods.
Table II. Credit Card and Demographic Characteristics of the Sample (N = 636)
Part I: Credit Card Profile Total Percent
Number of Credit Cards Owned
1 191 30.0 2 225 35.4 3 121 19.0 4 55 8.6 5 43 6.8 5 or more 1 0.2
Types of Credit Cards Owned
Visa 555 42.4 American Express 157 12.0 MasterCard 332 25.4 Diners Club 106 8.0 Departmental Store 153 11.7 Others 6 0.5 Usage Frequency Daily 55 8.6 Weekly 235 36.9 Fortnightly 153 24.1 Monthly 169 26.6 Others 24 3.8 Usage Pattern Restaurants 510 16.5
Clothing and Shoes 411 13.4
Entertainment 365 11.8
Travel Services 327 10.6
Petrol 244 7.9
Internet Shopping 183 5.9
Groceries 175 5.7
Books and Magazines 174 5.6
Furniture/Appliances 142 4.6
Utilities 142 4.6
Medical/Dental 140 4.5
Insurance 66 2.2
Cash Advance 65 2.2
Car Installments 28 0.9
Others 5 0.2
Typical Monthly Credit Card Payment
Entire Balance 444 69.8
Between Minimum & Entire Balance 144 22.6
Minimum Balance 47 7.4 Others 1 0.2 Missed Payment Never 492 77.4 Sometimes 132 20.7 Often 12 1.9
New Credit Card Account Owned in the Past Year
0 448 70.4
1 card 142 22.4
2-3 cards 42 6.6
More than 3 cards 4 0.6
Transferred Balance in the Past Year
Never 592 93.4
Once 29 4.6
2-3 times 11 1.7
More than 3 times 2 0.3
Payment Sources
Salary 605 75.4
Savings 144 17.9
Investment/Rental 34 4.3
Balance Transfer/Credit Line 17 2.1
Borrow 2 0.2
Others 1 0.1
Part III: Demographic Profile
Male 357 56.1 Female 279 43.9 Ethnic Group Chinese 382 60.1 Malay 144 22.6 Indian 95 14.9 Others 15 2.4 Age Group 25 and below 87 13.7 26 - 35 285 44.9 36 - 45 194 30.6 46 - 55 66 10.3 56 and above 3 0.5 Education Qualification
Graduate Degree Holder 106 16.7
Tertiary Degree Holder 197 31.0
Diploma Holder 197 31.0
GCE ‘A’ Level 55 8.6
GCE ‘O’/’N’ Level 76 11.9
Others 5 0.8 Marital Status Married 361 56.8 Single 260 40.8 Divorced 15 2.4 Occupation
Professional, Manager or Executive 365 57.7
Sales and Service Worker 86 13.6
Self-Employed and Businessman 68 10.7
Clerical and Other White-Collar Worker 63 9.9
Army/ Police/Security Staff 28 4.4
Production, Transport and Other Blue-Collar Worker 6 0.9
Annual Personal Income < S$30,000 5 0.8 S$30,000 - S$39,999 245 38.5 S$40,000 - S$49,999 177 27.9 S$50,000 - S$59,999 102 16.0 S$60,000 - S$69,999 41 6.4 S$70,000 and above 66 10.4
Figure 1: Decision Tree Results (1) Number of Cards Mean 2.2720 N 636 (100%) Predicted 2.2720 <$40,000 $40,000-49,000 >=$50,000 Node 1 Mean 1.8000 N 250 (39.31%) Predicted 1.8000 Node 2 Mean 2.1582 N 177 (27.83%) Predicted 2.1582 Node 3 Mean 2.9330 N 209 (32.86%) Predicted 2.9330
Interest Rates are Reasonable (P-value=0.0008) Gender (P-value= 0.0091) Credit Card Leads to Overspending (P-value=0.0301)
Agree; Strongly Agree Disagree; Neutral Strongly Disagree
Node 4 Mean 1.4773 N 44 (6.92%) Predicted 1.4773 Node 5 Mean 1.7600 N 175 (27.52%) Predicted 1.7600 Node 6 Mean 2.4839 N 31 (4.87%) Predicted 2.4839 Gender (P-value=0.0070) Male Female Node 11 Mean 1.9859 N 71 (11.16%) Predicted 1.9859 Node 12 Mean 1.6058 N 104 (16.35%) Predicted 1.6058
Owning credit card is status symbol (p-value=0.0055)
Disagree; Strongly Disagree; Strongly Agree Agree; Neutral
Node 17 Mean 1.3200 N 50 (7.86%) Predicted 1.3200 Node 18 Mean 1.8704 N 54 (8.49%) Predicted 1.8704 Male Female Node 7 Mean 1.9667 N 90 (14.15%) Predicted 1.9667 Node 8 Mean 2.3563 N 87 (13.68%) Predicted 2.3563
Missed Payment (P-value=0.0977)
No, Never Yes, Sometimes
Node 13 Mean 1.8857 N 70 (11.01%) Predicted 1.8857 Node 14 Mean 2.2500 N 20 (3.14%) Predicted 2.2500
Neutral; Agree Strongly Agree; Disagree; Strongly Disagree
Node 9 Mean 3.1007 N 149 (23.43%) Predicted 3.1007 Node 10 Mean 2.5167 N 60 (9.43%) Predicted 2.5167 No Yes Node 15 Mean 3.0163 N 123 (19.34%) Predicted 3.0163 Node 16 Mean 3.5000 N 26(4.09%) Predicted 3.5000
Annual Income (P-value=0.0001)
Figure 2: Decision Tree Result (2) Number of Cards Node 0 Mean 2.2720 N 636 (100%) Predicted 2.2720
Usage Frequency (P-value=0.0014)
At Least Once a Week Less Frequent Than Once a Week
9
Node 1 Mean 2.4448 N 90 (45.60%) Predicted 2.4448
Medical and Dental (P-value=0.0001)
Node 2 Mean 2.1272 N 346(54.40%) Predicted 2.1272 Entertainment (P-value=0.0001) No Yes Node 3 Mean 2.2748 N 222 (34.91%) Predicted 2.2748 Entertainment (P-value=0.0083) Node 4 Mean 3.0000 N 68 (10.69%) Predicted 3.0000 Petrol (P-value=0.0143) No Yes Node 7 Mean 2.0349 N 86 (13.52%) Predicted 2.0349 Node 8 Mean 2.4265 N 136 (21.38%) Predicted 2.4365
Internet Shopping (P-value=0.0279)
No Yes Node 15 Mean 2.5862 N 87 (13.68%) Predicted 2.5862 Node 16 Mean 2.1429 N 49 (7.70%) Predicted 2.1429 Petrol (P-value=0.0995) No Yes Node 19 Mean 2.4043 N 47 (7.39%) Predicted 2.4043 Node 20 Mean 2.8000 N 40 (6.29%) Predicted 2.8000 No Yes Node 5 Mean 1.7405 N 158 (24.84%) Predicted 1.7405 Node 6 Mean 2.4521 N 188 (29.56%) Predicted 2.4521
Petrol (P-value=0.0625) Utilities (P-value=0.0001)
No Yes Node 11 Mean 1.6639 N 119 (18.71%) Predicted 1.6639 Node 12 Mean 1.9744 N 39 (6.13%) Predicted 1.9744 No Yes Node 13 Mean 2.1917 N 120 (18.87%) Predicted 2.1917 Node14 Mean 2.9118 N 68 (10.69%) Predicted 2.9118 Petrol (P-value=0.0019) No Yes Node 17 Mean 1.9481 N 77 (12.11%) Predicted 1.9481 Node 18 Mean 2.6279 N 43 (6.76%) Predicted 1.6279 Travel (P-value=0.0013) No Yes Node 21 Mean 1.6000 N 40 (6.29%) Predicted 1.6000 Node 22 Mean 2.3243 N 37 (5.82%) Predicted 2.3243 No Yes Node 9 Mean 2.5517 N 29 (4.56%) Predicted 2.5517 Node 10 Mean 3.3333 N 39 (6.13%) Predicted 3.3333