DOI: https://doi.org/10.22146/ijccs.47046 263
Detection of Spam Comments on Instagram Using
Complementary Naïve Bayes
Nur Azizul Haqimi*1, Nur Rokhman2, Sigit Priyanta3
1
Master Program of Computer Science and Electronics, FMIPA UGM, Yogyakarta, Indonesia
2,3
Department of Computer Science and Electronics, FMIPA UGM, Yogyakarta, Indonesia e-mail: *[email protected], [email protected],[email protected]
Abstrak
Instagram (IG) merupakan salah satu aplikasi media sosial berbasis web dan mobile dimana pengguna dapat membagikan foto atau video dengan fitur yang tersedia. Mengunggah foto atau video dengan caption yang berisi penjelasan tentang foto atau video tersebut dapat menuai komentar spam. Komentar spam berisi komentar yang tidak relevan dengan caption dan foto. Masalah yang muncul ketika mengidentifikasi spam adalah komentar nonspam lebih dominan daripada komentar spam sehingga mengarah pada masalah ketidakseimbangan data (imbalance dataset). Imbalanced dataset dapat memberikan pengaruh terhadap perfoma suatu metode klasifikasi. Hal tersebut menjadi fokus penelitian terkait dengan implementasi metode CNB dalam menangani imbalance dataset pada deteksi komentar spam Instagram. Penelitian menggunakan pembobotan TF-IDF dengan Support Vector Machine (SVM) sebagai klasifikasi pembanding. Berdasarkan hasil pengujian dengan data latih 2500 dan data uji 100 pada imbalanced dataset (25% spam dan 75% nonspam) maka didapatkan akurasi CNB sebesar 92 %, precision sebesar 86 % dan f-measure 93 %. Sedangkan SVM menghasilkan akurasi sebesar 87 %, precision sebesar 79%, f-measure 88 %. Kesimpulannya metode CNB lebih cocok untuk mendeteksi komentar spam pada kasus imbalanced dataset.
Kata kunci— Instagram, Spam, Complementary Naïve Bayes, Support Vector Machine
Abstract
Instagram (IG) is a web-based and mobile social media application where users can share photos or videos with available features. Upload photos or videos with captions that contain an explanation of the photo or video that can reap spam comments. Comments on spam containing comments that are not relevant to the caption and photos. The problem that arises when identifying spam is non-spam comments are more dominant than spam comments so that it leads to the problem of the imbalanced dataset. A balanced dataset can influence the performance of a classification method. This is the focus of research related to the implementation of the CNB method in dealing with imbalance datasets for the detection of Instagram spam comments. The study used TF-IDF weighting with Support Vector Machine (SVM) as a comparison classification. Based on the test results with 2500 training data and 100 test data on the imbalanced dataset (25% spam and 75% non-spam), the CNB accuracy was 92%, precision 86% and f-measure 93%. Whereas SVM produces 87% accuracy, 79% precision, 88% f-measure. In conclusion, the CNB method is more suitable for detecting spam comments in cases of imbalanced datasets.
1. INTRODUCTION
Instagram is a social media for sharing photos and videos that allow users to like or like to comment on media that has been shared [1]. Spam appearing in online media can be in the form of e-mail, websites, videos, microblogs, comments, reviews [2]. Spam is directing all social media users to websites that have no connection with content [3]. Instagram's popularity causes advertisements and spam posts to become more abundant [4], so the characteristics of spam comments are also increasingly widespread such as vulgar comments and intermittent comments.
Detecting spam on social media, especially when massive data flows continuously is a big task that requires technical insight. In general, spam detection uses machine learning techniques to separate spam and non-spam[2]. The machine learning method used to detect spam is Complementary Naïve Bayes (CNB).
The problem that arises when identifying spam is non-spam comments are more dominant than spam comments so that it leads to data imbalance problems. Data imbalance or imbalanced dataset is a significant difference between the number of minority class instances and majority class instances [5]. The imbalanced dataset can pose a risk of misclassification of the dataset so that the performance of a classification algorithm is not optimal [6] because it assumes that the class distribution in the dataset is relatively balanced and the cost of classification errors is the same. When the percentage of a minority class sample is less than 20%, the dataset is considered to be very unbalanced and the classifier's performance continues to deteriorate when the majority sample percentage decreases [7].
Previous research related to the detection of spam comments on Instagram has been done with many different case studies and processes. Term Frequency Inverse Document Frequency (TF-IDF) weighting method for multiplying the number of tokens in a comment with a log of the total number of comments [8]. While the CNB method is a classification method to calculate the probability of a data in a particular class by identifying that the data is in another class so that it can balance the dataset in the case of the imbalanced dataset [9]. Besides CNB, the Support Vector Machine is a classification method that is able to generalize with smaller errors [10]. SVM method with RBF kernel as an application tool for parameter selection [3].
Based on the background of the problems described, the focus of this research is to detect spam comments on Instagram with a case of imbalanced datasets using TF-IDF weighting, Complementary Naïve Bayes and Support Vector Machine as a comparison classification method.
This paper is organized as follows. Section 2 describes the proposed method, while Section 3 elaborates the results of the evaluation. The conclusion and future work are presented in Section 4.
2. METHODS
In this section, the proposed method is explained in detail. This includes the data that is used in this research and the model to detect spam.
2.1 Data Collection
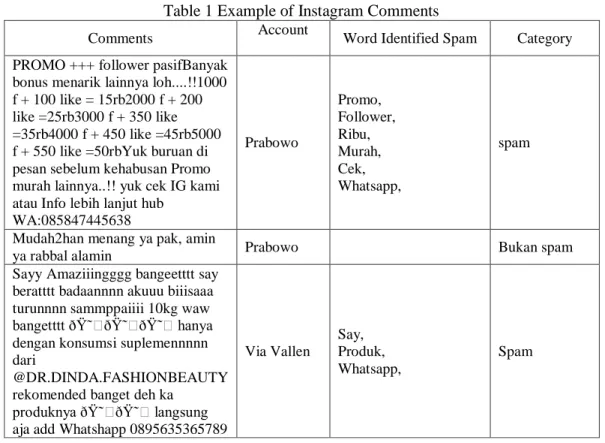
Data collection includes the Instagram comment column related to public figures in Indonesia. Data collection was carried out on October 15, 2018, as many as 2600 comments. Taking comments uses scraping techniques by utilizing libraries in the Python programming language, BeautifulSoup. The results of scraping are then labeled manually. Example of Instagram comments can be seen in the table 1.
Table 1 Example of Instagram Comments
Comments Account Word Identified Spam Category PROMO +++ follower pasifBanyak
bonus menarik lainnya loh....!!1000 f + 100 like = 15rb2000 f + 200 like =25rb3000 f + 350 like =35rb4000 f + 450 like =45rb5000 f + 550 like =50rbYuk buruan di pesan sebelum kehabusan Promo murah lainnya..!! yuk cek IG kami atau Info lebih lanjut hub
WA:085847445638 Prabowo Promo, Follower, Ribu, Murah, Cek, Whatsapp, spam
Mudah2han menang ya pak, amin
ya rabbal alamin Prabowo Bukan spam Sayy Amaziiingggg bangeetttt say
beratttt badaannnn akuuu biiisaaa turunnnn sammppaiiii 10kg waw bangetttt ðŸ˜ðŸ˜ðŸ˜ hanya dengan konsumsi suplemennnnn dari
@DR.DINDA.FASHIONBEAUTY rekomended banget deh ka
produknya ðŸ˜ðŸ˜ langsung aja add Whatshapp 0895635365789
Via Vallen Say, Produk, Whatsapp, Spam 2. 2 Dataset
The total data owned is 2600 then divided by 2500 for training data and 100 (50 spam and 50 non-spam) for test data. The amount of training data with a imbalanced dataset has 1875 (75%) non-spam comments and 625 spam (25%) comments. Training data is used to classify spam or non-spam and generate test data. While the test data is used to measure the extent to which the classifier successfully classifies correctly. Experiments on the balanced dataset with a distribution of 1700 spam comments and 1700 non-spam comments.
2.3 Detection Of Spam Comments On Instagram Model
The research design that will be proposed in the study includes three stages which can be seen in Figure 1. Instagram comments labeled Preprocessing Weighting of TF-IDF Spam detection Testing algorithm results the results of the spam detection 1 2 3 5 6 Model Training 4 7 Start End
A detailed explanation of the spam detection is as follows: 1. Instagram Comments Labeled
After the data collection process, comment data in the study was done manually labeling. Manual labeling is done by identifying words that include the spam and non-spam categories in each comment.
2. Preprocessing
Preprocessing includes several stages as follows:
a. Case Folding
The process for converting capital letters to lowercase letters. Case Folding only accepts Latin letters from 'a' to 'z' and removes characters other than letters and is considered a delimiter.
b. Tokenization
The process of decomposing sentences into one or more words and eliminating delimiters such as periods (.), commas (,), spaces and numeric characters in the word.
c. Normalization
The approach taken to change the text on social media becomes the word 'good'. This research collects inappropriate words and provides correct words stored in a corpus.
d. Stemming
Stemming is needed to group other words that have similar words and meanings but have different forms or forms because they have different affixes.
e. Stopword Removal
The process for removing words or features that are not important and often appear in text documents such as conjunctions. Stopword removal can use stoplist algorithms (throw less important words) or wordlist (save important words). Stoplist/stopword are non-descriptive words that can be discarded in the bag-of-words approach.
3. Weighting of TF-IDF
Weighting of TF-IDF is the process of calculating the weight of each term in the document so that it can know the availability and similarity of the terms in the document. Term Frequency (TF) is the frequency of appearance of feature in the document . Term Frequency is mathematically denoted in equation (1).
(1)
The classification of text on Instagram means Inverse Document Frequency (IDF) is a log of the division of the total number of comments (N) with the total number of comments where the token appears [8]. Inverse Document Frequency (IDF) is denoted in equation (2).
(2)
TF-IDF weight ( ) value is the result of multiplication between equation 1 and equation 2. Mathematical notation is shown in equation (3).(3)
4. Model TrainingThe next step is to train the validation model using the k-fold cross-validation with training data. The training data is divided into validation data and training data in the process of training the validation model with k-fold cross-validation. Model making by entering initial parameter values. CNB has Alpha parameters and SVM has Gamma and C parameters for RBF kernels. The k-fold cross validation scheme can be seen in Figure 2.
2600 2500 100 75% 25% Training Data Test Data spam Non spam
Validation Data Training Data
Data Sample
Cross Validation
Figure 2 k-fold cross-validation scheme
The training process uses K-Fold Cross-Validation with K = 10 and training data of 2500. From the training data, the distribution is 10% for validation data and 90% for training data. After the validation model is built, predictions will be made with validation data so that it gets a label. The training process is repeated 10 times to calculate the accuracy of the comparison of validation data labels and predictive labels so that parameters can be known with the best accuracy. The training process aims at research to find parameters with the best accuracy. 5. Spam Detection
The spam detection process is a process of predicting comments from test data as many as 100 comments that produce spam or non-spam (y ') labels. The classification method as a comparison method is SVM which is carried out alternately with the CNB method with the same steps. Explanation of each classification method can be explained as follows:
a. Complementary Naïve Bayes
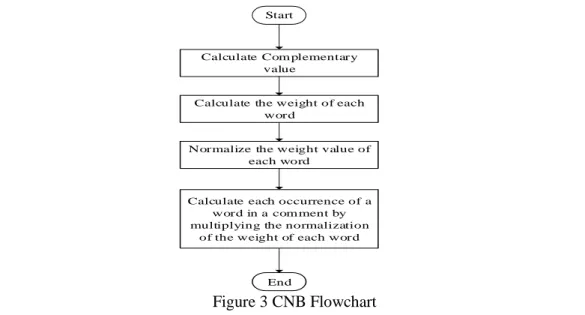
Complementary Naïve Bayes is a development of the Naïve Bayes method. Complementary Naïve Bayes applies class parameters by using data from all classes except the focused class. Whereas the Naïve Bayes method will estimate class parameters using data from a focused class. The CNB flow chart can be seen in Figure 3.
End
Calculate Com plementary value
Calculate each occurrence of a word in a com ment by multiplying the normalization
of the weight of each word Calculate the weight of each
word
Normalize the weight value of each word
Start
Figure 3 CNB Flowchart
(4) Information:
: The probability of the word occurring in a class other than class . : Laplace smoothing parameter for all words.
: Shows the number of of each word that appears. : Word
: Number of words that appear in addition to class . : Number of all words that appear in addition to class .
Laplace smoothing is a way to handle a probability value of 0. Laplace smoothing has a value of 1 by default [9]. Class calculation of weight ( ) for word uses equation (5).
(5)
The log value to handle division with the denominator is more than the numerator value. Weighting is carried out normalization so that it becomes equation (6).
(6) Where is the total overall weight of each word in a class . The equation for labeling the document for the CNB method can be seen in equation (7).
(7) Where is a test document, indicates the number of words . The class with the lowest probability results shows the greatest possibility of an entry document in the class identified.
b. Support Vector Machine
One classification concept the Support Vector Machine is the best hyperplane search that functions as a separator of two data classes in input space. The concept makes the Support Vector Machine minimize the common mistakes because the Support Vector Machine uses flexible representation to determine class margins. The hyperplane as the best separator between the two classes can be found by measuring the margin of the hyperplane and looking for the maximum point. Margin is the distance between the hyperplane and the closest data from each class. The closest data is called support vector. SVM concept can be seen in figure 4.
Figure 4 SVM [11] The hyperplane in SVM is denoted by equation (8).
(8) Where w and b are model parameters, w.x_i is the inner product between w and x_i. If an x_i data is classified as class +1 class then it must fulfill the inequality (9).
(9) While an x_i data is classified as class -1, it must fulfill the inequality (10).
(10) Thus, the margin of the hyperplane can be calculated by subtracting both inequality (9) and inequality (10) so that it becomes equation (11).
(11) Parameter
C
is a parameter that controls the tradeoff between margin and classification errors. The greater the value ofC
, means the penalty for errors is getting bigger, so the training process becomes more stringent.The kernel is a function that maps data features from the initial (low) dimension to new features with higher dimensions. Choosing the right kernel function can determine new features (high dimensions) where the classification function (hyperplane) will be searched. The application of the kernel method does not need to know the mapping function of each data, but it is more important to know that the dot-product of two new feature data can be replaced by kernel functions.
6. Testing Algorithm
The testing process uses a confusion matrix. The total amount of the total data is 2600 with the distribution of training data of 2500 (75%) and test data of 100 (25%). Confusion Matrix classifies binary problems that have two categories of values (0 or 1). Confusion matrix produces accuracy, precision, recall, and f-measure which then becomes a comparison between CNB and SVM.
3. RESULTS AND DISCUSSION 3.1 Results of K-Fold Cross Validation on Complementary Naïve Bayes
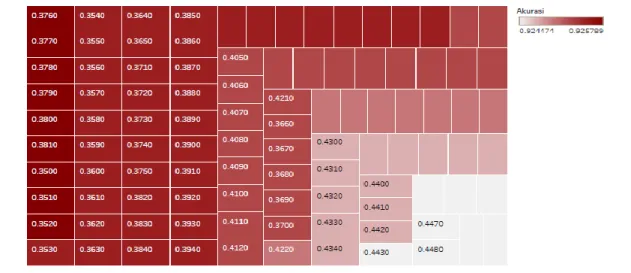
The construction of a validation model using the K-Fold Cross-Validation method with K = 10 is done to find parameters with the best accuracy. The search for Alpha parameters in the Complementary Naïve Bayes (CNB) method was carried out 34 times. The results of the CNB K-Fold Cross-Validation method can be seen in Figure 5.
Figure 5 CNB Parameter
Figure 2 shows that Alpha parameters valued at 0.38 on CNB are one of the parameters with the best accuracy of 93%. It can also be seen with darker colors indicating high accuracy. The study used Alpha parameter value 0.38 to find accuracy in the testing process with the
3.2 Model Testing On Complementary Naive Bayes
Model testing uses confusion matrix to find accuracy, recall, precision, and f-measure. Data distribution for the confusion matrix testing is 100 test data (50 spam and 50 non-spam) and 2500 data comments. The results of the evaluation of the Complementary Naïve Bayes method can be seen in Table 2.
Table 2 CNB Test Results Classification
Algorithm
Alpha Accuracy(%) Precision(%) Recall (%) F-measure (%)
CNB 0.38 92 86 100 93
3.3 Results of K-Fold Cross Validation on Support Vector Machine
As with the Complementary Naïve Bayes validation model test, the Support Vector Machine (SVM) method also experiments with parameter values 81 times. Testing the validation model using K-fold cross validation with K = 10. The SVM kernel used is the RBF kernel so that it uses gamma and C as its parameters. The results of testing the validation model using the K-fold cross-validation SVM method can be seen in Figure 6.
Figure 6 SVM Parameter
Figure 3 shows that the gamma (γ) parameter with a value of 0.5 and C with a value of 1.8 in SVM is a combination of parameters in the range which produces the best accuracy of 93%. Darker colors show the highest accuracy. Research using gamma is worth 0.5 and c is 0.5 for the confusion matrix testing.
3.4 Model Testing On Support Vector Machine
Model testing uses the confusion matrix to look for accuracy, precision, recall, and f-measure. Data distribution for the confusion matrix evaluation is test data as many as 100 comments (50 spam and 50 non-spam) and training data as many as 2500 comments. The results of the SVM method test can be seen in Table 3.
Table 3 SVM Test Results Classification Algorithm gamma C Accuracy (%) Precision (%) Recall (%) F-measure (%) SVM 0.5 1.8 87 79 100 88 3.5 Discussion
Comparison of accuracy results from classification testing using the Complementary Naïve Bayes method and the Support Vector Machine method are shown in Table 4.
Table 4 Comparison between CNB and SVM
Based on validation testing using 10-fold cross-validation which was done 34 times in the CNB process, the parameter with Alpha was 0.38 and the accuracy was 93%. While the SVM process was carried out 81 times, the parameters with C valued at 1.8 and gamma were obtained at 0.5 and an accuracy of 93%. These parameters are parameters that produce the highest accuracy so that they are used in the classification model. Furthermore, confusion matrix calculations are performed with test data as many as 1000 comments (500 spam and 500 non-spam) and training data for 2500 comments. The results of the confusion matrix in the case of imbalanced datasets with the CNB model resulted in an accuracy of 92% and the SVM model produced 87% accuracy. Precision produced by CNB is 86% and SVM is 79%. This shows that the accuracy of the CNB model in identifying spam or non-spam comments is more appropriate than the SVM model. Experiments in the case of balanced datasets with the CNB model produced an accuracy of 93% and the SVM model produced an accuracy of 96%.
4. CONCLUSIONS
Based on the testing of algorithms in the case of imbalanced datasets consisting of 2500 training data and 100 test data, the CNB accuracy was 92% and SVM was 87%. In the case of a balanced dataset consisting of 2500 training data and 100 test data, it was found that the CNB accuracy was 93% and SVM was 96%. The CNB method can detect spam or non-spam comments more precisely in cases of imbalanced datasets than SVM models. While the accuracy of SVM rises when using a balanced dataset. SVM is more suitable for dealing with balanced data.
The suggestion for research on detection of spam comments on Instagram using the Complementary Naïve Bayes (CNB) method is to maximize the text preprocessing process especially in the process of identifying slangwords and data collection processes using crawling techniques.
REFERENCES
[1] D. Frommer, ‘Here’s How To Use Instagram’, Business Insider, 2010. [Online]. Available: http://www.businessinsider.com/instagram-2010-11?IR=T. [Accessed: 04-Apr-2019].
[2] A. Singh and S. Batra, ‘Ensemble based spam detection in social IoT using probabilistic data structures’, Futur. Gener. Comput. Syst., vol. 81, pp. 359–371, 2018.
[3] X. Zheng, Z. Zeng, Z. Chen, Y. Yu, and C. Rong, ‘Detecting Spammers on Social Networks’, Neurocomputing, vol. 159, no. 1, pp. 27–34, 2015.
[4] W. Zhang and H. Sun, ‘Instagram Spam Detection’, IEEE 22nd Pacific Rim Int. Symp. Classification Algorithm Accuracy of 10-Fold Cross Validation (%) Accuracy (%) Precision (%) Recall (%) F-Measure (%) CNB 93 92 86 100 93 SVM 93 87 79 100 88
Kelas pada Klasifikasi di Kelas’, Universitas Gadjah Mada, 2017.
[6] G. Hu, T. Xi, F. Mohammed, and H. Miao, ‘Classification of wine quality with imbalanced data’, Proc. IEEE Int. Conf. Ind. Technol., vol. 2016–May, pp. 1712–1717, 2016.
[7] H. Al Najada and X. Zhu, ‘iSRD : Spam Review Detection with Imbalanced Data Distributions’, no. August 2014, 2015.
[8] A. R. Chrismanto and Y. Lukito, ‘Deteksi Komentar Spam Bahasa Indonesia pada Instagram Menggunakan Naive Bayes’, Ultimatics, vol. IX, no. June, p. 50, 2017. [9] J. D. M. Rennie, L. Shih, J. Teevan, and D. R. Karger, ‘Tackling the Poor Assumptions
of Naive Bayes Text Classifiers’, Proc. Twent. Int. Conf. Mach. Learn., vol. 20, no. 1973, pp. 616–623, 2003.
[10] A. A. Septiandri and O. Wibisobo, ‘Detecting Spam Comments on Indonesia’s Instagram Posts’, Int. Conf. Comput. Appl. Informatics 2016, 2017.
[11] A. Kia and S. Sensoy, ‘Classification of Earthquake-Induced Damage for R / C Slab Column Frames Classification of Earthquake-Induced Damage for R / C Slab Column Frames Using Multiclass SVM and Its Combination with MLP Neural Network’, no. July 2014, 2016.
![Figure 4 SVM [11]](https://thumb-us.123doks.com/thumbv2/123dok_us/9789469.2470703/6.893.178.763.767.1088/figure-svm.webp)