Next Generation Machine Learning
Based Real Time Fraud Detection
Dissertation
Rui Filipe Laranjeira da Costa
up199600952
[email protected]
Supervision: Jo˜ao Pedro Mendes Moreira
Company: WeDo Technologies
Next Generation Machine Learning Based
Real Time Fraud Detection
Rui Filipe Laranjeira da Costa
Master in Informatics and Computing Engineering
Abstract
In telecommunications there are several schemes to defraud the telecommunications companies causing great financial losses. We can considerer three major categories in telecom fraud based on who the fraud-sters are targeting. These categories are: Traffic Pumping Schemes, Defraud Telecom Service Providers, Conducted Over the Telephone. Traffic Pumping Schemes use “access stimulation” techniques to boost traffic to a high cost destination, which then shares the revenue with the fraudster. Defraud Telecom Service Providers are the most complicated, and exploit telecom service providers using SIP trunking, regulatory loopholes, and more. Conducted Over the Telephone, also known as “Phone Fraud”, this category covers all types of general fraud that are perpetrated over the telephone. Telecommunications fraud negatively impacts everyone, including good paying customers. The losses increase the companies operating costs. While tele-com tele-companies take every measure to stop the fraud and reduce their losses, the criminals continue their attacks on companies with perceived weaknesses. The telecom business is facing a serious hazard growing as fast as the industry itself. Communications Fraud Control Association (CFCA) stated that telecom fraud represented nearly $30 billion globally in 2017 [1]. Another problem is to stay on top of the game with effective anti-fraud technologies. The need to ensure a secure and trustable Internet of Things (IoT) network brings the challenge to continuously monitor massive volumes of machine data in streaming. Therefore a different approach is required in the scope of Fraud Detection, where detection engines need to detect risk situations in real time and be able to adapt themselves to evolving behavior patterns. Machine learning based online anomaly detection can support this new approach. For applications involving several data streams, the challenge of detecting anomalies has become harder over time, as data can dynamically evolve in subtle ways following changes in the underlying infrastructure. The goal of this paper is to research existing online anomaly detection algorithms to select a set of candidates in order to test them in Fraud Detection scenarios. Define a real time monitoring architecture that can scale as the network of devices monitored grows. From the research work carried out and the knowledge about the nature of the business, it was possible to develop a clustering methodology over the data streams that allows to detect patterns on entities. The methodology used is based on the concept of micro-cluster, which is a structure that maintains a summary of the patterns detected on entities.
Acknowledgements
I would like to express my very great appreciation to professor Jo˜ao Moreira for all the support and guidance to carry out this work. I would like to offer my special thanks to Carlos Martins, from Wedo Technologies, for all the clarifications and support material provided.I am particularly grateful for the assistance given by Raul Azevedo, from Wedo Technologies.
Rui Filipe Laranjeira da Costa
Contents
List of Figures xi
List of Tables xiii
1 Introduction 1
1.1 Context . . . 2
1.2 Motivation and Goals . . . 2
1.3 Structure of the Dissertation . . . 3
2 Related Work 5 2.1 Clustering For Data Streams . . . 6
2.2 Heterogeneous Euclidean-Overlap Metric (HEOM) . . . 6
2.3 DenStream . . . 7 2.3.1 Fundamental Concepts . . . 7 2.3.2 Fading Function . . . 7 2.3.3 Core Object . . . 8 2.3.4 Density-area . . . 8 2.3.5 Core-micro-cluster . . . 8 2.3.6 Potential c-micro-cluster . . . 8 2.3.7 Outlier micro-cluster . . . 9 2.3.8 DenStream Pseudocode . . . 9
2.3.9 Pattern Learning in Data Streams . . . 10
3 Kafka the Distributed Messaging Platform 11 3.1 Data Structure . . . 12
4 Clustering Process 17 4.1 General Description . . . 17
4.2 Implementation . . . 17
4.3 Experiments . . . 18
5 Conclusion and Future Work 21 5.1 Novelty Detection . . . 21
Bibliography 23
List of Figures
2.1 Representation of c-micro-cluster . . . 8
2.2 The DenStream algorithm. . . 9
3.1 Data Streams Kafka . . . 11
4.1 Fraud events in dataset . . . 18
4.2 Clustering Process Results . . . 19
4.3 Instances read per second . . . 20
4.4 Micro-clusters in buffer . . . 20
List of Tables
3.1 xDrs Attributes . . . 15
Abbreviations
IoT Internet of Things
GSM Mobile Communications
MSC mobile switching center
BSC base station controller
EDRs Event Detail Records
CDRs Charging Detail Records
HEOM Heterogeneous Euclidean-Overlap Metric
UFFT Ultra Fast Forest of Trees
IRSF International Revenue Sharing Fraud
PBX Private Branch Exchange
MINAS Multi-Class Learning Algorithm for data streams
PSTN Public Switched Telephone Network
Chapter 1
2
Introduction
4A telecommunications company has a large volume of data for incoming and outgoing calls. The company wants to detect fraudulent calls in real time so that they can notify customers or shut down service for a
6
specific number. One type of SIM fraud involves multiple calls from the same identity around the same time but in geographically different locations. To detect this type of fraud, the company needs to examine
8
incoming phone records and look for specific patterns—in this case, for calls made around the same time in different countries/regions. Any phone records that fall into this category are written to storage for
10
subsequent analysis. Data analysis is done long after the fraudulent situation occurs. Although it was noted that there was a fraudulent situation nothing was done in real time to prevent fraud, continuing the attacker
12
to perpetuate their fraudulent actions.
One of the most reported scam scenarios is the use of premium rate numbers. These premium rate
14
numbers are usually to a high cost destination. The owner of the number will offer to share the revenue generated from calls to these numbers with anyone who sends them traffic.This means that a fraudster who
16
generates bogus or stimulated traffic to that destination will receive a part of the profit for each completed call. This type of scheme is known as the International Revenue Share Fraud (IRSF).
18
As new and diverse technologies emerge, new techniques also emerge to defraud the telecommuni-cations companies. Large company telecom systems called ”private branch exchanges” (PBX), cellular
20
communications, and virtual private networks are a few examples of some of the new technologies that telecommunications companies have had to protect from fraudsters.
22
For a better understanding of telecommunications fraud, it is necessary to understand how information is exchanged and who are the stakeholders in these communication exchanges [2].
24
In the Global Mobile Communications System (GSM), a cell phone is a portable phone that receives or makes calls through a base station or transmission tower. Radio waves are used to transfer signals to
26
and from the cell phone, Radio base station controller (BSC) controls base stations or cell sites that re-ceive or transmit radio signals, a mobile switching center (MSC) is mostly associated with communications
28
switching function, such as call set-up, release and routing. Example of communication between two mobile devices of different operators: the mobile phone that initially calls is connected to an initial operator BSC
30
which in turn is connected to an MSC of that operator. The MSC provides connection to the Public Switched Telephone Network(PSTN) network that routes the call to the MSC of the final operator, MSC checks which
32
BSC its subscriber is registered in and forwards the call to that BSC which in turn communicates by radio signals with the final mobile device. In all this process, the price to be paid for a service between operators
34
of different networks is based on a prior agreement between operators. The communication between the switches always has a fee to be charged for the transport of the traffic. The more switch you need to make a
36
2 CHAPTER 1. INTRODUCTION
connection, the more expensive the service will be. For a better understanding of telecommunications fraud it is always necessary to analyze the monetary amounts involved in each communication as well as who
38
can benefit from the amounts distributed by the various carriers by which the service is taken. Communica-tions are not always so simple to control because of the various types of traffic. National traffic is between
40
subscribers from the same country, and can be divided into On-Net and Off-Net. On-Net is traffic between subscribers of the same operator, Off-Net is traffic between subscribers of different operators. International
42
Traffic Off-Net is between subscribers of different operators but whoever receives the call is in another country. Roaming is when a user leaves the network in their home country and uses the network in another
44
country to make communications. Fraud in telecommunications can be classified into two dimensions: the technique used and the type of fraud. We must take into account the context in which fraud is carried out.
46
This information is useful for determining the set of attributes for the two dimensions of the model. Enabler Technique is the method or technique of getting access to the goods or service and perpetrating fraud. Fraud
48
Type is the fraud committed to get illegal benefits. Given an inhibiting technique and a type of fraud, we can select in the data structure of an instance a set of attributes with the ability to build a clustering model
50
to detect patterns in the data stream that lead us to conclude that a certain entity is committing fraud. The attributes to be selected can variate according to the inhibiting technique and a type of fraud, so the deep
52
knowledge of how a fraud is perpetuated is fundamental for the construction of the clustering model.
1.1
Context
54This work is in context of WeDo Technologies and is supported by SonaeIM.LAB@FEUP project. WeDo Technologies (www.wedotechnologies.com) is the market leader in Revenue Assurance and Fraud
Manage-56
ment for Telecommunications, developing and providing software products and specialized services glob-ally.
58
With Clients in more than 100 countries, including major references like Orange, Vodafone, BT, Tele-fonica, Verizon, Etisalat, among many others, WeDo Technologies has more than 600 employees,
world-60
wide. The product development unit is based in Braga, Portugal.
1.2
Motivation and Goals
62Anomaly detection in data streams is a heavily studied area of data science and machine learning. Many anomaly detection approaches exist, both supervised (e.g. support vector machines and decision trees) and
64
unsupervised (e.g. clustering), yet the vast majority of anomaly detection methods are for processing data in batches, and unsuitable for real time streaming applications. On the other hand, the detection of fraud is
66
not a topic that is widely addressed in scientific studies, as it comprises knowing the nature of the business in order to be able to detect fraud, however the techniques and methodologies used in anomaly detection
68
in data streams can serve the basis for fraud detection. Streaming applications impose unique constraints and challenges for machine learning models. These applications involve analyzing a continuous sequence
70
of data occurring in real time. In contrast to batch processing, the full dataset is not available. Data streams produce a huge amount of data that introduce new constraints in the design of learning algorithms: limited
72
computational resources in terms of memory, cpu power, and communication bandwidth. Although some batch techniques may work well in certain situations the focus of this paper is on methods for online anomaly
74
detection and the unsupervised approach.
International Revenue Sharing Fraud (IRSF) is the most persistent type of fraud within the telecom
76
industry. It represents around $10 billions annual loss to Telecom providers. Fraudsters often utilize illegal resources to gain access to an operator’s network in order to bring traffic to phone numbers obtained from
1.3. STRUCTURE OF THE DISSERTATION 3 an International Premium Rate Number provider. This is the most challenging fraud to eliminate due to the complexity of the mobile network system and the involvement of multiple operators, it is usually perpetuated
80
by organized groups that use illegal connections to bring a high volume of calls at a high cost ’revenue share’ service numbers, taking advantage on the roaming capabilities of SIM cards.
82
Another scenario of fraud in IRSF has as an inhibitory source the Wangiri scheme, that comes from Japanese, one touch and then hangs up. Criminals use this technique to trick you into calling premium rate
84
numbers. A fraudster will set up a system (for instance using botnets) to dial a large number of random phone numbers. Each calls rings just once, then hangs up, leaving a missed call on the recipients’ phone.
86
Subscribers are tempted to return the call but the call is made for an international premium rate number. In this situation the detection of patterns is fundamental because this type of attack is usually done by an
88
application that makes random calls in a fixed time interval. The search for these patterns can prevent this type of fraud.
90
1.3
Structure of the Dissertation
In addition to the introduction, this dissertation contains 4 more chapters.
92
In chapter 2, the state of art is described.
In chapter 3 is presented Apache Kafka, used in the experiments, and Kafka architecture. Is analyzed
94
the data structure of the xDRs instance in Kafka stream.
In chapter 4 the data flow clustering method is described and the clustering method is presented. The
96
experiments and results are described.
In chapter 5 some conclusions are written about this article and possible future works to be developed
98
Chapter 2
100
Related Work
The focus of the state-of-art was the clustering for evolving data streams with the goal of detecting the
out-102
liers that maybe be considered an anomaly and consequently be placed in fraud scenario. In the analyzed works [3–7] the data stream clustering algorithms are divided into three main approaches: data
summariza-104
tion clustering, online (real-time) clustering, and time-series clustering. For a first approach to the proposed challenge for detecting real-time anomalies in data streams involving mobile communications it was
under-106
stood that the approach of a data stream summarization algorithm would be the most appropriate and the DenStream Algorithm was selected for this first approach.
108
Stream clustering algorithms analyzed:
• StreamKM++: It computes a small weighted sample of the data stream and it uses the k-means++
110
algorithm as a randomized seeding technique to choose the first values for the clusters. To compute the small sample, it employs coreset constructions using a coreset tree for speed up.
112
• CluStream: It maintains statistical information about the data using clusters. These micro-clusters are temporal extensions of cluster feature vectors. The micro-micro-clusters are stored at snapshots
114
in time following a pyramidal pattern. This pattern allows to recall summary statistics from different time horizons.
116
• ClusTree: It is a parameter free algorithm automatically adapting to the speed of the stream and it is capable of detecting concept drift, novelty, and outliers in the stream. It uses a compact and
self-118
adaptive index structure for maintaining stream summaries.
• DenStream: It uses dense micro-clusters (named core-micro-cluster) to summarize clusters. To
main-120
tain and distinguish the potential clusters and outliers, this method presents core-micro-cluster and outlier microcluster structures.
122
• CobWeb: One of the first incremental methods for clustering data. It uses a classification tree. Each node in a classification tree represents a class (concept) and is labeled by a probabilistic concept that
124
summarizes the attribute-value distributions of objects classified under the node.
In all the works found on machine learning in data streams the data structures of the presented instances
126
have only numeric attributes. The attributes of data structures in telecommunications are not always numer-ical, so Heterogeneous Euclidean Overlap Metric (HEOM) [8] will be presented as the metric to calculate
128
the distance between two instances of the data stream.
There are not many works that specifically talk about data stream clustering to detect online anomalies,
130
and those who approach the subject do so in an empirical way, and in the telecommunications context no work was found that addressed this specific topic
132
6 CHAPTER 2. RELATED WORK
2.1
Clustering For Data Streams
Clustering is a very important task on the approach for mining of evolving data streams. Is the task of
134
grouping a set of objects in such a way that objects in the same group (called a cluster) are more similar (in some sense) to each other than to those in other groups (clusters). Clustering methods are widely used in
136
data mining. They are either used to get insight into data distribution or as a preprocessing step for other algorithms. The most common approaches use distance between examples as similarity criteria. The data
138
stream clustering problem is defined as to maintain a continuously consistent good clustering of the sequence observed so far, using a small amount of memory and time. The issues are imposed by the continuous
140
arriving of instances, and the need to analyze them in real time. Beside the limited memory and one-pass constraints, the nature of evolving data streams implies the following requirements for stream clustering:
142
no assumption on the number of clusters, discovery of clusters with arbitrary shape and ability to handle outliers. From the studied algorithms, DenStream was chosen for this first approach.
144
2.2
Heterogeneous Euclidean-Overlap Metric (HEOM)
We need to deal with both continuous and nominal attributes and for that we need to use a heterogeneous
dis-146
tance function that uses different attribute distance functions on different kinds of attributes. One approach that has been used is to use the overlap metric for nominal attributes and normalized Euclidean distance for
148
linear attributes. The function
da(x, y) =
1, if x or is unknown, else
overlap(x, y), if a is nominal, else
rn dif fa(x, y)
defines the distance between two values x and y of a given attribute a, where
150 overlap(x, y) = 0, ifx=y 1, otherwise and rn dif fa(x, y) = |x−y| rangea
The valuerangeais used to normalize the attributes, and is defined as:
152
rangea=maxa−mina
This means that it is possible for a new input vector to have a value outside this range and produce a differ-ence value greater than one. However, such cases are rare, and when they do occur, a large differdiffer-ence may
154
be acceptable anyway. The normalization serves to scale the attribute down to the point where differences are almost always less than one. The overall distance between two (possibly heterogeneous) input vectors x
156
and y is given by the Heterogeneous Euclidean-Overlap Metric functionHEOM(x, y):
HEOM(x, y) = v u u t m X a=1 da(xa, ya)2
This distance function removes the effects of the arbitrary ordering of nominal values, but its overly
simplis-158
tic approach to handling nominal attributes fails to make use of additional information provided by nominal attribute values that can aid in generalization.
2.3. DENSTREAM 7
2.3
DenStream
Density-Based Clustering algorithm is based on the traditional DBSCAN. We can even say that it is an
in-162
cremental DBSCAN adapted to the data streams that aims at the discovery of clusters with arbitrary shape. It is based on micro-clusters to summarize a clusters with arbitrary shape. The online component uses
164
two buffers called potential micro-clusters (p-micro-clusters) and outliers micro-clusters (o-micro-clusters). When a new object can not be allocated in p-micro-clusters, it is stored in o-micro-clusters until it is
pro-166
moted or removed, which in fact characterizes it as a real outlier. Periodically an analysis on the buffers is performed, searching for micro-clusters that should be promoted to p-micro-clusters or removed from
168
the buffers. This analysis depends on input parameters provided by the user. DenStream was used in an early phase of the investigation. However, the algorithm did not produce the desired results for this kind of
170
context..
2.3.1 Fundamental Concepts
172
Cluster partitions on evolving data streams are often computed based on certain time intervals (or windows). There are three well-known window models: landmark window, sliding window and damped window.
174
DenStream use the damped window model, in which the weight of each data point decreases exponen-tially with timetvia a fading function that is described next.
176
2.3.2 Fading Function
In most data stream scenarios, more recent data can reflect the emergence of new trends or changes in data
178
distribution. The study carried out on the nature of the business led us to conclude that the damped window model would be the option to be used. In order to determine whether or not a given micro-cluster should be
180
discarded in order to allow other micro-clusters to be created, the following fading function is used.
f(t) = 2−λ.t
wheretis the time andλ > 0. The exponentially fading function is widely used in temporal applications
182
where it is desirable to gradually discount the history of past behavior. The higher the value ofλ, the lower importance of the historical data compared to more recent data. And the overall weight of the data stream is
184 a constant W =v( t=tc X t=0 2−λ.t) = v 1−2−λ
wheretc(tc → ∞) is the current time, and v denotes the speed of the stream, i.e., the number of points
186
arrived in one unit time. With Kafka streams we do not need to worry about losing an instance, because an instance is only sent after the later one is consumed. This is particularly useful because, due to large CPU
188
usage in a short time or another limited resource, the instance consumption may slow slightly. However, as soon as the feature being used as a bottleneck is released, instances can be retrieved and re-take the normal
190
time window. It is important that, in the configuration of the parameters in the DenStream algorithm, there is some margin in the resources used to allow this type of recoveries. If resources are used to the limit of
192
their capabilities and if a slowdown occurs, the delay time relative to the last input instance is increased, and after a certain time the older instances are discarded by the Zookeeper, making it impossible to consume.
194
Zookeeper is a top-level software developed by Apache that acts as a centralized service and is used to synchronization within Kafka streams.
8 CHAPTER 2. RELATED WORK
2.3.3 Core Object
A core object is defined as an object, in whoseneighborhood the overall weight of data points is at least
198
an integerµ.
2.3.4 Density-area
200
A density area is defined as the union of theneighborhoods of core objects.
2.3.5 Core-micro-cluster
202
A core-micro-cluster, abbr. c-micro-cluster, at time t is defined asCM C(ω, c, r)for a group of close points
pi1, ..., pin with time stampsTi1, ..., Tin. 204 ω= n X j=1 f(t−Tij) ω > µ, is the weight. c= Pn j=1f(t−Tij)pij µ is the center. 206 r= Pn j=1f(t−Tij)dist(pij, c) µ
r≤, is the radius, wheredist(pij;c)denotes the Heterogeneous Euclidean Overlap distance between point pijand the centerc.
208
The weight of c-micro-clusters must be above or equal toµand the radius must be below or equal to. Because of the constraint on radius,Nc, the number of c-micro-clusters is much larger than the number of
210
natural clusters. On the other hand, it is significantly smaller than the number of points in the data stream due to its constraint on weight. Since each point is uniquely assigned to one of the c-micro-clusters,Ncis
212
below or equal to Wµ. When a clustering request arrives, each c-micro-cluster will be labeled to get the final result, as illustrated in Figure 2.1.
Figure 2.1: Representation of c-micro-cluster
214
2.3.6 Potential c-micro-cluster
A potential c-micro-cluster, abbr. p-micro-cluster, at timetfor a group of close pointspi1, ..., pin with time 216 stampsTi1, ..., Tin is defined as{CF1, CF2, ω}. ω= n X j=1 f(t−Tij)
2.3. DENSTREAM 9
ω ≥ βµ, is the weight. β,0 < β ≤ 1, is the parameter to determine the threshold of outlier relative to
218 c-micro-clusters. CF1 = n X j=1 f(t−Tij)pij
is the weighted linear sum of the points.
220 CF2 = n X j=1 f(t−Tij)p 2 ij
is the weighted squared sum of the points.
c= CF 1 ω
is the center of p-micro-cluster.
222 r = v u u u t CF 2 ω − CF 1 ω 2
is the radius of p-micro-cluster, wherer ≤.
2.3.7 Outlier micro-cluster
224
An outlier micro-cluster, abbr. o-micro-cluster, at timetfor a group of close pointspi1, ..., pin with time
stampsTi1, ..., Tin is defined as{CF1, CF2, ω, t0}. The definitions ofCF1, CF2, ω, center and radius are 226
the same as the p-micro-cluster.t0 =Ti1 denotes the creation time of the o-micro-cluster, which is used to determine the life span of the o-micro-cluster. Howeverω < βµ. That is, because the weight is below the
228
threshold of outlier, the micro-cluster corresponds to outliers.
P-micro-clusters and o-micro-clusters can be maintained incrementally.
230
2.3.8 DenStream Pseudocode
10 CHAPTER 2. RELATED WORK
The DenStream method has two phases, an online phase and an offline phase. Their pseudocode is
232
shown in figure 2.2. In the online phase, every time a new point arrives, DenStream first tries to merge it into one of the potential micro-clusters. If this is not possible, it then tries to merge the point with an outlier
234
micro-cluster. If the weight of the outlier micro-cluster has increased enough to be a potential micro-cluster, the micro-cluster is promoted. Otherwise, DenStream starts a new outlier micro-cluster. The offline phase
236
consists of removing the micro-clusters that have not reached a sufficient weight, and performing a batch DBSCAN clustering.
238
2.3.9 Pattern Learning in Data Streams
As the study on the nature of fraud was completed and how it perpetuated, we concluded that the detection of
240
fraud in the data stream could be solved using the search for statistically relevant patterns between instances of the same entity.
242
The problem of finding sequential patterns in static databases had been studied extensively in the past years, however mining sequential patterns in the data streams is still an active field for researchers. Unlike
244
mining static databases, mining data streams poses many new challenges. First, it is unrealistic to keep the entire stream in the main memory or even in a secondary storage area, since a data stream comes
contin-246
uously and the amount of data is unbounded. Second, traditional methods of mining on stored datasets by multiple scans are infeasible, since the streaming data is passed only once. Third, mining streams requires
248
fast, real-time processing in order to keep up with the high data arrival rate and mining results are expected to be available within short response times. In addition, the combinatorial explosion of itemsets exacerbates
250
mining frequent itemsets over streams in terms of both memory consumption and processing efficiency. Upon completion of the implementation of the first approach, it was quickly realized that for this type of
252
instance this approach was totally unrealistic, and from the analysis of the results it was possible to conclude that for quantitative attributes, its value does not represent any kind of weight relative to another instance.
254
We can conclude nothing about the proximity of one instance relative to another by its quantitative values. Nothing can be said for the distance between two consecutive values being closer or further from other
256
nonconsecutive values. Their quantitative attributes should be considered as qualitative attributes. These qualitative characteristics should be considered as discrete variables, i.e. they appear in the data stream with
258
few variations.
The conclusions drawn from the study of data streams led us to conclude that the best approach for
260
Chapter 3
262
Kafka the Distributed Messaging Platform
Distributed messaging platform like Apache Kafka is used as a data streaming pipeline, for real time streams
264
of data. Kafka can collect big data or to do real time analysis or both which is used for program scaling purposes. The streams analyzed in the scope of this project are managed by Apache Kafka. So, it is better
266
to look how is the Apache Kafka architecture and how the flow of data is proceeded. This allow us to better decide which amount of memory, cpu or bandwidth will be necessary to build a model for a fraud scenario.
268
Kafka was first built by the LinkedIn technical team and was used to collect user activity data on their portal. We have to analyze both the logical and physical architecture of Kafka. Every message in Kafka
270
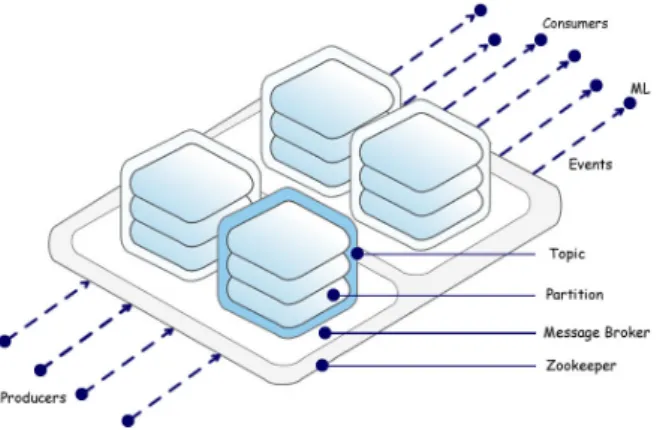
topics is a collection of bytes. This collection is represented as an array. Producers are the applications that store information in Kafka queues. They send messages to Kafka topics that can store all types of messages.
272
Every topic is further differentiated into partitions. Each partition stores messages in the sequence in which they arrive. There are two major operations that producers/consumers can perform in Kafka. Producers
274
append to the end of the write-ahead log files. Consumers fetch messages from these log files belonging to a given topic partition. Physically, each topic is spread over different Kafka brokers, which host one
276
or two partitions of each topic. A Kafka cluster is basically composed of one or more servers (nodes). A
Figure 3.1: Data Streams Kafka
typical Kafka cluster consists of multiple brokers. It helps in load-balancing message reads and writes to
278
the cluster. Each of these brokers is stateless. However, they use Zookeeper to maintain their states. Each topic partition has one of the brokers as a leader and zero or more brokers as followers. The leaders manage
280
12 CHAPTER 3. KAFKA THE DISTRIBUTED MESSAGING PLATFORM
any read or write requests for their respective partitions. Followers replicate the leader in the background without actively interfering with the leader’s working. As illustrated by figure 3.1 this project will work by
282
subscribing an topic in Apache Kafka and doing machine learning over the data stream received. Each event, that can be either making a phone call, or terminating a phone call, it will be used to build our clustering
284
model. Our model will decide if a given event is a valid event or if it is a outlier event as that can be placed in a fraud scenario.
286
3.1
Data Structure
Telecommunication companies have to keep knowledge of every service that is used by his subscriber for
288
the purpose of charging the subscriber for the service provided. All information about the service provided, is grouped together by the MSCs and sent to the billing system through an offline, file based protocol. These
290
records are known as Charging Detail Records (CDRs) or Event Detail Records (EDRs), or the combination of the two, known as xDRs records.
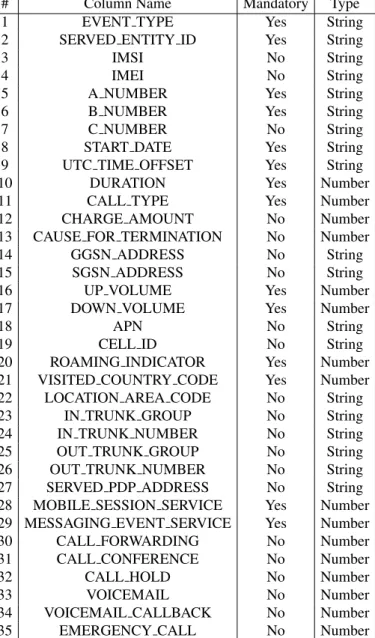
292
In telecommunications, the xDRs data format has the attributes in table 3.1. Each attributes has different values according with service required.
294
• EVENT TYPE - Possible Values MOC - Mobile Originated Call
296
MTC - Mobile Terminated Call SMSMO - SMS Originated
298
SMSMT - SMS Terminated
GPRS - Packet Switch Data Session
300
MSESS - Mobile Session (Voice over LTE) MSG - SMS over IP
302
• SERVED ENTITY ID - Description
The Mobile Subscriber ISDN number. The number from the subscriber who has used the network.
304
• IMSI - Description
International Mobile Subscriber Identity from the subscriber who used the network.
306
• IMEI - Description
The International Mobile Equipment Identity number that identifies the equipment used by the
sub-308
scriber during the event.
• A NUMBER - Description
310
The number from which the call was originated in the case of terminated calls/SMS. The number representation must be in International format, meaning the number must begin with the Country
312
Code.
• B NUMBER - Description
314
The number for which the call was terminated. The number representation must be in International format, meaning the number must begin with the Country Code.
316
• C NUMBER - Description
The number identifying the original calling number in a call forwarding context. The number
repre-318
3.1. DATA STRUCTURE 13
• START DATE - Description
320
Event start time given in the local time.
• UTC TIME OFFSET - Description
322
The difference between local time and UTC time.
• DURATION - Description
324
Event duration in seconds.
• CALL TYPE - Possible Values
326
1 - OnNet (when the call origin/destination is also a operator subscriber) 2 - OffNet (when the call origin/destination is a number their national network)
328
3 - International (when the call origin/destination is an international number)
330
• CHARGE AMOUNT - Description
The charge applied to the event.
332
• CAUSE FOR TERMINATION - Possible Values
0 - normal release
334
3 - unsuccessful call attempt 4 - abnormal release 336 16 - volume limit 17 - time limit 338 • GGSN ADDRESS - Description 340
IP Address from the GGSN used
• SGSN ADDRESS - Description
342
IP Address from the SGSN used
• UP VOLUME - Description
344
Uplink volume (in bytes)
• DOWN VOLUME - Description
346
Downlink volume (in bytes)
• APN - Description
348
Access Point Name
• CELL ID - Description
350
The identity of the cell from where the event is originated or terminated, depending on the event direction.
352
• ROAMING INDICATOR - Possible Values
0 - No Roaming (subscriber using the operator network)
354
1 - Roaming Inbound (roamer in using the operator network) 2 - Roaming Outbound (subscriber using an external network)
14 CHAPTER 3. KAFKA THE DISTRIBUTED MESSAGING PLATFORM
• VISITED COUNTRY CODE - Description
358
Country code from the visited country in a roaming scenario (only for roamers out)
• LOCATION AREA CODE - Description
360
Identification of the Location Area Code of the mobile equipment handling the call
• IN TRUNK GROUP - Description
362
Incoming trunk group where the communication signal was transmitted
• IN TRUNK NUMBER - Description
364
Incoming trunk number where the communication signal was transmitted
• OUT TRUNK GROUP - Description
366
Outgoing trunk group where the communication signal was transmitted
• OUT TRUNK NUMBER - Description
368
Outgoing trunk number where the communication signal was transmitted
• SERVED PDP ADDRESS - Description
370
IP address used in the Packed Data Protocol
• MOBILE SESSION SERVICE - Description
372
The mobile session service refers to the direction of a VoLTE call Possible Values:
374
1 - MO Voice over LTE 2 - MT Voice over LTE
376
• MESSAGING EVENT SERVICE - Description
The messaging event service refers to the direction of a SMS over IP
378
Possible Values:
1 - MO SMS over IP (IMS based SMS)
380
2 - MT SMS over IP (IMS based SMS)
• CALL FORWARDING - Possible Values
382
1 - Call Forwarding 0 - No Call Forwarding
384
• CALL CONFERENCE - Possible Values
1 - Call Conference
386
0 - No Call Conference
• CALL HOLD - Possible Values
388
1 - Call Hold 0 - No Call Hold
390
• VOICEMAIL - Possible Values 1 - Voicemail
392
0 - No Voicemail
• VOICEMAIL CALLBACK - Possible Values
394
1 - Voicemail call back 0 - No Voicemail call back
3.1. DATA STRUCTURE 15
• EMERGENCY CALL - Possible Values
1 - Emergency Call
398
0 - No Emergency Call
# Column Name Mandatory Type
1 EVENT TYPE Yes String
2 SERVED ENTITY ID Yes String
3 IMSI No String
4 IMEI No String
5 A NUMBER Yes String
6 B NUMBER Yes String
7 C NUMBER No String
8 START DATE Yes String
9 UTC TIME OFFSET Yes String
10 DURATION Yes Number
11 CALL TYPE Yes Number
12 CHARGE AMOUNT No Number
13 CAUSE FOR TERMINATION No Number
14 GGSN ADDRESS No String
15 SGSN ADDRESS No String
16 UP VOLUME Yes Number
17 DOWN VOLUME Yes Number
18 APN No String
19 CELL ID No String
20 ROAMING INDICATOR Yes Number
21 VISITED COUNTRY CODE Yes Number
22 LOCATION AREA CODE No String
23 IN TRUNK GROUP No String
24 IN TRUNK NUMBER No String
25 OUT TRUNK GROUP No String
26 OUT TRUNK NUMBER No String
27 SERVED PDP ADDRESS No String
28 MOBILE SESSION SERVICE Yes Number
29 MESSAGING EVENT SERVICE Yes Number
30 CALL FORWARDING No Number
31 CALL CONFERENCE No Number
32 CALL HOLD No Number
33 VOICEMAIL No Number
34 VOICEMAIL CALLBACK No Number
35 EMERGENCY CALL No Number
Chapter 4
400
Clustering Process
4.1
General Description
402
The method implemented is a method of clustering data streams, based on the concept of micro-clusters. Micro-clusters are data structures which summarize a set of entities from the stream, and is composed of a
404
set of statistics which are easily updated and allow fast analysis.
The method has two phases. In the online phase, a set of micro-clusters are kept in main memory;
406
each instance coming from the input stream can then be either appended to an existing micro-cluster or created as a new micro-cluster. Space for the new micro-cluster is created by deleting a micro-cluster (by
408
analyzing its last edit timestamp) using the fading function (subsection 2.3.2) described on Denstream. In the delete process we can either discard the micro-cluster or save the micro-custer, for further analysis, by
410
its density. The offline phase will try to discovery patterns in the micro-cluster, to obtain the final density for the micro-cluster in the clustering process.
412
4.2
Implementation
ClusterProcess is the class that is responsible for reading xDRs instances from the data stream and is the
414
class that control time. It is also the class where the fading process ocurrs. The number of micro-clusters parameter (m), controls how many micro-clusters are kept. Two more classes deal with the implementation
416
of the clustering algorithm: MicroCluster and Clustering.
We can have several notions of time. The unit of time may vary according to our interest and the quantity
418
and quality of the data. We can have the second, minute, or even hour as a unit of time. We can also say that the unit of time is the number of instances that reach the clustering process.
420
MicroCluster is the main data structure keeping the online micro-clusters updated. It has a last edit timestamp, a current timestamp and a density function to calculate the new density of an arrived instance to
422
the micro-cluster. The density function go through all points in the micro-cluster to calculate the number of identified patterns in the micro-cluster for the arrived instance. Based on the identified pattern, sets a new
424
density to the micro-cluster.
The clustering class is responsible to insert or delete micro-clusters from the cluster process.
AutoEx-426
pandVector is a class that implements a vector with the capability of automatic expansion and is used by the Clustering class to keep the online buffer.
428
18 CHAPTER 4. CLUSTERING PROCESS
4.3
Experiments
The Kafka stream was installed in the server. Another machine served as a producer. It reads the dataset
430
and sends it to the server. Another machine has the role of consumer, reading the xDRs instances that come from the producing machine through the server and doing the clustering process.
432
The dataset was provided by the WeDo Technologies company. It is a labeled dataset for which we can draw conclusions about the effectiveness of the method presented.
434
The dataset has 78124 records where there were events identified as prism fraud, smishing attempt fraud, risky destinations fraud, risky destinations fraud roaming, risky destinations cloning fraud, wangiri
436
callback fraud, risky destinations imeisim swap fraud, trafic subscriber fraud, wangiri attempt fraud, prism fraud roaming and smishing callback fraud. 65848 records were considered normal instances.
438
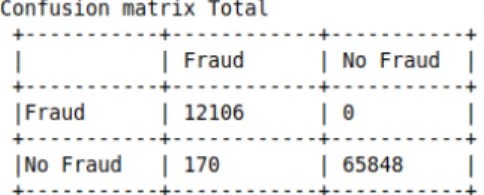
4.3. EXPERIMENTS 19 The clustering process took about 30 seconds to execute and presented the following results.
Figure 4.2: Clustering Process Results
In the rows, we have the forecasts in columns and the actual values. As you can notice we are dealing
440
with unbalanced data. In real problems, when we set up the confusion matrix it is normal to find a greater number of false negatives than false positives.In our case we don’t have false positives.
442
In the case of false positive and false negative problems, one way to work with unbalanced data is to increase the performance of predicting the observations with less quantity.
444
For an instance by itself to be considered fraud it has to be absorbed by a micro-cluster in which patterns have already been found in the data stream.
446
The decrease in observations would cause many micro-clusters to be forgotten more quickly, prevent-ing other instances from beprevent-ing cataloged as fraud and the values on confusion matrix would certainly be
448
20 CHAPTER 4. CLUSTERING PROCESS
The implemented method has 98,6% of success rate, and the statistics are presented in figure 4.2.
450
To be able to get an online sense of the evolution of the method over time, a website was built that received information from the clustering process every second.
452
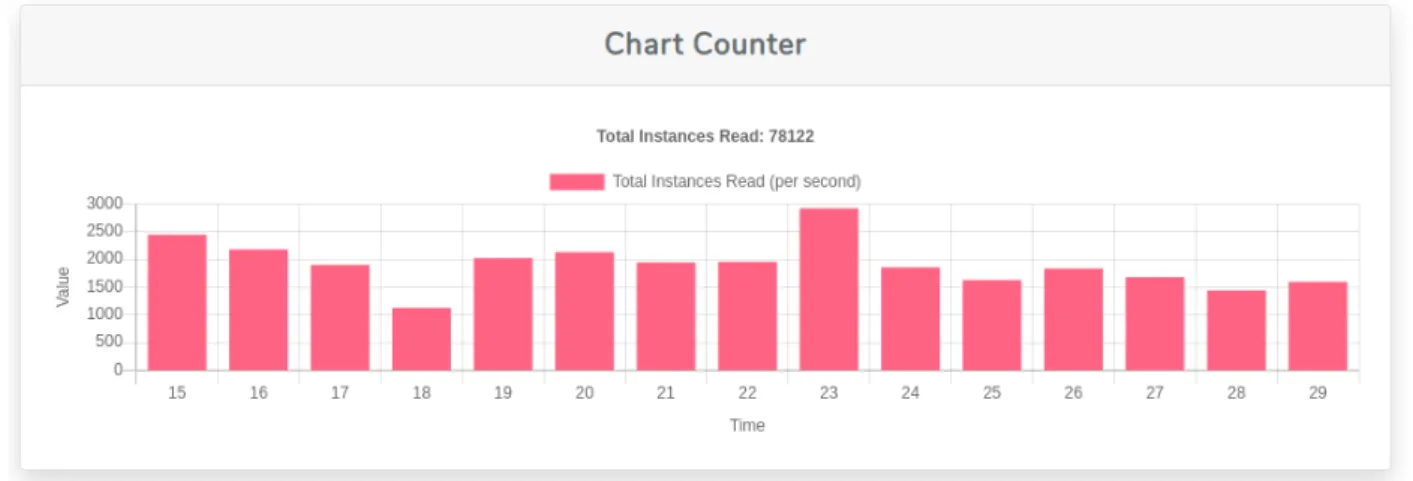
Figure 4.3: Instances read per second
Figure 4.3 shows that the algorithm can read and process 2500 instances per second. The values can be different depending on the processing capacity and the memory available for the clustering process. The
454
processing capacity used in the experiments was nothing special and the results show the effectiveness of the method, even with a low level of processing.
456
Regarding the problem of keeping the instance in memory, we can notice in the chart of Figure 4.4 the performance of the forgetting function that discards lower weight micro-clusters, in order to allow other
458
instances to enter the buffer.
Figure 4.4: Micro-clusters in buffer
We can see in Figure 4.4 the evolution of the clustering process and the number of instances kept in
460
the buffer at each instant of time. It is noticeable that the clustering process can keep the used memory level constant over time, this aspect being the most fundamental for clustering in data streams.
Chapter 5
Conclusion and Future Work
464In order to build a clustering model for real-time fraud detection, it is extremely necessary to have a concrete knowledge of the type of fraud and the source of such fraud, so that the right attributes can be selected for
466
the construction of our model. One model may be good for detecting one type of fraud, but it may not be enough to detect another type of fraud. For each type of fraud and each enabler technique we must have our
468
own model adapted to each situation.
Since Apache Kafka is a distributed system it is possible to have, in real time, several models in
opera-470
tion at the same time. For future work, combining multiple fraud detection models can facilitate knowledge of user behavior and prevent the spread of a fraud scenario more quickly.
472
The final objective of this work will always be the implementation of an algorithm to deal with Novelty Detection, since changes in the data pattern of data streams may lead to faster discovery of new fraud
474
situations. For future work, we intend to improve existing techniques, and lately find new techniques for detecting different novelties in data streams.
476
5.1
Novelty Detection
When new techniques of fraud are implemented, the discovery of these new techniques in data streams can
478
take some time. During this time, telecom companies can have great losses. Novelty detection makes it possible to recognize novel concepts, which may indicate the appearance of a new concept. The method
480
used and the implementation made gives a large margin for detection of new patterns on the data stream. The ability to launch multiple analysis instances over multiple attributes, allows attempts to detect multiple
482
pattern types at the same time. By correlating these instances of analysis at a given point in time, we can easily come up with new patterns in the data stream that, once analyzed, could translate into a new kind
484
of fraud. Through such an approach one can define a new pattern type in data stream. These patterns can be arithmetic or geometric patterns of the evolution of the numeric attribute. This search for these new
486
patterns would initially be for entities for which a certain type of pattern had already been detected and, for the events of that entity, which has not yet detected any type of fraud, they would try to do an analysis
488
to discover arithmetic or geometric patterns of the numeric attribute. If a new pattern was detected, a new analysis instance can be launched, with the aim of detecting that pattern in new instances from the data
490
stream. There are a large number of possibilities for combining the various attributes of the xDRs instances, so there will be many possibilities for detecting arithmetic or geometric patterns on those possibilities.
492
Bibliography
[1] C. F. C. Association, “Telecom fraud loss survey.” https://www.cfca.org/fraud-loss-survey.
494
[2] Q. Zhao, K. Chen, T. Li, Y. Yang, and X. Wang, “Detecting telecommunication fraud by understanding the contents of a call,”Cybersecurity 2018 1:8, 2018. https://doi.org/10.1186/s42400-018-0008-5.
496
[3] A. Bifet, “Adaptive stream mining: Pattern learning and mining from evolving data streams,” vol. 207, 2010.
498
[4] A. Bifet, R. Gavald`a, G. Holmes, and B. Pfahringer,Machine Learning for Data Streams with Practical Examples in MOA. MIT Press, 2018.https://moa.cms.waikato.ac.nz/book/.
500
[5] L. Rettig, M. Khayati, P. Cudr´e-Mauroux, and M. Pi´orkowski, “Online anomaly detection over big data streams,”IEEE International Conference on Big Data (Big Data), 2015.
502
[6] J. Gama, Knowledge Discovery from Data Streams. Chapman & Hall/CRC, 2010. https://dl. acm.org/citation.cfm?id=1855075.
504
[7] M. Chenaghlou, M. Moshtaghi, C. Leckie, and M. Salehi, “Online clustering for evolving data streams with online anomaly detection,”Advances in Knowledge Discovery and Data Mining, 2018.
506
[8] D. R. Wilson and T. R. Martinez, “Improved heterogeneous distance functions,”Journal of Artificial Intelligence Research, pp. 1–34, 1997.
508
[9] F. Cao, M. E. W. Qian, and A. Zhou, “Density-Based Clustering over an Evolving Data Stream with Noise,”In SAC ’04: Proceedings of the 2004 ACM symposium on Applied computing, pages 632–636,
510
New York, NY, USA, 2006.
[10] R. A. A. Habeeba, F. Nasaruddina, A. Ganib, I. A. T. Hashemb, E. Ahmedc, and
512
M. Imrand, “Real-time big data processing for anomaly detection: A survey,” 2018.
https://doi.org/10.1016/j.ijinfomgt.2018.08.006.
514
[11] J. Gama, P. Medas, and R. Rocha, “Forest trees for on-line data,”In SAC ’04: Proceedings of the 2004 ACM symposium on Applied computing, pages 632–636, New York, NY, USA, 2004.
516
[12] E. R. Faria, J. Gama, and A. C. P. L. F. Carvalho, “Novelty detection algorithm for data streams multi-class problems,” SAC ’13 Proceedings of the 28th Annual ACM Symposium on Applied Computing
518
Pages 795-800, 2013.
[13] M. Ester, H.-P. Kriegel, J. Sander, and X. X. A, “density-based algorithm for discovering clusters in
520
large spatial databases with noise,”In Proceedings of the Second International Conference on Knowl-edge Discovery and Data Mining (KDD 96), Portland, Oregon, USA, pages 226–231, 1996.
522
24 BIBLIOGRAPHY
[14] Schulzrinne, Henning, State, Radu, Niccolini, and S. (Eds.), “Principles, Systems and Applications of IP Telecommunications. Services and Security for Next Generation Networks,” Second International
524
Conference, IPTComm 2008, Heidelberg, Germany.Revised Selected Papers, 2008.
[15] J. Gama, R. Sebasti˜ao, and P. P. Rodrigues, “Issues in evaluation of stream learning algorithms,”15th
526
ACM SIGKDD International Conference on Knowledge Discovery and Data Mining, pp. 329–337, 2009.
528
[16] K. Xie, X. Li, X. Wang, J. Cao, G. Xie, J. Wen, D. Zhang, and Z. Qin, “On-line anomaly detection with high accuracy,”IEEE/ACM TRANSACTIONS ON NETWORKING, vol. 26, no. 3, 2018.
530
[17] Y. Mirsky, A. Shabtai, B. Shapira, Y. Elovici, and L. Rokach, “Anomaly detection for smartphone data streams,”Pervasive and Mobile Computing, vol. 35, pp. 83–107, 2017.
532
[18] Yogita and D. Toshniwal, “A framework for outlier detection in evolving data streams by weight-ing attributes in clusterweight-ing,”2nd International Conference on Communication, Computing & Security
534
(ICCCS-2012), 2012.
[19] M. Toyoda, Y. Sakurai, and Y. Ishikawa, “Pattern discovery in data streams under the time warping
536
distance,”The VLDB Journal, vol. 22, pp. 295—-318, 2013.
[20] L. Chena, S. Gao, and X. Cao, “Research on real-time outlier detection over big data streams,”
Inter-538
national Journal of Computers and Applications, 2017.
[21] S. Microsystems, “Xdr: External data representation standard,” International Journal of Computers
540
and Applications, 1987.
[22] H. Sun, K. Deng, F. Meng, and J. Liu, “Matching stream patterns of various lengths and tolerances,”
542
Proceedings of the 18th ACM conference on Information and knowledge management, pp. 1477–1480. [23] A. Bifet, G. Holmes, B. Pfahringer, and R. Gavald`a, “Mining frequent closed graphs on evolving data
544
streams,” Proceedings of the 17th ACM SIGKDD international conference on Knowledge discovery and data mining, p. 591–599.
546
[24] C. C. Aggarwal, Y. Li, P. S. Yu, and R. Jin, “On dense pattern mining in graph streams,”Proceedings of the VLDB Endowment, vol. 3 Issue 1-2, pp. 975–984, 2010.
548
[25] E. R. Faria, R. C. Barros, J. Gama, and A. Carvalho, “Improving the offline clustering stage of data stream algorithms in scenarios with variable number of clusters,” SAC ’12: Proceedings of the 27th
550