Qarni, Muhammad Jawad and Sivaswamy, Giribaskar and Rosochowski,
Andrzej and Boczkal, Sonia (2017) Effect of incremental equal channel
angular pressing (I-ECAP) on the microstructural characteristics and
mechanical behaviour of commercially pure titanium. Materials &
Design, 122. pp. 385-402. ISSN 0264-1275 ,
http://dx.doi.org/10.1016/j.matdes.2017.03.015
This version is available at http://strathprints.strath.ac.uk/60146/
Strathprints
is designed to allow users to access the research output of the University of
Strathclyde. Unless otherwise explicitly stated on the manuscript, Copyright © and Moral Rights
for the papers on this site are retained by the individual authors and/or other copyright owners.
Please check the manuscript for details of any other licences that may have been applied. You
may not engage in further distribution of the material for any profitmaking activities or any
commercial gain. You may freely distribute both the url (
http://strathprints.strath.ac.uk/
) and the
content of this paper for research or private study, educational, or not-for-profit purposes without
prior permission or charge.
Any correspondence concerning this service should be sent to the Strathprints administrator:
[email protected]
The Strathprints institutional repository (http://strathprints.strath.ac.uk) is a digital archive of University of Strathclyde research outputs. It has been developed to disseminate open access research outputs, expose data about those outputs, and enable the
Effect of incremental equal channel angular pressing (I-ECAP) on the
microstructural characteristics and mechanical behaviour of
commercially pure titanium
Muhammad Jawad Qarni
a,⁎
, Giribaskar Sivaswamy
a, Andrzej Rosochowski
b, Sonia Boczkal
caAdvanced Forming Research Centre (AFRC), University of Strathclyde, Inchinnan, Renfrewshire PA4 9LJ, UK b
Design Manufacture and Engineering Management (DMEM), University of Strathclyde, Glasgow G1 1XJ, UK
c
Institute of Non-Ferrous Metals in Gliwice, Light Metals Division, ul. Pilsudskiego 19, 32-050 Skawina, Poland
H I G H L I G H T S
•Commercial purity titanium was proc-essed via incremental equal channel an-gular pressing at 300 °C.
• The grain refinement achieved was in the ultrafine grain size range and CDRX was a dominant mechanism for grain refinement.
• Significant increase in yield and ulti-mate tensile strength was achieved with minimal loss of ductility. •Compression tests at various strain rates
reveal a distinct three-stage strain hard-ening behaviour.
• The processing yielded noticeable in-crease in hardness characteristics.
G R A P H I C A L A B S T R A C T
a b s t r a c t
a r t i c l e
i n f o
Article history:
Received 13 December 2016
Received in revised form 16 February 2017 Accepted 5 March 2017
Available online 8 March 2017
Incremental equal channel angular pressing (I-ECAP) is one of the continuous severe plastic deformation (SPD) processes. This paper presents the processing of commercial purity titanium (CP-Ti) using a double billet variant of I-ECAP process. Ultrafine-grain (UFG) structure was successfully achieved after six passes of I-ECAP at 300 °C. Microstructural evolution and texture development were tracked using EBSD. Analysis revealed continuous dy-namic recrystallization (CDRX) as one of the grain refinement mechanism during processing. Room temperature tensile tests carried out before and after six passes, shows significant increase in strength with acceptable levels of ductility. The yield strength was increased from 308 to 558 MPa and ultimate tensile strength from 549 to 685 MPa. Compression tests conducted at different strain rates shows considerable increase in strength and en-hanced strain rate sensitivity after processing. A distinct three-stage strain hardening was observed during com-pression. However the processed material displayed a loss in strain hardening ability during tensile as well as in compression tests. Detailed microhardness measurements show the evolution of hardness after subsequent passes with a reasonable level of homogeneity after the sixth pass. It is demonstrated that I-ECAP is an effective method for grain refinement in CP-Ti and subsequently improving its mechanical properties.
© 2017 The Authors. Published by Elsevier Ltd. This is an open access article under the CC BY license (http:// creativecommons.org/licenses/by/4.0/).
Keywords:
Commercially pure titanium Ultrafine grains (UFG)
Incremental equal channel angular pressing (I-ECAP)
Electron backscatter diffraction (EBSD) Strain hardening
Microhardness
⁎ Corresponding author.
E-mail address:[email protected](M.J. Qarni).
http://dx.doi.org/10.1016/j.matdes.2017.03.015
0264-1275/© 2017 The Authors. Published by Elsevier Ltd. This is an open access article under the CC BY license (http://creativecommons.org/licenses/by/4.0/). Contents lists available atScienceDirect
Materials and Design
1. Introduction
Owing to its high specific strength, low density, outstanding corro-sion resistance and excellent biocompatibility; titanium is the material of choice in biomedical devices[1,2]. Commercially pure titanium (CP-Ti) is often used in medical implants. However for load bearing joints or total replacement implants, the use of CP-Ti is rather restricted due to its lower strength and therefore Ti-6AL-4V is used instead[3]. Al-though the addition of alloying elements such as Al and V significantly enhance the mechanical characteristics of titanium, these are consid-ered toxic and therefore undesirable for full bio-integration[4]. An at-tractive alternative is to improve the mechanical properties of CP-Ti via nano-structuring or grain refinement and therefore the use of these harmful alloying elements can be eliminated altogether. Strength-ening of metals via grain refinement has been demonstrated by numer-ous studies[5,6]. Especially in CP-Ti, after attaining ultrafine grain structure (UFG, grain size less than ~1μm with high angle grain
bound-aries), not only improves its yield and tensile strength but also improves the fatigue and corrosion resistance considerably[7,8].
Severe plastic deformation (SPD) is a well-established processing technique for introducing extreme grain refinement and obtaining UFG structure in metals, thereby significantly improving their mechan-ical properties[9,10]. The process involves imparting large plastic strain in material, without significantly changing the sample dimensions. Sev-eral SPD techniques have been developed to date, such as: equal chan-nel angular pressing (ECAP)[11,12], high pressure torsion (HPT)[13], accumulative roll bonding (ARB)[14]etc. All of which have been suc-cessfully applied to obtain UFG structure in metals. Among the various techniques available, ECAP is by far the most well studied and widely used technique capable of producing bulk UFG material, large enough for practical applications[15]. Developed by Segal et al.[16], the tech-nique involves passing a billet through a die that consists of two chan-nels with equal cross-sections, intersecting at an angle (Φ) and with an optional outer corner angle (ψ), subtended by the curvature at the outer point of intersection between the two channels. As the billet passes through the intersection, it is subjected to simple shear, while retaining the original cross-sectional area. The billet is normally passed multiple times through the die, in order to impart desired level of plastic strain. The equivalent strain imparted after‘N’number of ECAP passes, can be calculated from Eq.(1) [17].
εeq¼ N ffiffiffi 3 p 2cot ϕþψ 2 þψcosec ϕþψ 2 ð1Þ
Before the subsequent ECAP pass, the billet is usually rotated along its longitudinal axis, creating different ECAP routes[18,19]. There are four different types of routes; Route A in which the billet is processed repetitively without any rotation, (ii) route BAin which the billet
mate-rial is rotated by 90° clock wise and counter clock wise alternatively between consecutive passes (iii) route BCin which the billet material
is rotated by 90° in the same direction between consecutive passes and (iv) route C in which the billet material is rotated by 180° between passes. The distinction between these routes is important, as each route has a different shearing characteristic and therefore each route intro-duces different shearing pattern which subsequently effects the grain refinement mechanism[20].
Titanium has a hexagonal closed packed (HCP) structure at room temperature and therefore it has a limited number of active dislocation slip systems. This makes it very hard to deform at room temperature as it is susceptible to cracking or failure during processing. To improve the formability of titanium and other such hard to deform materials, ECAP processing is normally carried out at elevated temperature. One of the earliest attempts to establish the workability characteristics of CP-Ti duringfirst pass of ECAP, recommended to use lower processing speed (up to 2.5 mm/s) and higher deformation temperature (between
275 and 325 °C) to avoid failure and segmentation in the processed bil-lets[21].
Several investigations have been performed to refine the grain struc-ture of CP-Ti grade 1 to 4, with the objective of improving the strength characteristics[22–27]. It was established from the data that after multiple passes of ECAP at different die angles (Φ), pressing speeds and temperature conditions, the grain size refinement achieved was in the region of 0.20 to 0.70μm, with the increase in yield and
tensile strength between 1.2 and 2.0 times the original strength. In order to achieve even higher grain refinement, some post deformation have also been applied after ECAP processing. For example Stolyarov et al. [28,29] performed post deformation steps such as cold rolling and cold extrusion on CP-Ti. This yielded significant increase in grain size refinement level through the introduction of more disloca-tions, this subsequently increased the strength characteristics even fur-ther. However, these post deformation steps change the sample dimensions and therefore imposes a limit on the potential usage of ma-terial processed. Recently Zhao et al.[30,31]have made successful at-tempts to process titanium at room temperature to suppress grain growth at higher processing temperature, however these attempts were limited to grade 1 which is considered to be the softest and has the highest formality among commercially available grades of titanium. Using die angles (Φ) of 120° and 90°, it was reported that the grain size reduction achieved at room temperature was between 0.15 and 0.20μm
and the increase in ultimate tensile strength was between 765 and 790 MPa.
From the viewpoint of commercializing UFG materials, recently the interest has been focusing on the continuous SPD methods capable of refining very long or continuous billets. Several techniques have been proposed to transform ECAP into continuous process; such as ECAP conform (ECAP-C) [32], ECAP rolling (ECAR) [33], coshearing[34]and continuous frictional angular extrusion (CFAE) [35]. One such relatively new technique is known as incremental ECAP (I-ECAP), which is capable of processing very long billets.
The purpose of the study is to demonstrate the feasibility of the I-ECAP process for refining the grain structure in CP-Ti with the objective of improving its strength characteristics. The paper includes detailed description about the process and about the experimental setup. CP-Ti grade 2 was subjected to six passes of I-ECAP process at 300 °C. EBSD based inverse polefigure (IPF) maps and pole figures were used to track the grain refinement and deformation characteristics during processing. Tensile tests were performed on samples from subsequent passes, to observe the changes in strength and ductility. Fractography of the tensile samples was performed to investigate the fracture morphology. Compression tests were also performed at various strain rates on unprocessed and severely deformed material to observe theflow stress behaviour in compression and also to evaluate the strain rate sensitivity. Finally, detailed microhard-ness study was carried out to understand the hardmicrohard-ness evolution and to examine the homogeneity of strain distribution during I-ECAP processing.
2. I-ECAP process
In I-ECAP process, the material pressing stage is separated from the deformation stage, as opposed to conventional ECAP where the material pressing and deformation takes place simultaneously. Developed by Rosochowski and Olejnik[36], the process is capable of processing very long or even continuous billets, a distinct advantage over the con-ventional ECAP. Separating the pressing and deformation stages also fa-cilitate the material flow and reduces pressing force. Thereby, substantially reducing the energy required to carry out the process. I-ECAP can be used for refining grain structures in long bars[37], plates [38]and sheets[39], which makes it an attractive option for industrial implementation.
2.1. Double billet I-ECAP process
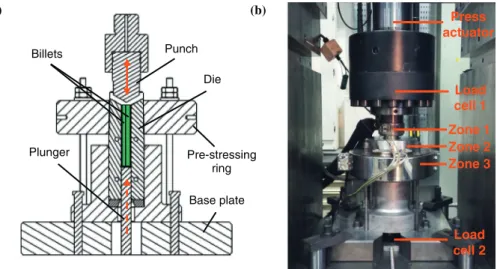
In the present study, the double-billet variant of the I-ECAP process, with a channel intersection angle (Φ) of 120° was used. The schematic illustration of the process is shown inFig. 1(a). As the name suggests, the advantage of this variant over the conventional ECAP procedure (other than capability to process longer billets) is that, it can process a two billets simultaneously and therefore has twice the productivity.
There are three main tools; die, plunger and punch denoted by A, B and C respectively inFig. 1(a). During the process, the two billets are pushed in an incremental manner by the plunger tool equal to the dis-tance‘a’(shown inFig. 1(a)) also known as the pressing stroke; where-as the punch is oscillating at a certain frequency and amplitude. This effectively separates the pressing and the deformation stages. The blue colour outline of the billets inFig. 1(a) represents the pressing stage whereas the red colour represents the deformation stage with the dashed outline representing the plastically deformed zone. The mode
of deformation is similar to that in classical ECAP process i.e. simple shear, provided the pressing stroke‘a’is not too large. The oscillatory movement of the punch and the incremental movement of the plunger are plotted inFig. 1(b) for thefirst three cycles of the I-ECAP process rel-ative to each other.Fig. 1(c) defines the representative three orthogonal planes; X, Y and Z with respect to the processed billet. Where X is the cross-sectional or transverse plane perpendicular to the longitudinal axis of the billet and Y and Z plane are theflow and longitudinal planes parallel to the side face and the top face of the billet at the point of exit from the die, respectively[20].
2.2. I-ECAP experimental rig
There are four main elements of the I-ECAP experimental rig; (1) the I-ECAP die, (2) the heating system, (3) the mechanism and (4) the pro-cess control system.
Fig. 1.(a) Schematic illustration of double-billet variant of I-ECAP process (A = Die, B = Plunger and C = Punch), (b) Relative movement of punch and plunger tools during the I-ECAP process and (c) directions of the three orthogonal planes with respect to the billet (FD, ND and TD refers toflow, normal and transverse direction respectively).
(a)
(b)
Billets Plunger Punch Pre-stressing ring Die Base plateZone 3
Zone 2
Zone 1
Load
cell 1
Load
cell 2
Press
actuator
2.2.1. I-ECAP die
The tool design of the I-ECAP die is shown inFig. 2(a), it is comprised of four die inserts assembled together to form the input channel with a stressing ring around the die sub-assembly. The purpose of the pre-stressing ring is to apply high compressive stress in the radial direction and to minimize the tangential stress generated in the die during pro-cessing. The punch, die inserts and plunger are all made with a high speed steel alloy heat treated to achieve 60 HRC.
2.2.2. Heating system
In order to avoid cracking and segmentation during processing spe-cially for difficult to deform materials like titanium, the process has to be carried out at elevated temperature. I-ECAP rig consists of three zones of heating as shown inFig. 2(b). Zone 1 is a heater band attached to the punch holder with a capacity of 600 W, Zone 2 is a split type aluminum heating blockfitted with sixfire-rod heaters of 250 W each andfinally Zone 3 is a large band heater attached to the pre-stressing ring with a capacity of 3000 W. There is a K-Type thermocouple close to the defor-mation zone which is used to monitor and maintain the processing tem-perature within an accuracy of ±2.0 °C during I-ECAP processing.
2.2.3. Mechanism
The I-ECAP process is carried out on a customized 1000 KN servo-hydraulic press (seeFig. 2(b)) which is controlled by Zwick's Cube con-troller via Cubus software. In order to realize the I-ECAP mechanism, the punch is coupled to the press actuator and follows a sine wave (oscilla-tory movements). The plunger tool is connected to a screw jack which is driven by a servo-motor. There are two load cells, one located above the punch (load cell 1 inFig. 2(b)) and the other below the plunger tool (load cell 2 inFig. 2(b)) to monitor the deformation and pressing forces respectively during processing.
2.2.4. Process control system
To control the pressing of billets and to acquire experimental data during the process, a dedicated LabVIEW virtual instrument application was developed.Fig. 3(a) shows the national instrumentation chassis and I/O modules which are used to acquire and send signals during ex-periments.Fig. 3(b) shows the front screen of this application along with the description of the various controls and display charts. The number on each display chart corresponds to the respective module to which it is connected. The application monitors punch oscillations and based on its position, synchronizes the plunger incremental movements in real time. The billet pressing is accomplished by sending start and stop motion command to the servo motor which drives the screw jack and thereby moving the plunger tool. The application also acquires the pressing as well as deformation forces during processing and records in an Excelfile format for post processing purposes.
3. Material and method
3.1. Material
The as received material used in the present study was commercial purity titanium, grade 2 (here after referred to as CP-Ti) in the form of a 12.5 mm thick hot rolled plate from Dynamic Metals Ltd (UK). The chemical composition of this material is shown inTable 1.
3.2. Billet preparation
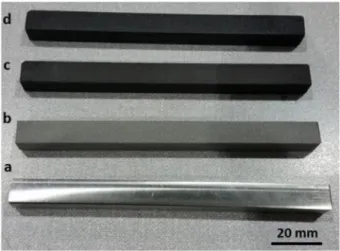
Square cross-section billets measuring a = b = 10 mm and c = 120 mm length (a, b and c are indicated inFig. 1(c)) were cut using wire electric discharge machining (EDM) such that the length (c) of the billet was parallel to the rolling direction of the plate. A small 1 mm chamfer was machined at the top edge of the billet, to facilitate theflow of material during the initial stage of processing. As titanium is very susceptible to galling on the die walls, therefore it was necessary to perform some steps related to billet preparation prior to I-ECAP ex-periments. These steps include sandblasting of billets, spray coating a thin layer of lubricant (70% graphite mixed with 30% water) on the bil-lets, drying in the oven at 100 °C andfinally applying a thin coating of anti-seize lubricant Loctite 8009 from Henkel Ltd. This method of billet preparation and lubrication was the most effective to avoid any billet seizing during operation. The appearance of billet after different prepa-ratory steps is shown inFig. 4.
3.3. Experimental procedure
Before starting the I-ECAP experiments, the pair of lubricated billets was left inside the die pre-heated to 300 °C for 15 min, in order to achieve homogenous temperature within the billets. Experiments were performed using a feed rate of 0.2 mm/cycle (0.1 mm/s), punch oscillatory movement of 0.5 Hz with a peak to peak amplitude of 1.6 mm. The die configuration lead to an imposed strain of ~ 0.67 per pass through the I-ECAP die. The billets were processed repeatedly and were subjected to a total of six passes giving a maximum strain of ~ 4.02. Processing route BCwas followed in which the billet is rotated
by 90° about its longitudinal axis in the same direction after each pass.
Fig. 3.(a) National instruments chassis along with the four I/O modules for data acquisition and (b) front screen of the LabVIEW virtual instrument application used to monitor, control and acquire data during the I-ECAP experiments (the numbering on the chart corresponds to the respective I/O module to which it is connected).
Table 1
Chemical composition of as received CP-Ti grade 2 material used in this study.
Element C N O H Fe Ti
Route BCis considered to be the most effective in achieving
homoge-nous microstructure in which grains are separated by high angle bound-aries[17]. Compared to other routes, route BCin Ti yieldsfiner equiaxed
grains, produces better surface quality billets[40]and also superior cor-rosion resistance[41]. Following each pass, in order to suppress grain growth, the billets were quenched in cold water and taken to room tem-perature quickly.
3.4. Mechanical testing and microstructure characterization
Tensile tests were carried out following the ASTM E8 standard, to evaluate the strength and ductility of the material in the unprocessed condition (0P) and afterfirst (1P), second (2P), fourth (4P) and sixth (6P) passes of the I-ECAP. For this purpose,flat tensile sample with a 14 mm gauge length, 3 × 2 mm2cross-section (seeFig. 5(a) for detailed
dimensions), were cut parallel to longitudinal axis (Y plane) of the proc-essed billet using 0.5 mm wire EDM. A set of three samples were cut from each billet across the width (w). To avoid the effect of any surface defect, the samples were cut 1 mm away from the side faces (seeFig. 5 (b) for illustration). All tests were performed at room temperature, at a constant strain rate (ε_) of 0.01 s−1and taken up to fracture using the
Zwick/Roell Z150 test machine with testXpert control software. The load-displacement data from each test was converted into true stress-strain curve. For each material condition, three separate tests were per-formed to ensure repeatability and thefinal stress-strain curve for each condition represents the average of the three tests. Following the tensile testing, fracture surface of the samples was examined to study the frac-ture morphology, using the FEI's Quanta FEG 250 scanning electron mi-croscope (SEM), operating at 20 kV and with secondary electron (SE) mode.
In order to study the effect of I-ECAP processing on the compression behaviour of CP-Ti, uniaxial compression tests were performed on the
unprocessed condition and after six passes. Cylindrical samples measur-ing diameter (ø) = 8 mm and height (h) = 8 mm were machined, such that the axis of each sample was along the longitudinal axis of billet. To minimize the barrelling of samples and to reduce the effect of friction during the test, the top and bottom surface of the samples were coated with molybdenum-disulphide (MoS2) and the punch surfaces were
coated with a thin layer of boron nitride. Using the Zwick HA250 hy-draulic machine with a 250 KN load cell, the samples were deformed to achieve 50% height reduction. The tests were performed at 0.01, 0.1 and 1.0 s−1to evaluate the strain rate sensitivity.
Electron back scatter diffraction (EBSD) was used to characterize the microstructure in the unprocessed condition and after subsequent passes of I-ECAP. For characterization purposes, slice of material was cut from the middle of billet to avoid end effects. The surface of the sam-ple was polished using standard mechanical polishing techniques and was then ion milled on Leica RES101 as afinal step. The SEM used was a FEI Inspect F50 with an EDAX TSL EBSD detector. The sample was tilted 70° from the horizontal for EBSD data collection, at a 20 kV accelerating voltage and 200 mA beam current. A step size of 0.40μm was used for
the unprocessed material and 80 nm for the sixth pass processed mate-rial. Analysis of the EBSD data was performed using TSL OIM software.
Finally, hardness measurements were performed to investigate the evolution of hardness and to examine the homogeneity of strain distri-bution during I-ECAP processing. Samples measuring 10 mm in thick-ness, were cut from the centre of the unprocessed billet and fromfirst, second, fourth and sixth pass billets across the transverse (X) plane. Each sample was then mounted and polished to a mirror-likefinish using 600, 1200, 2500 and 4000 grit SiC papers. Vicker micro-hardness (Hv) measurements were taken on the surface of each sample using Zwick ZHVμmicro hardness tester equipped with Vickers indenter.
For each measurement, a load of 1000 gf was applied for a dwell time of 10 s. The measurements were taken on a 2D grid style pattern of 11 × 11 equi-spaced points (as shown inFig. 5(c)) along TD and ND di-rections respectively, after leaving a gap of 0.5 mm from all four sides walls. This resulted in a total of 122 measurement points across the sample surface. A detailed contour map was subsequently generated representing the hardness distribution profile for each sample condition.
4. Results and discussion
4.1. Appearance of billets
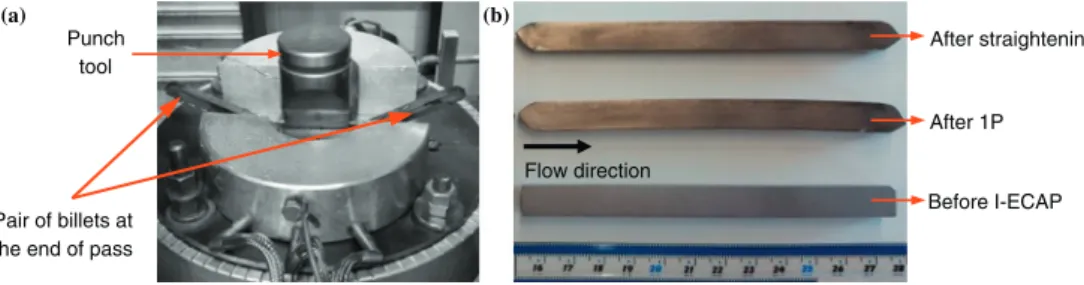
InFig. 6(a) the pair of CP-Ti billets can be seen emerging out of the I-ECAP die at the end of thefirst pass. The process uniformly deformed billets and the macroscopic appearance of the processed billets was smooth with no signs of defects or surface cracks. The processed billets however exhibited slight bowing, which prevented the pair of billet to be re-inserted in the inlet channel for next pass. Therefore, a secondary straightening operation was performed by pressing the pair of billets on a 5000 KN hydraulic press between twoflat dies heated at 200 °C. The Fig. 6(b) shows the appearance of the billets at different stages: unpro-cessed billet before I-ECAP (bottom), after I-ECAP (middle) and after straightening operation (top).
Fig. 4.Billet appearance after different steps of billet preparation (a) 1st step–initial machined billet, (b) 2nd step–sand blasted billet, (c) 3rd step–graphite coated billet and (d) 4th step–anti-seize lubricant applied.
Fig. 5.(a) Dimensions of theflat tensile sample used in this study, (b) illustration of the three tensile samples cut across the cross-section (X-plane) of the billet and (c) 2D grid style pattern of 11 × 11 equi-spaced points on the surface of the sample used for microhardness measurement study.
4.2. Loads during processing
Fig. 7(a–f) represent the graphs showing recorded forces on punch and plunger tool, also known as deformation and pressing forces re-spectively; during the (a) first, (b) second, (c) third, (d) fourth, (e)fifth and (f) sixth pass of I-ECAP. The Y-axis of the graphs represents force in KN and X-axis represents the stroke length. Note that the overall stroke is 10 mm less than the actual billet length, this is to preventfl at-tening of the tail. For better visualization, the recorded data was sam-pled and is presented such that, the forces only represent every 25th cycle during each pass. Due to the cyclic nature of the I-ECAP process,
both the deformation and pressing forces rises to a peak value and then falls to lower value. During the initial stage of processing the defor-mation force in all passes can be seen to increase up to a certain stroke length, beyond which it becomes somewhat uniform. This stage of force increase is mainly due to the gradual increase in the contact area be-tween the oscillating punch and the billet top surface (parallel to Z plane). Once there is full contact between the punch surface and billet surface, the force becomes uniform. Moreover, the deformation force is also seen to increase after subsequent passes. As shown inFig. 8(a), the maximum values of force required to deform the pair of billets, pro-gressively increased from 68.8 KN during thefirst pass to 92.5 KN in the
(a) (b)
Pair of billets at the end of pass
Flow direction Before I-ECAP After 1P After straightening Punch tool
Fig. 6.(a) The pair of CP-Ti billets can be seen emerging out at the end offirst I-ECAP pass, (b) Appearance of the CP-Ti billets, unprocessed billet (bottom), billet afterfirst pass of I-ECAP process showing bowing (middle) and straightened billet after secondary operation (top).
sixth pass. This strongly suggests that the strength of billets is increasing after each pass and therefore greater force is required to deform the billets.
InFig. 7(a–f), the peak values of pressing force during any cycle rep-resent the force required to support the billets during deformation stages. This is illustrated in theFig. 8(b), the red arrows indicate force applied by punch C to deform the pair of billets, this load is counter bal-anced not only by the die A (shown as green arrows) but also by the plunger B (shown as blue arrows). The actual force required to push the pair of billets during the pressing stage is between 1–3 KN (indicat-ed by arrows inFig. 7(a)), so small that it is hardly visible in the graphs. Studies[42,43]have shown that the contact friction during ECAP plays a critical role with respect to homogenous deformation and good surface quality in billet. It is desirable to reduce the contact friction during processing to facilitate optimum processing conditions. However in classical ECAP, it is challenging to provide low friction especially along the bottom wall of the exit channel due to high contact pressure and lu-bricant removal during processing[42]. The load on plunger is mainly dependent on the material shearflow stress, die configuration, billet shape and friction. When a single lubricated billet is processed through afixed ECAP die, contact friction is present on almost all surfaces of the billet during processing. This contact area increases with increase in bil-let length. Therefore, the force required to carry out ECAP process not only increases when processing higher strength materials but also in-creases when the billet length is increased. Consequently, in order to prevent the load on plunger not to exceed beyond its yield strength, the billet length to width (c/a) ratio is normally limited to 6–10. Thereby
limiting the capability of ECAP to process longer billets. I-ECAP method was developed to eliminate this limitation of ECAP. As demonstrated by Fig. 7(a–f), the actual pressing force required to carry out the process is very small. Thus I-ECAP enables processing of very long or continuous billets.
4.3. Microstructure observations
To understand the level of grain refinement and the deformation characteristics during I-ECAP process, the microstructure and the tex-ture of the CP-Ti before and after subsequent I-ECAP processing was analysed using SEM based EBSD technique.Fig. 9shows the coloured in-verse polefigure (IPF) map of the unprocessed (0P) material. The RGB colour code: red for {0 0 0 1}, green for {2 1 1 0} and blue for {1 0 1 0} as shown in the standard stereographic triangle; corresponds to the crystallographic orientation of each grain. The colour variations within the grains qualitatively represent difference in internal misorientations. Fig. 9also shows the texture represented by the (0 0 0 1) polefigure which was recorded at the same measurement location as the IPF map. The microstructure of the unprocessed material inFig. 9shows the presence of grains which are predominantly equi-axed in morphology. Some small grains are observed within the matrix of pre-existing grains and a few of them are also seen around the boundaries of large grains. Many grains are showing minor misorientation difference within the grain interiors as well. The average grain size was 22μm obtained
from the grain size analysis. The estimated texture shows that the
Fig. 8.(a) Values of maximum deformation and pressing forces during different passes of I-ECAP and (b) illustration of load distribution during the deformation stage. (For interpretation of the references to color in thisfigure, the reader is referred to the web version of this article.)
Fig. 9.Inverse polefigure (IPF) maps obtained from EBSD analysis showing the microstructure of unprocessed CP-Ti samples (colour coding is shown in the standard stereographic triangle) and the corresponding (0 0 0 1) polefigure. (For interpretation of the references to color in thisfigure legend, the reader is referred to the web version of this article.)
basal plane of the grains are preferentially oriented parallel to the rolling direction. As a result, a ring texture forms in the polefigure in which the intensity of the basal pole densities are distributed 360° non-uniformly at the periphery of the polefigure.
Figs. 10 to 13, shows the IPF maps representing the post deformation microstructural characteristics along the transverse (X) plane of the samples afterfirst, second, fourth and sixth pass of I-ECAP process, re-spectively. Thefigures also include the corresponding inverse polefi g-ures, polefigures along (0 0 0 1) plane and grain size histogram with beta density distribution function. The texture represented by the pole figures were recorded on the samples at the same measurement areas as used for the IPF maps. It is also important to emphasize that the sam-ples for EBSD analysis were taken from the centre region of the proc-essed billets to avoid any end effects and surface defects due to friction. The IPF map of the sample subjected tofirst pass of I-ECAP, given in Fig. 10shows grain refinement in action. Evidence of which is seen by the formation offine grains which are seen in small clusters at various regions (marked by white circles) within the scanned area. Thefine grains are also observed along the boundaries of large grains, forming a so-called necklace structure. Thesefine grains (below 2μm) comprise
of ~20% of the scanned area fraction. The average grain size based on the
grain size histogram afterfirst pass is 6.56μm, a refinement of ~ 70%
compared to the unprocessed material. Notice that there is no tilt in the metalflow, this is a characteristic feature of the shearing process along transverse (X) plane duringfirst pass of ECAP, as illustrated in Table 2by Furukawa et al.[19]. In general, the microstructure consists of mostly equi-axed large andfine grains. However, there is some pres-ence of elongated grains in the microstructure as well. Moreover, evi-dence of some twin formation is also seen in the microstructure, as indicated by black arrows. Titanium has a HCP crystal structure and therefore compared to FCC and BCC, it is expected to behave differently under shear deformation. In cubic metals, deformation is predominately by slip whereas in titanium which has a limited number of slip systems, twinning always play a critical role in the plastic deformation[44]. Sev-eral studies have confirmed presence of twinning during ECAP of CP-Ti, it was reported that twinning plays a key role as a mechanism of grain refinement[45,46]. After thefirst pass, the microstructure can therefore be regarded as highly heterogeneous (anisotropic), because it consists of a mixture of large grains,fine grains and twins after thefirst pass pro-cessing. This heterogeneity in the microstructure afterfirst pass pro-cessing in CP-Ti is consistent with other similar studies[45,47]. The polefigure shows that texture intensity has increased from 4.85 to
(0 0 0 1) 0 1 2 3 4 5 6 7 8 9 10 11 12 13 14 15 16 17 18 19 20 0.00 0.05 0.10 0.15 0.20 0.25 Area fraction Grain size, µm Avg. GS = 6.56 µm 1P I-ECAP (CP-Ti) Φ=120°, 300° C, BC TD ND
Fig. 10.EBSD based IPF map afterfirst pass of I-ECAP process along with the associated inverse polefigure and the (0 0 0 1) polefigure. Thefigure also shows grain size histogram.
6.26. This is also supported with the inverse polefigure, which reveals that most of the grains have an orientation towards the 2 1 1 0. The in-verse polefigure also shows evidence for the development offibre tex-ture {2 1 1 0}⟨10 1 0⟩between the positions 1 0 1 0 and 2 1 1 0.
Fig. 11represents the microstructure and the texture after second pass of I-ECAP. It is evident that significant grain refinement has taken place and the average grain size is down to 3.59μm. The majority of
the grains are nowfine and equi-axed in morphology. The grain refi ne-ment has contributed in the reduction in twin fraction, compared to the first pass. It is widely reported that the twinning activity in titanium is strongly dependent on the grain size, it decreases with reduction in grain size[48]. Overall, the heterogeneity of the microstructure has been reduced considerably. The grain size histogram also shows that the bars have moved to the left side i.e. towards the smaller grain size values. Moreover, the metalflow is seen at a tilt (shown by the direction of arrows) consistent to second pass ECAP processing along transverse (X) plane via route BC. Increase in the intensity values associated with
pole and inverse polefigures confirmed further strengthening of texture compared tofirst pass.
The IPF map inFig. 12represents the microstructural state after fourth pass, which is remarkably different from thefirst pass processing.
Further grain refinement has taken place and some large grains seen in the second pass has been broken intofiner grains. The microstructure is homogenous and is dominated by thesefine equi-axed grains with ~85% of the grains below 4μm size. Polefigures and inverse polefigures
after fourth pass show significant increase in the texture strength. How-ever, thefibre texture {2 1 1 0}⟨10 1 0⟩is still between the positions 1 0 1 0 and 2 1 1 0.
The EBSD map of the sample after sixth pass inFig. 13shows ex-traordinary level of grain refinement. More than 80% of the grains shown in the scanned area are below submicron range. The microstruc-ture is homogenous and heterogeneity has been completely lost. The average grain size after six pass is 0.89μm. Fibre texture started to
con-centrate more towards 2 1 1 0 position in the inverse polefigure. Evi-dence for the development of a newfibre at around 10° from 0 0 0 1 position is also observed. This has contributed to weakening of texture strength occurs after sixth pass.
Titanium is a high stacking fault energy (SFE) metal and is expected to exhibit continuous dynamic recrystallization (CDRX) during elevated temperature deformation processes. Recent studies on ECAP of CP-Ti have reported CDRX as one of the grain refinement mechanism[49, 50]. CDRX is a recovery dominated process whereby progressive
(0 0 0 1) 0 1 2 3 4 5 6 7 8 9 10 11 12 0.00 0.05 0.10 0.15 0.20 0.25 0.30 Area fraction Grain size, µm Avg. GS = 2.88 µm 4P I-ECAP (CP-Ti) Φ=120°, 300 °C, BC
Fig. 12.EBSD based IPF map after fourth pass of I-ECAP process along with the associated inverse polefigure and the (0 0 0 1) polefigure. Thefigure also shows grain size histogram.
(0 0 0 1) 0 0.5 1 1.5 2 2.5 3 0.00 0.05 0.10 0.15 0.20 0.25 Area fraction Grain size, µm Avg. GS = 0.89 µm 6P I-ECAP (CP-Ti) Φ=120°, 300 °C, BC
absorption of dislocations within grains near grain boundaries gener-ates subgrains with low angle grains boundaries (LAGB)[51]. Upon fur-ther straining the material, the subgrains continue to rotate and the misorientations (θ) around the LAGBs continue to increase. Conse-quently, when the misorientation reaches the LAGB/HAGB cut-off (15°) value, newfine grains are originated with high angle grain bound-aries (HAGB).
To observe CDRX in the present study, a high magnification EBSD map is generated from the second pass sample, shown inFig. 14. In the EBSD map, the thin blue lines represent the LAGBs withθbetween 2 and 15°, whereas the thick red lines represent the HAGBs with
θN15°. Incomplete HAGB segments (indicated by black arrow) which do not form a fully enclosed grain are found throughout the scanned area. These incomplete HAGB segments are a strong indication of the CDRX process. The incomplete HAGBs have evolved from the LAGBs, by the progressive accumulations of the dislocations near the bound-aries. Careful analysis of two of these incomplete HAGBs, labelled as L1 and L2 reveals that the misorientation is just over 15° (see the corre-sponding graphs inFig. 14). This confirm that these HAGBs have evolved from LAGBs. Further dislocation absorption in subsequent passes will lead to the extension of these incomplete HAGBs segments to form fully enclose refined grains. Another characteristic feature associated with CDRX is the formation of necklace structure, i.e. fine grains
decorated around the coarse grains[52].Fig. 14also shows that most of the LAGBs (subgrains) development is around HAGBs. Since existing HAGBs act as nucleating sites for subgrains, it is expected that the grain refinement takes place at the exterior of coarse grains and spreads to-wards grain interior[49].
4.4. Mechanical properties 4.4.1. Tensile properties
Fig. 15(a) shows the fractured tensile samples, after the room tem-perature tensile tests conducted at constant strain rate (ε_) of 0.01 s−1for
the unprocessed condition and forfirst, second, fourth and sixth pass of I-ECAP.Fig. 15(b) shows the corresponding true stress-strain curves obtained from the tensile testing. The unprocessed material shows sig-nificant strain hardening beyond the yield point. For the processed ma-terial, it is seen that the level of yield strength (0.2% proof stress,σy) and ultimate tensile strength (σUTS) is greatly enhanced after thefirst pass and second pass compared to the unprocessed material. Although the level of strengthening is somewhat lower between second and fourth pass, this level improves again between fourth to sixth pass. Overall, it is apparent that the strength characteristic is gradually increasing due to the grain refinement taking place after each pass. In general, six passes of I-ECAP processing led to a significant increase in the values of yield strength and ultimate tensile strength in CP-Ti.
Table 3shows the individual values of strength and elongation de-rived from the stress-strain curves. Before and after six passes of I-ECAP, the yield strength of the material increases from 308 to 558 MPa and ultimate tensile strength increases from 549 to 685 MPa, this corresponds to 81% and 25% increase respectively. However, after I-ECAP processing, the ductility is somewhat reduced. The uniform elongation (δunif), which is the elongation of the gauge length just before the on-set of necking, decrease from an initial value of 22.3% to 8.80% after six passes. The elongation to failure (δfail), also decreases from 31.9% to 20.2%.
It is interesting to note that the uniform elongation (δunif) achieved in all the processed material condition is significantly lower than the elongation to failure (δfail). For visual purposes, the uniform elongation (δunif) is marked by arrows on the individual stress-strain stress curves
Table 2
Summary of I-ECAP processing parameters used in the study.
No. Variable Category Value Unit
1 Channel intersection angle (ϕ)
Geometry 120 ° (deg)
2 Outer corner angle (ψ) 0 ° (deg)
3 Temperature Processing
conditions
300 °C
4 Processing route BC –
5 No. of passes 6 –
6 I-ECAP variant I-ECAP
parameters Double billet – 7 Frequency of punch oscillation 0.5 Hz 8 Amplitude of punch oscillation 1.6 (peak to peak) mm 9 Pressing speed (plunger
increments)
0.2 (0.1) mm/cycle (mm/s)
Fig. 14.Higher magnification EBSD map from the second pass sample. Here blue lines represent low angle grain boundaries (LAGBs) between where 2°≤θ≤15°, whereas thick red lines represents the high angle grain boundaries (HAGBs) whereθN15°. Misorientation profile across two incomplete HAGB segments (L1 and L2) are also shown. (For interpretation of the references to colour in thisfigure legend, the reader is referred to the web version of this article.)
in theFig. 15(b). Studies[53,54]have shown that, in SPD processed ma-terial the onset of necking happens at early stages of deformation during tensile test. This is because SPD processed material contains highly de-formed structure, where dislocation density has reached a very high or to some extent a saturation level. Moreover, due to the dynamic re-covery process occurring during SPD processing, the grains structure is refined to UFG level, having high and low angle grain boundaries. The UFG material tends to lose the strain hardening behaviour as the very fine grains lose their ability to store dislocations generated during ten-sile testing, therefore are susceptible to plastic instability (early neck-ing). Hence, inFig. 15(b) the processed material exhibits lack of strain hardening behaviour compared to the unprocessed material. Since strain hardening is an important mechanism to sustain uniform elonga-tion (δunif) during tensile loading, lack of strain hardening exhibited by SPD processed material, limits its ductility. In the present study, howev-er the processed mathowev-erial exhibits increase in post-necking elongation compared to the unprocessed material and therefore it displays accept-able levels of overall ductility (δfail). It is concluded from the data that, after six passes there is a significant increase in strength without consid-erable loss of ductility.
4.4.2. Fractography
Fig. 16(a–e) shows the fracture morphology using SEM of the tensile tested specimens; (a) in the unprocessed condition and after (b)first, (c) second, (d) fourth and (e) sixth pass of I-ECAP. For each material condition, three images are shown; micrograph showing extend of necking at fracture (on the left), lower magnification micrograph (in the middle) and higher magnification micrograph (on the right) of the dotted rectangular box.
Low magnification micrographs (middlefigures) of all tested sam-ples confirmed that the fracture surfaces are covered throughout by dimples. This suggests that in all cases, failure process is mainly by nu-cleation and growth of voids and hence, mode of fracture is entirely duc-tile in nature. Lower and higher magnification micrographs provided for
each sample confirmed that size of the dimples is decreasing with in-crease in number of passes, which also supports the occurrence of grain refinement process. The unprocessed material is dominated by large size dimples with some evidence offine size dimples as seen in higher magnification micrograph inFig. 16(a). After second pass of I-ECAP process, it is observed that the fraction of large size dimples has been reduced noticeably. After fourth pass, the fractured surface is cov-ered by uniform sized dimples with dimple size reducing even further after sixth pass. Moreover, it is seen that the fracture surface is some-what smooth after sixth pass.
As listed inTable 3, regardless of the number of passes the reduced area at failure (Ψ) is somewhat similar, having values between 60.1 and 59.5%. As discussed earlier, although the onset of necking in proc-essed material happens at early stages of deformation, the area at failure (Ψ) values suggest resistance to localized necking. This can be consid-ered as a possible explanation for area at failure (Ψ) having similar values.
4.4.3. Compression testing
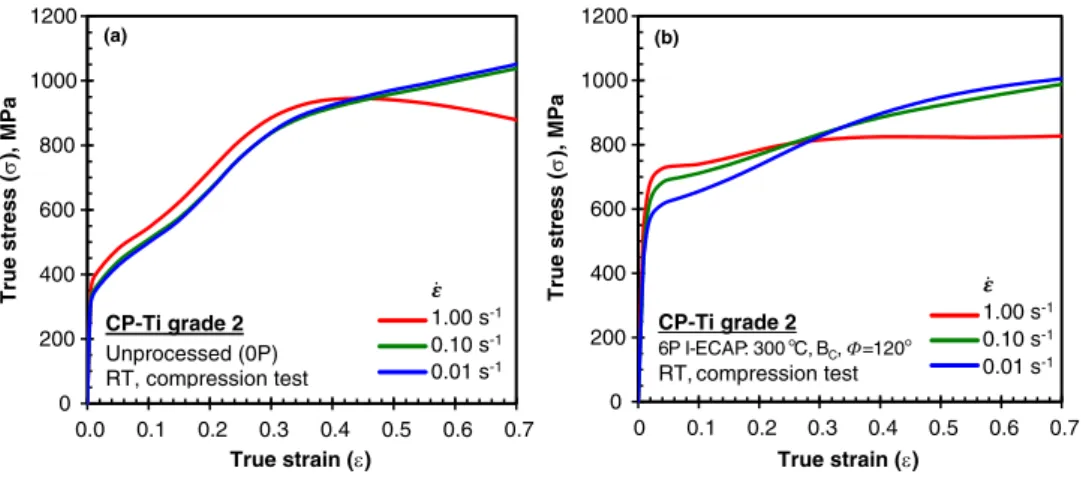
Fig. 17represents true stress as a function of true strain determined by uniaxial compression testing conducted at room temperature for (a) unprocessed and (b) severely deformed CP-Ti after six passes of I-ECAP, respectively. To investigate any strain rate sensitivity at room temperature, tests were performed at three different strain rates (ε_): 0.01, 0.10 and 1.00 s−1. All tests were conducted up to 50% height re-duction, resulting in a true strain value of ~0.70.
First, it is apparent from the obtainedflow curves that the processed material shows significant increase in compressive yield strength for all strain rates compared to unprocessed material. This shows again that the material has strengthen due to grain refinement process. However, the test results shows that the severely deformed material displays lower levels of strain hardening compared to unprocessed material. It is interesting to note, that although the yield strength of the processed material is higher, the unprocessed material due its greater strain hard-ening ability quickly strengthens during compression and displays a higherflow stress beyond the ~ 0.30 true strain value. For all strain rates, the unprocessed material therefore manages to achieve higher flow stress values at completion of compression tests at ~ 0.70 true strain.
In order to study the strain hardening behaviour in detail during these compression tests,Fig. 18presents plot of normalized strain hard-ening rate (dσ/dε/G) against true strain for (a) unprocessed material
and (b) processed material. Whereσis theflow stress,εis the true
strain and G is the shear modulus (modulus of rigidity) for titanium. In general, both material condition exhibits a distinct three-stage strain hardening behaviour within the plastic regime. Stage I is characterized
(a) (b) 0 100 200 300 400 500 600 700 800 0 0.04 0.08 0.12 0.16 0.2 0.24 0.28 True stress ( σ ), MPa Unprocessed (0P) 1P 2P 4P 6P CP-Ti grade 2 I-ECAP: 300 °C, BC, Φ=120° RT, -1
Fig. 15.(a) Fracturedflat tensile CP-Ti test specimen from the initial unprocessed condition and afterfirst, second, fourth and sixth pass of I-ECAP and (b) representative plot of true stress-strain curves obtained from tensile testing (the arrows indicate the onset of necking).
Table 3
Tensile properties of CP-Ti in unprocessed condition and after subsequent I-ECAP passes (0.2%σY—yield strength,σUTS—ultimate tensile strength,δunif—uniform elongation,
δfail—elongation to failure,Ψ—reduced cross-section area at failure,εfail—true strain at failure andσfail—true stress at failure).
Pass # Equivalent strain 0.2%σY (MPa) σUTS (MPa) δunif (%) δfail (%) Ψ (%) εfail σfail (MPa) 0P – 308 549 22.3 31.9 63.9 0.28 438 1P 0.67 489 601 14.5 23.8 60.1 0.21 469 2P 1.34 502 648 12.7 22.8 59.6 0.20 511 4P 2.68 511 657 11.4 20.6 60.2 0.18 539 6P 4.02 558 685 8.8 20.2 59.5 0.18 517
by a decreasing rate of strain hardening and is similar to the dynamic re-covery regime observed in many metals[55]. Upon reaching a certain strain, the hardening rate increases, representing the stage II deforma-tion. This is then followed by considerable reduced rate of hardening or evenflow softening (negative rate of hardening), denoting the stage III deformation. This three-stage hardening behaviour is consis-tent with earlier reports on compression testing of titanium at room and elevated temperatures[55–57].
Studies have shown that the increase in strain hardening behaviour in stage II is due to deformation twinning[58,59]. Notice that the se-verely deformed CP-Ti inFig. 18(b), exhibits much lower levels of
stage II strain hardening compared to the unprocessed material. This is because the severely deformed material has a UFG structure; there-fore, twinning activity is greatly suppressed as such. The results are con-sistent with Gray[60], who performed compression tests onfine and coarse grain titanium, which shows that the rate of strain hardening in-creases with increase in grain size due to pronounced increase in defor-mation twinning. Twinning increases the strain hardening in two ways; firstly, it causes reduction in effective grain size, therefore contributes to strengthening via the Hall-Patch effect. Secondly, the twinned regions are much harder than the rest of the matrix (untwinned) regions. To confirm the later, Kalidindi et al. [58] deformed CP-Ti under
compression up to a strain of 5%, this corresponds to the initiation of stage II hardening and onset of deformation twinning. Microhardness measurement on the twinned regions showed a 30% hardness increase compared to the matrix regions.
Notice that the onset of stage II strain hardening in the present study also happens around ~5% true strain (seeFig. 18(a) and (b)). However inFig. 18(a) it is seen that the initiation of stage II hardening for the fastest strain rate of 1.0 s−1(red line) happens slightly earlier i.e. at a
lower true strain value compared to the slower strain rates (green and blue lines). Similar results were obtained in[61], in which it was shown that deformation twins are generated at lower strains during compression as the strain rate is increased. However, this effect is not observed in the severely deformed material, where the onset of stage II hardening does not seems to be effected by the increase in strain rate. For strain rates of 0.01 and 0.1 s−1, the unprocessed material during
stage III shows a rapidly decreasing strain hardening behaviour. Howev-er, beyond a true strain of ~ 0.40 both reaches a steady state condition and there is no noticeable change in strain hardening rate. For the se-verely deformed material at these strain rates, the decrease in strain hardening in stage III is not as rapid. It decreases at a lower rate and con-tinues to do so until testfinishes.
Compression tests have shown that, the severely deformed material has still some tendency of strain hardening compared to tensile tests, where a near steady state behaviour inflow stress was observed after initial yielding. Nevertheless, both the tensile and compression tests re-sults have shown that the processed material significantly loses its abil-ity to strain harden compared to unprocessed material. This is because
the heavily deformed UFG structure in the processed material has a lim-ited capacity to accumulate further dislocations and has a reduced ten-dency to generate twin boundaries during subsequent deformation [62].
For both material condition theflow stress obtained at the highest strain rate of 1.0 s−1is particularly interesting, after an initial strain hardening behaviour (stage I and stage II), both exhibitedflow soften-ing (negative rate of hardensoften-ing). However, thisflow softening is much more prominent in unprocessed material. The observedflow softening is believed due to the temperature rise during deformation. Thisflow softening at a strain rate of 1.0 s−1, has also been observed during
com-pression tests on nanocrystalline titanium produced by mechanical milling followed by a consolidation process[63]and also in UFG titani-um produced by ECAP[64]. Both studies concluded, theflow softening due to the heat generated during plastic deformation. The temperature rise during deformation can be calculated by the following relationship:
∆T¼ β
ρCp ∫ε
0σdε ð2Þ
whereβis the factor which specifies the portion of plastic work convert-ed into heat (Taylor-Quinney coefficient, normally taken to be 0.90),ρis the material's density,Cpis the specific heat and the integral in Eq.(2) defines the work done byflow stress (σ) during compression loading. Using the equation, the temperature rise during compression testing is calculated for two strain levels: (1) true strain whereflow softening be-gins (εs) and (2) thefinal true strain (εf≈0.70). Ideal conditions are 0 200 400 600 800 1000 1200 0.0 0.1 0.2 0.3 0.4 0.5 0.6 0.7 True stress ( σ ), MPa True strain (ε) 1.00 0.10 0.01 0 200 400 600 800 1000 1200 0 0.1 0.2 0.3 0.4 0.5 0.6 0.7 True stress ( σ ), MPa True strain (ε) 1.00 0.10 0.01 CP-Ti grade 2 6P I-ECAP: 300°C, BC,Φ=120° RT, compression test (b) 1.00 s-1 0.10 s-1 0.01 s-1 CP-Ti grade 2 Unprocessed (0P) RT, compression test 1.00 s-1 0.10 s-1 0.01 s-1 (a)
Fig. 17.Representativeflow curves (true stress vs true strain) obtained from uniaxial compression testing at various strain rates for (a) unprocessed material and (b) after six passes of I-ECAP. -0.02 -0.01 0.00 0.01 0.02 0.03 0.04 0.05 0.06 0.07 0.08 0.0 0.1 0.2 0.3 0.4 0.5 0.6 0.7 Hardening rate (d σ /d ε /G) True strain (ε) 1.00 0.10 0.01 (a) 1.00 s-1 0.10 s-1 0.01 s-1 Stage III Stage I Stage II CP-Ti grade 2 Unprocessed (0P) RT, compression test -0.02 -0.01 0.00 0.01 0.02 0.03 0.04 0.05 0.06 0.07 0.08 0.0 0.1 0.2 0.3 0.4 0.5 0.6 0.7 Hardening rate (d σ /d ε /G) True strain (ε) 1.00 0.10 0.01 (b) 1.00 s-1 0.10 s-1 0.01 s-1 Stage III Stage I Stage II CP-Ti grade 2 6P I-ECAP: 300 °C, BC,Φ=120° RT, compression test
Fig. 18.Plot of normalized strain hardening behaviour for (a) unprocessed and (b) severely deformed material after six passes. (For interpretation of the references to color in thisfigure, the reader is referred to the web version of this article.)
assumed, i.e. no heat loss due to conduction or convection. For unpro-cessed material the equation predicts a temperature rise of 121 °C at
εs= 0.45 which increases to 219 °C atεf. The predicted temperature rise for processed material is 81 °C atεs= 0.28 and rises to 198 °C at εf. Theflow stress of titanium is very sensitive to temperature, the pre-dicted temperature rise at strain rate of 1.0 s−1for both material
condi-tions is assumed to influence theflow stress behaviour. However, further tests such as load-unload-reload tests performed in[63]are nec-essary to establish the exact role of temperature rise inflow softening.
Theflow stress of severely deformed material displays higher level of dependence on strain rate, whereby theflow stress increases with in-crease in strain rate. The unprocessed material only shows inin-crease in flow stress at the highest strain rate of 1.0 s−1. The effect of strain rate
on theflow stress of the material can be further analysed by determin-ing the strain rate sensitivity. The strain rate sensitivity is denoted bym
value and is calculated by Eq.(3):
m¼∂∂logσ logε_ ε;T ð3Þ
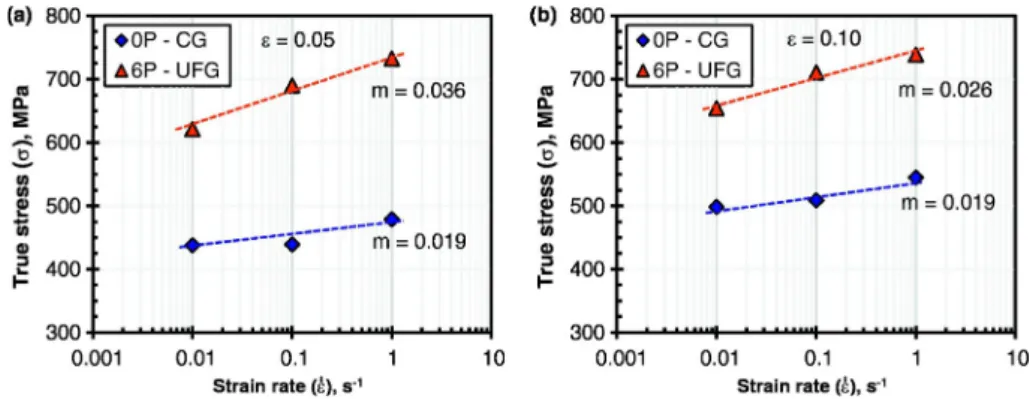
whereσandε_are theflow stress and strain rate, respectively. It is im-portant to note that themvalue has to be calculated for a certain strain value and temperature.Fig. 19(a) and (b) shows the variation offlow stress on various strain rates plotted on a semi-logarithmic form, where stress is measured at (a) 5% and (b) 10% true strain, respectively for coarse grain (0P) and UFG (6P) material tested in compression at room temperature. The values of strain rate sensitivity can be easily cal-culated from such graph, by determining the slope of the linearfit.
It is apparent that themvalue at both selected strains shown in Fig. 19for the UFG material is higher compared to unprocessed material. From theflow stress observation and themvalue calculation, it is shown that the UFG Ti exhibits a higher strain rate sensitivity in compression at room temperature. Although the UFG material exhibits increase strain rate sensitivity, this increase is not believed to improve the ductility of the material considerably during tensile deformations at room temper-ature. This is because the mechanisms such as grain boundary sliding which facilitates increase in ductility occurring in higher strain rate sen-sitive materials are not pronounced at room temperature[65].
4.5. Hardness evolution
Numerous studies on ECAP have shown that it is essential to process the billet multiple times in order to induce the desired level of strain and thereby attain UFG structure. Microhardness is considered as a standard procedure for evaluating the induced strain after processing and also to study the level of billet homogeneity with respect to mechanical prop-erties and corresponding microstructural changes. To examine the ho-mogeneity of strain distribution and also to investigate the evolution of hardness with increasing number of I-ECAP passes, microhardness
measurements were recorded both on unprocessed material and on material subjected to I-ECAP passes. The individual values of microhard-ness (Hv) were measured on an 11 × 11 array of equi-spaced points across the transverse (X) plane.
For the purposes of providing a detailed visual representation, con-tour maps have been generated from the microhardness measurements across the X plane. TheFig. 20(a–e) shows colour-coded contour maps for the (a) unprocessed material and for the (b)first, (c) second, (d) fourth and (e) sixth pass. For all maps, the values of microhardness are represented by a set of distinct colours. The corresponding micro-hardness value of each colour is shown by the legend given on the right, which ranges from 150 to 220Hvin increments of 7Hv. The X and Y axis of the plot represent the transverse direction (TD) and nor-mal direction (ND) withflow direction (FD) pointing outward from the paper.
It is evident fromFig. 20(b), that the microhardness values increases significantly after thefirst pass and this increase is seen to occur over the entire surface of the sample. The increase in microhardness con-tinues through subsequent passes, this is attributed to the fact that greater level of strain is accumulated in the material after each pass which causes reduction in grain size thereby increasing the strength characteristic of the material. However, upon close assessment of the contour plot, it is evident that the increase in the hardness distribution is not completely uniform across the entire surface. There is a region of lower hardness near the top surface of the billet after fourth pass. Al-though, after sixth pass the situation improves, as this region of lower hardness is somewhat shrinked. Nevertheless, this narrow region of lower hardness near the top remains even after six passes.
In order to examine the level of non-uniformity,Fig. 21(a–d) shows the microhardness (Hv) values recorded on the transverse (X) plane along the centre line and at 1 mm from the top and bottom surfaces after (a) one, (b) two, (c) four and (d) six passes respectively. For all the plots the dashed line represents the average microhardness in the unprocessed condition. Overall, it is fairly obvious that the microhard-ness values are increasing with increasing number of passes. Afterfirst pass, the average microhardness along the centre line increases to ~ 180Hvfrom ~ 157Hvin the unprocessed condition. The microhard-ness values near the top surface was lower with a value of ~ 175Hv, however near the bottom surface the average value was slightly higher with ~182 Hv. From pass two to six the hardness continues to increase gradually over subsequent passes and does not seems to saturate. The level of homogeneity improves after second pass since the microhard-ness near the top and bottom surfaces are relatively similar to micro-hardness along the centre line. Beyond pass two, the region near the bottom surface continues to maintain the same hardness level as the centre line. In contrast, the hardness near the top surface is somewhat lower. After six passes, average microhardness at the centre line and near the bottom surface are both roughly the same at ~ 218Hv, com-pared to a value of ~210Hvnear the top surface.
Fig. 22shows the mean values of microhardness calculated from the recorded measurements on the X plane of samples, for unprocessed condition and afterfirst, second, fourth and sixth passes of I-ECAP. The error bars in the graph represent the standard deviation, which shows the level of dispersion in the hardness values from the mean value. In the unprocessed condition the mean value of microhardness is ~ 156
Hv, afterfirst pass this value rises sharply to ~ 181Hv, an increase of 16%. For subsequent second, fourth and sixth passes the microhardness value increases to 187, 199 and 215Hv, this corresponds to an increase of 3.3%, 6.4% and 8.0% respectively. This increase in mean microhardness values also correlates qualitatively with the increase in yield and ulti-mate tensile strength observed in tensile test after subsequent I-ECAP passes. Overall, after six passes of I-ECAP process the average value of
microhardness is increased from 156 to 215Hv, this corresponds to an increase of 38%.
5. Comparison with ECAP
It is convenient to make a comparison with the earlier reports of pro-cessing CP-Ti (various grades) by ECAP at different die angles, process-ing speeds and temperatures. Table 4 presents the summary of processing parameters used in selected earlier ECAP studies and present study, along with the improvement in grain size, hardness, strength and ductility. It is important to emphasize that the grain size and mechanical properties listed in the table are after ECAP process only and before any subsequent post ECAP deformation (such as cold extrusion, rolling etc.)
Fig. 20.Colour coded contour maps of the microhardness (Hv) values recorded on the transverse (X) plane of (a) unprocessed condition, after (b)first, (c) second, (d) fourth and (e) sixth pass of the I-ECAP process. (For interpretation of the references to color in thisfigure, the reader is referred to the web version of this article.)
are performed. The table has been arranged in the descending order of processing temperature.
As can be seen in the table, to facilitate processing of CP-Ti various techniques have been employed. These include processing at elevated temperatures, using higher die angles and by using lower grades of tita-nium. To activate more slip systems in titanium, almost all the studies listed in table have been performed at elevated temperatures (500 to 250 °C). Zhao et al.[30,31]was however able to demonstrate ECAP at room temperature. This is because grade 1 was used in these studies, which has the lowest interstitial and substitutional elements among available commercial grades of titanium and therefore considered to be the most formable.
In the context of processing grade 2; for lower die angle of 90°, the processing temperature was 350 °C or above. However, it is seen that the processing temperature can be decreased to 250 °C, when higher die angles of 105 to 120° is used. It is evident from the table that the en-hancements in mechanical properties by I-ECAP achieved in the present
study are quite reasonably comparable with previous ECAP studies. Al-though, lowering the processing temperature or by using 90° die, the enhancements in mechanical properties can be improved even further. The study by Sordi et al.[72]is directly comparable with the present study, as it has identical processing conditions. It is seen that although the processing conditions are exactly the same, the mechanical proper-ties are better to the ones obtained in the present study. However upon analysing theFig. 5in[72]whereby the tensileflow stress curves are presented. It is clear that the material after subsequent ECAP passes, suf-fers a very high rate offlow softening beyond the onset of necking, which is not the case in the present study. Moreover, the uniform elon-gation is also considerably less than the one observed in the present study.
6. Conclusion
The feasibility of using the I-ECAP process for refining grain structure in CP-Ti with the objective of improving its strength characteristics has been presented in this article. CP-Ti grade 2 billets were successfully processed via double-billet variant of I-ECAP process. The billets were subjected to a total of six passes at 300 °C following route BC, using
the die channel intersection angle of 120°. The following conclusions are drawn from the results obtained:
1. I-ECAP process is shown to be an effective method which is capable of producing defect free CP-Ti billets. This promising technique re-quires very low pressing force therefore it is capable of processing very long or continuous billets.
2. Initial passes of I-ECAP process resulted in a heterogeneous micro-structure. EBSD analysis of subsequent passes reveals remarkable grain refinement leading to homogenous UFG microstructure. The average grain size of the as received material was reduced from ~ 22μm to ~ 0.89μm after sixth pass. The texture analysis showed
that afibre texture formed immediately afterfirst pass. Its strength continues to increase up to fourth pass, after which it weakens due to significant grain refinement.
Fig. 21.Microhardness (Hv) values recorded on the transverse (X) plane along the centre and at 1 mm from the top and bottom surfaces after (a)first, (b) second, (c) fourth and (d) sixth pass of the I-ECAP process: the dashed line shows the average microhardness value in the unprocessed condition.
Fig. 22.Mean values of Vickers microhardness (Hv) recorded on the X plane before and after subsequent passes of I-ECAP process.