Volume 15 | Issue 1 Article 39
5-1-2016
Model-Based Outlier Detection System with
Statistical Preprocessing
D. Asir Antony Gnana Singh
Anna University, Tiruchirappalli, India, [email protected]
E. Jebalamar Leavline
Anna University, Tiruchirappalli, India, [email protected]
Follow this and additional works at:http://digitalcommons.wayne.edu/jmasm
Part of theApplied Statistics Commons,Social and Behavioral Sciences Commons, and the
Statistical Theory Commons
Recommended Citation
Singh, D. Asir Antony Gnana and Leavline, E. Jebalamar (2016) "Model-Based Outlier Detection System with Statistical Preprocessing,"Journal of Modern Applied Statistical Methods: Vol. 15 : Iss. 1 , Article 39.
DOI: 10.22237/jmasm/1462077480
D. Asir Antony Gnana Singh is in the Department of Computer Science and Engineering. Email at: [email protected]. Dr. Leavline is a Professor in the Department of Electronics Communication and Engineering. Email her at: [email protected].
Model-Based Outlier Detection System with
Statistical Preprocessing
D. Asir Antony Gnana Singh
Anna University Tiruchirappalli, India
E. Jebalamar Leavline
Anna University Tiruchirappalli, India
Reliability, lack of error, and security are important improvements to quality of service. Outlier detection is a process of detecting the erroneous parts or abnormal objects in defined populations, and can contribute to secured and error-free services. Outlier detection approaches can be categorized into four types: statistic-based, unsupervised, supervised, and semi-supervised. A model-based outlier detection system with statistical preprocessing is proposed, taking advantage of the statistical approach to preprocess training data and using unsupervised learning to construct the model. The robustness of the proposed system is evaluated using the performance evaluation metrics sum of squared error (SSE) and time to build model (TBM). The proposed system performs better for detecting outliers regardless of the application domain.
Keywords: Outlier, Preprocessing, Inter-quartile range, Anomaly Detection
Introduction
Outlier detection is the process of identifying the objects or events that does not follow the stranded pattern or change in behaviour compared to the group members. The outlier detection is also known as anomaly detection (Chandola, Banerjee, & Kumar, 2009). Anomaly detection helps to solve bank fraudulent detection, network or host-based intrusion detection, credit cards fraudulent detection (Akhilomen, 2013), adversaries detection in military environment, surveillance for enemy activities, detecting the outliers from captured information in ad-hoc and wireless sensor networks (Singhal, Gankotiya, Agarwal, & Verma, 2012), structural defect identification, error detection in intensive and safety systems, detecting errors in text, detecting the anomaly in computer networks to prevent the attack (Tartakovsky, Polunchenko, & Sokolov, 2013), detecting
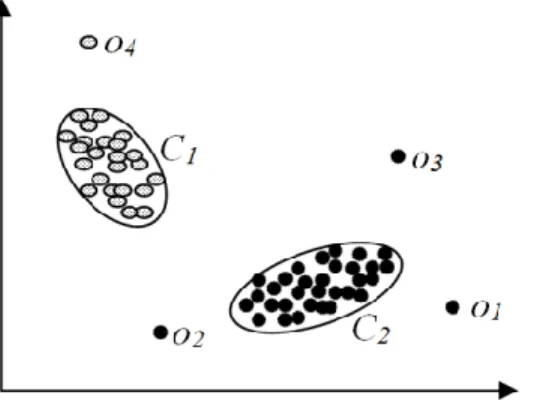
abnormal reading of radars due to the fault in the parts of the air craft (Fujimaki, Yairi, & Machida, 2005), detecting chromosomal abnormalities in medical field (Manning & Hudgins, 2010), etc. Anomaly is also termed as exceptions, deviations, novelties and noise (Hodge & Austin, 2004). Figure 1 shows the objects which are deviated from the cluster groups Ci in a vector space. The similar objects are grouped as the clusters. The outliers are denoted as o1, o2,…, on and the clusters are denoted as Ci where i denotes the cluster index.
Figure 1. Similarity-based grouping of object with outliers
Commonly, the outliers are detected using the following steps: Initially, a model of the normal activities or behaviour is constructed and then the outliers are detected using the model. The model can be a statistical summary or pattern of the overall samples or objects. The model can be constructed by learning the behaviors or actions of the samples or objects. Using the built model, the outliers are detected by observing the activities or characteristics that significantly differ from the normal model. A model-based outlier detection system with statistical preprocessing is proposed. The statistical measure namely inter-quartile range (IQR) is used for preprocessing and an unsupervised learner is used to build the model in order to detect the outliers for various domains.
Related works
Outliers can be detected in various fashions such as graphical, statistical, unsupervised, supervised, and semi-supervised methods. In graphical method, one or multi-dimensional plots such as spin plot, scatter plot, and box-plot are used to detect and identify the outliers. The major drawback of this approach is the
increased time consumption for detection of the outliers. Also, the plots are more specific to the detection problem, and they follow may constrains.
The statistical method generates a parametric model that describes the data distribution and then, the statistical measure is used to find the parameters of the data distribution such as mean, variance, and median to find the ranges of the outlier confidence level. Then, based on the distribution parameter or outlier ranges, the outliers are detected and separated from the normal distribution of the data model. Zhang et al. (2012) used the statistical method to detect the outliers for the wireless sensor networks (WSN) in order to preprocess the data which is acquired from the sensor nodes for improving the accuracy of the acquired data and to reduce the transmission overhead. In this approach, the statistical measures such as temporal correlation, spatial correlation and spatial-temporal correlation are used to detect the outliers.
Rousseeuw and Hubert (2011) developed an outlier detection scheme using robust location and scatter estimators for outlier detection in multivariate data. The location refers to the coordinate-wise mean and the scatter refers to the covariance matrix. Statistical measure is computed in three phases namely c-step data iteration, data partitioning, and data nesting (Rousseeuw & Hubert, 2011). Hido, Tsuboi, Kashima, Sugiyama, and Kanamori (2011) proposed a statistical-based outlier detection method using the direct density ratio estimation. The major drawback of this statistical method is that most of the statistical tests cannot be applied for the multi-attribute problems. Also, they require the prior knowledge of probability distribution of the data and it is difficult to estimate the real distribution of high dimensional data (Hido et al., 2011).
In the unsupervised method, the data are structured as attributes (column-wise) and objects (row-(column-wise). Objects refer to samples or populations that contain the attributes. Commonly, the clustering approach is used with the similarity criteria such as distance-based, density-based, nearest-neighbor-based, etc. Casas, Mazel, and Owezarski (2011) proposed a network anomaly detection system using the unsupervised clustering approach by sub-space and density-based metrics to prevent the network attacks. The network attacks can be denial-of-service, illegal access, probing, and spreading warms and viruses (Casas et al., 2011). In some cases, multiple-clustering techniques are combined for outlier detection using evidence accumulation (Fred & Jain, 2005). The researchers observed that distance-based method is better in detecting the outliers since it does not require any probability distribution and also computing the probabilistic distribution to the high-dimensional data is difficult.
Sugiyama and Borgwardt (2013) developed an unsupervised outlier detection method using sampling-based in the literature (Sugiyama) and reported that the sampling method outperforms the other method that uses the searching technique using k-nearest neighbor principle. Koupaie, Ibrahim, and Hosseinkhani (2014) suggested unsupervised outlier detection to detect the stream data. The multi-objective genetic algorithm (MOGA) is used to search the outliers from an object space and the k-means clustering is used to develop the model in order to detect the outliers. Casas, Mazel, and Owezarski (2012) presented a knowledge-independent method based on multi-clustering approach, which is adopted to detect the network attack. The anti-k nearest neighbor approach is used to detect the credit card fraud in the literature (Ganji & Mannem, 2012). The prime advantage of the unsupervised outlier detection is that it does not require the labelled data since the labelled data are costlier than unlabelled data and it requires special mechanism to label the data. Therefore, this approach is simple and cost-effective than the supervised approach.
In supervised method, the classifiers are used to detect the outliers by learning the labelled data. The following works were carried out by the researchers in supervised method. A RIPPER classification algorithm is used to describe the logical rules to detect the outliers (Salvador & Chan, 2005) from the temporal time series data. Cabrera, Lewis and Mehra (2001) presented an outlier detection algorithm to detect the network anomaly and Masud, Gao, Khan, Han and Thuraisingham (2011) built an ensemble model with voting approach to detect the class label in order to solve the data stream classification problems. Mourão-Miranda et al. (2011) used one-class support vector machine classifier to detect the outlier patient from a group of patients based on the disease in medical environment. In image processing, the support vector machine classifier is used to detect the changes in very high geometrical resolution (VHR) images (Volpi, Tuia, Bovolo, Kanevski & Bruzzone, 2013). The supervised approach requires the labelled data for detection. Hence, it is expensive than the unsupervised method.
In the semi-supervised method, the labeled and unlabeled data are used to detect the outliers. The semi-supervised approaches are followed by the researchers as reported in the literature (Xue, Shang & Feng, 2010). The authors presented a fuzzy rough c-means clustering to detect the outliers. Noto, Brodley, and Slonim (2012) proposed an outlier detection system. In this system, the normal instances are used to build the ensemble feature to detect the anomaly from the received instances. Daneshpazouh and Sami (2014) used the entropy measure to detect the outliers. Initially, the steadfast negative samples are taken from unlabeled and positive data, and then the outliers are detected based on the
entropy score to remove the outliers. Also, Zamoner and Zhao (2013) presented a score base outlier detection using stochastic network method. A semi-supervised cluster was also proposed in the literature to detect the outliers from the digital mammograms (Thangavel & Mohideen, 2010).
Proposed Model-Based Outlier Detection System with Statistical Preprocessing
Various outlier detection approaches have been developed. The outlier detection requires the domain activity database that is also known as training dataset. This data are classified into two types namely labelled data and unlabelled data. Preparing the labelled data is costlier than the unlabelled data because the special mechanisms are required to prepare the labelled data. Unfortunately, the supervised method fails to process the unlabelled data. In order to overcome this problem, the proposed outlier detection system is developed in an unsupervised fashion. In the unsupervised fashion, the labelled data is not required. Thereby, the initial cost is reduced.
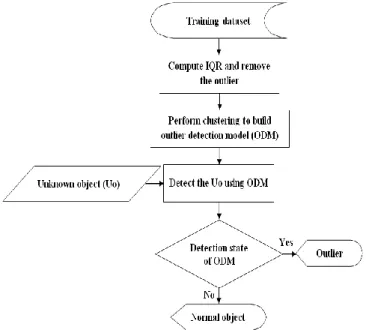
The flowchart representation of the proposed system is depicted in Figure 2. This system consists of three major phases namely removal of outliers, building up of outlier detection model, and detection phase. In removal of outliers phase, the outliers are removed from the training dataset using IQR. In the second phase, the outlier detection model (ODM) is built using the k-means clustering algorithm. In the detection phase, the ODM-based detector identifies the outlier objects from the unknown object space.
The IQR measure is used to preprocess and identify the outliers from the training dataset. The IQR finds the outliers from the dataset by identifying the data which is over ranging from the dataset. The IQR is evaluated as IQR = Q3 - Q1 where Q3 and Q1 are the upper and lower quartiles, respectively. Let us consider a dataset with the numerical data that are arranged in ascending order as 4, 7, 9, 11, 12, and 20. Then, the midpoint is identified to divide the dataset into two halves such as 4, 7, 9 | 11, 12, 20. Then, the median of the lower half and upper half of the data are found. Thus, Q1 = 7 is the median of the lower half data portion and Q3 = 12 is the median of the upper half data portion. Then, the IQR is calculated as Q3 - Q1 = 12 – 7 = 5. Outlier value OV = 1.5 × 5 = 7.5 where the 1.5 is the outlier factor, lower extreme LE = Q1 - OV = 7 - 7.5 = -0.5 and upper extreme UE = Q2 + OV = 12 + 7.5 = 19.5. Therefore, the normal objects lie in between the upper and lower extreme and if any object lies out of the two (LE and UE) extremes that is treated as outlier.
Figure 2. Flowchart representation of the proposed outlier detection system
The unsupervised k-means (Sammut & Webb, 2011) algorithm is used to build the ODM using the training dataset which is preprocessed using IQR. The ODM is used to categorize the unknown object to detect whether the given object is an outlier or a normal object. In order to build ODM, the number of clusters k is defined in such a way that the k-means algorithm defines a centroid for each cluster. Then, the data points of the training dataset are grouped based on the centroid of each cluster using similarity measure Euclidian distance. The cluster center point is refined in an iterative fashion to form the perfect k groups of data points using the Equation 1.
2 2 1 1 1 2 K K i j k i k k C i k C j k k C i k W C x x N x m
(1)where x1,…, xN are the data points of the training dataset. Each observed data point is assigned to any one of the k clusters. C(i) indicates the cluster index of the ith vector. mk denotes the mean vector of the kth cluster. Nk denotes the number of observations of the kth clusters.
Experimental Setup and Discussion on Result
In order to evaluate the performance of the proposed system, the real-world datasets such as e-mail-based dataset Spambase, communication and control system-based dataset Ionosphere, panel dataset Unbalance, banking dataset Credit-g, and service-based dataset CPU-with-vendor are collected from the UCI repository and other databases (Lichman, 2013).
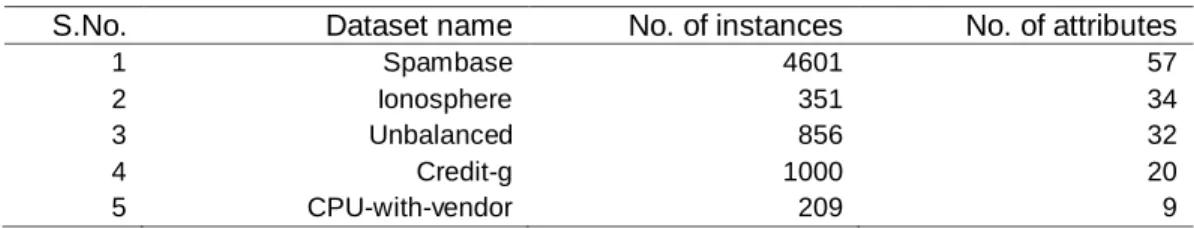
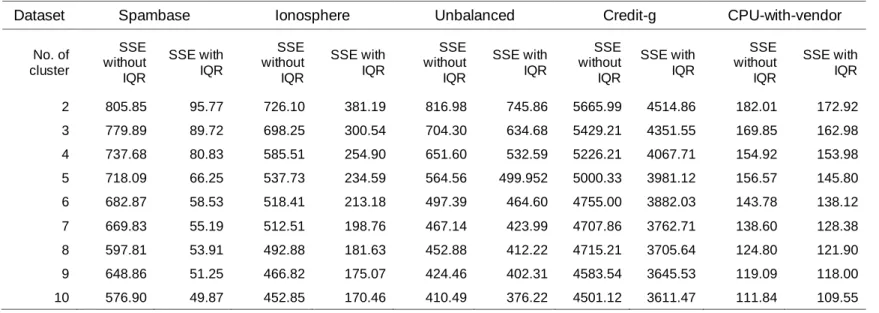
Table 1 shows the details of datasets used for the experiments. In order to conduct the experiment, initially IQR algorithm is applied on the datasets with the extreme value factor and outlier factors 6.0 and 3.0, respectively. Then, the outliers are detected using IQR algorithm as shown the in Table 2. Then, the detected outlier instances are removed from the datasets. In order to build the outlier detection model, the datasets without outliers are fed into the k-means algorithm with the Euclidean distance measure and maximum number of iterations of 500. Then, the outlier detection model is built using k-means algorithm. The unknown objects can be detected using the built model. Then, the test results are obtained to evaluate the performance of the proposed system by observing the sum of squared error (SSE) and time taken to build the model (TBM) for the each number of clusters k from 1 to 10 as tabulated in Table 3 and
Table 4.
Table 1. Dataset details
S.No. Dataset name No. of instances No. of attributes
1 Spambase 4601 57
2 Ionosphere 351 34
3 Unbalanced 856 32
4 Credit-g 1000 20
5 CPU-with-vendor 209 9
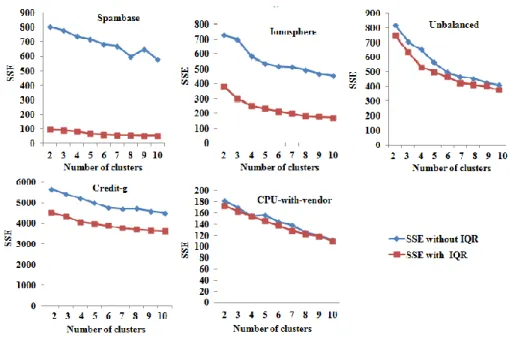
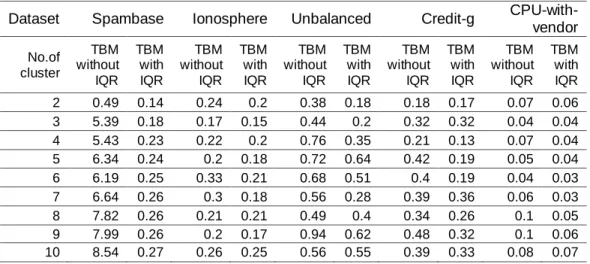
Figure 3 shows the comparison of SSE without and with IQR on various datasets and it is evident that the proposed approach drastically reduces SSE compared to the outlier detection without IQR. Figure 4 shows the comparison on TBM in second without and with IQR on various datasets and it depicts that the proposed approach drastically reduces the time to build the outlier detection model for various datasets compared to the same without IQR.
Figure 3. Comparison on SSE without and with IQR on various datasets
Table 2. Identified normal and outlier instances
S.No. Dataset name No. of normal instances No. of outlier instances
1 Spambase 2997 1604
2 Ionosphere 286 65
3 Unbalanced 717 139
4 Credit-g 822 178
5 CPU-with-vendor 171 38
Table 3. Comparison on the SSE in second without and with IQR on various dataset
Dataset Spambase Ionosphere Unbalanced Credit-g CPU-with-vendor
No. of cluster SSE without IQR SSE with IQR SSE without IQR SSE with IQR SSE without IQR SSE with IQR SSE without IQR SSE with IQR SSE without IQR SSE with IQR 2 805.85 95.77 726.10 381.19 816.98 745.86 5665.99 4514.86 182.01 172.92 3 779.89 89.72 698.25 300.54 704.30 634.68 5429.21 4351.55 169.85 162.98 4 737.68 80.83 585.51 254.90 651.60 532.59 5226.21 4067.71 154.92 153.98 5 718.09 66.25 537.73 234.59 564.56 499.952 5000.33 3981.12 156.57 145.80 6 682.87 58.53 518.41 213.18 497.39 464.60 4755.00 3882.03 143.78 138.12 7 669.83 55.19 512.51 198.76 467.14 423.99 4707.86 3762.71 138.60 128.38 8 597.81 53.91 492.88 181.63 452.88 412.22 4715.21 3705.64 124.80 121.90 9 648.86 51.25 466.82 175.07 424.46 402.31 4583.54 3645.53 119.09 118.00 10 576.90 49.87 452.85 170.46 410.49 376.22 4501.12 3611.47 111.84 109.55
Table 4. Comparison on the TBM in second without and with IQR on various datasets
Dataset Spambase Ionosphere Unbalanced Credit-g CPU-with-vendor No.of cluster TBM without IQR TBM with IQR TBM without IQR TBM with IQR TBM without IQR TBM with IQR TBM without IQR TBM with IQR TBM without IQR TBM with IQR 2 0.49 0.14 0.24 0.2 0.38 0.18 0.18 0.17 0.07 0.06 3 5.39 0.18 0.17 0.15 0.44 0.2 0.32 0.32 0.04 0.04 4 5.43 0.23 0.22 0.2 0.76 0.35 0.21 0.13 0.07 0.04 5 6.34 0.24 0.2 0.18 0.72 0.64 0.42 0.19 0.05 0.04 6 6.19 0.25 0.33 0.21 0.68 0.51 0.4 0.19 0.04 0.03 7 6.64 0.26 0.3 0.18 0.56 0.28 0.39 0.36 0.06 0.03 8 7.82 0.26 0.21 0.21 0.49 0.4 0.34 0.26 0.1 0.05 9 7.99 0.26 0.2 0.17 0.94 0.62 0.48 0.32 0.1 0.06 10 8.54 0.27 0.26 0.25 0.56 0.55 0.39 0.33 0.08 0.07
Conclusion
This paper presented a model-based outlier detection system using statistical preprocessing method. The performance of this proposed system is tested on the various real world well-known publically available datasets with the performance evaluation metrics namely sum of squared error (SSE) and time to build model (TBM). From the experimental results, it is observed that the proposed system performs better in terms of SSE and TBM for detecting the outliers regardless of the application domain.
References
Akhilomen, J. (2013). Data Mining Application for Cyber Credit-Card Fraud Detection System. In P. Perner (Ed.), Advances in Data Mining.
Applications and Theoretical Aspects: 13th Industrial Conference, ICDM 2013, New York, NY, USA, July 16-21, 2013. Proceedings (pp. 218-228). Berlin, Heidelberg: Springer Berlin Heidelberg
Cabrera, J. B. D., Lewis, L., & Mehra, R. K. (2001). Detection and classification of intrusions and faults using sequences of system calls. ACM SIGMOD Record, 30(4), 25-34. doi:10.1145/604264.604269
Casas, P., Mazel, J., & Owezarski, P. (2011). UNADA: Unsupervised Network Anomaly Detection Using Sub-space Outliers Ranking. In J. Domingo-Pascual, P. Manzoni, S. Palazzo, A. Pont, & C. Scoglio (Eds.), NETWORKING
2011 (pp. 40–51). Springer Berlin Heidelberg. Retrieved September 4, 2014, from
http://link.springer.com/chapter/10.1007/978-3-642-20757-0_4
Casas, P., Mazel, J., & Owezarski, P. (2012). Knowledge-independent traffic monitoring: Unsupervised detection of network attacks. IEEE Network, 26(1), 13-21. doi:10.1109/MNET.2012.6135851
Chandola, V., Banerjee, A., & Kumar, V. (2009). Anomaly detection: A survey. ACM Computing Surveys, 41(3), 1-58. doi:10.1145/1541880.1541882
Daneshpazhouh, A., & Sami, A. (2014). Entropy-based outlier detection using semi-supervised approach with few positive examples. Pattern Recognition Letters, 49, 77-84. doi:10.1016/j.patrec.2014.06.012
Fred, A. L. N., & Jain, A. K. (2005). Combining multiple clusterings using evidence accumulation. IEEE Transactions on Pattern Analysis and Machine Intelligence, 27(6), 835-850. doi:10.1109/TPAMI.2005.113
Fujimaki, R., Yairi, T., & Machida, K. (2005). An approach to spacecraft anomaly detection problem using kernel feature space. Proceedings of the Eleventh ACM SIGKDD International Conference on Knowledge Discovery in Data Mining, KDD ’05 (pp. 401-410). New York, NY: ACM.
doi:10.1145/1081870.1081917
Ganji, V. R., & Mannem, S. N. P. (2012). Credit card fraud detection using anti-k nearest neighbor algorithm. International Journal on Computer Science and Engineering, 4(6), 1035-1039.
Hido, S., Tsuboi, Y., Kashima, H., Sugiyama, M., & Kanamori, T. (2011). Statistical outlier detection using direct density ratio estimation. Knowledge and Information Systems, 26(2), 309-336. doi:10.1007/s10115-010-0283-2
Hodge, V. J., & Austin, J. (2004). A survey of outlier detection methodologies. Artificial Intelligence Review, 22(2), 85-126.
doi:10.1007/s10462-004-4304-y
Koupaie, M. H., Ibrahim, S., & Hosseinkhani, J. (2014). Outlier detection in stream data by clustering method. International Journal of Advanced Computer Science and Information Technology (IJACSIT), 2(3), 25-34. Retrieved
September 4, 2014, from http://papers.ssrn.com/abstract=2376191
Lichman, M. (2013). UCI Machine Learning Repository. Irvine, CA:
University of California, School of Information and Computer Science. Retrieved from: http://archive.ics.uci.edu/ml
chromosomal abnormalities. Genetics in Medicine, 12(11), 742-745. doi:10.1097/GIM.0b013e3181f8baad
Masud, M., Gao, J., Khan, L., Han, J., & Thuraisingham, B. M. (2011). Classification and novel class detection in concept-drifting data streams under time constraints. IEEE Transactions on Knowledge and Data Engineering, 23(6), 859-874. doi:10.1109/TKDE.2010.61
Mourão-Miranda, J., Hardoon, D. R., Hahn, T., Marquand, A. F., Williams, S. C. R., Shawe-Taylor, J., & Brammer, M. (2011). Patient classification as an outlier detection problem: An application of the One-Class Support Vector Machine. NeuroImage, 58(3), 793-804. doi:10.1016/j.neuroimage.2011.06.042
Noto, K., Brodley, C., & Slonim, D. (2012). FRaC: A feature-modeling approach for semi-supervised and unsupervised anomaly detection. Data Mining and Knowledge Discovery, 25(1), 109-133. doi:10.1007/s10618-011-0234-x
Rousseeuw, P. J., & Hubert, M. (2011). Robust statistics for outlier detection. Wiley Interdisciplinary Reviews: Data Mining and Knowledge Discovery, 1(1), 73-79. doi:10.1002/widm.2
Salvador, S., & Chan, P. (2005). Learning states and rules for detecting anomalies in time series. Applied Intelligence, 23(3), 241-255.
doi:10.1007/s10489-005-4610-3
Sammut, C., & Webb, G. I. (Eds.). (2011). Encyclopedia of Machine Learning. Springer Science & Business Media.
Singhal, S., Gankotiya, A. K., Agarwal, S., & Verma, T. (2012). An investigation of wireless sensor network: A distributed approach in smart environment. Advanced Computing & Communication Technologies (ACCT), 2012 Second International Conference on, Rohtak, Haryana, 2012, pp. 522-529. doi:10.1109/ACCT.2012.22
Sugiyama, M., & Borgwardt, K. (2013). Rapid distance-based outlier
detection via sampling. In C. J. C. Burges, L. Bottou, M. Welling, Z. Ghahramani, & K. Q. Weinberger (Eds.), Advances in Neural Information Processing Systems 26 (pp. 467–475). Curran Associates, Inc.
Tartakovsky, A. G., Polunchenko, A. S., & Sokolov, G. (2013). Efficient computer network anomaly detection by changepoint detection methods. IEEE Journal of Selected Topics in Signal Processing, 7(1), 4-11.
doi;10.1109/JSTSP.2012.2233713
Thangavel, K., & Mohideen, A. K. (2010). Semi-supervised k-means clustering for outlier detection in mammogram classification. Trendz in
Information Sciences Computing (TISC), 2010 (pp. 68-72). Presented at the Trendz in Information Sciences Computing (TISC), 2010.
doi:10.1109/TISC.2010.5714611
Volpi, M., Tuia, D., Bovolo, F., Kanevski, M., & Bruzzone, L. (2013). Supervised change detection in VHR images using contextual information and support vector machines. International Journal of Applied Earth Observation and Geoinformation, 20, 77-85. doi:10.1016/j.jag.2011.10.013
Xue, Z., Shang, Y., & Feng, A. (2010). Semi-supervised outlier detection based on fuzzy rough C-means clustering. Mathematics and Computers in Simulation, 80(9), 1911-1921. doi:10.1016/j.matcom.2010.02.007
Zamoner, F. W., & Zhao, L. (2013). A network-based semi-supervised outlier detection technique using particle competition and cooperation. Intelligent Systems (BRACIS), 2013 Brazilian Conference on (pp. 225-230).
doi:10.1109/BRACIS.2013.45
Zhang, Y., Hamm, N. A. S., Meratnia, N., Stein, A., van de Voort, M., & Havinga, P. J. M. (2012). Statistics-based outlier detection for wireless sensor networks. International Journal of Geographical Information Science, 26(8), 1373-1392. doi:10.1080/13658816.2012.654493