Copyright © 2010 Frederick Furness Publishing www.ondrugdelivery.com 21 Formulators start their task by gaining an
under-standing of the bulk drug’s physical and chemi-cal properties. Once the pharmaceutichemi-cal profile of the drug has been determined, the appropriate route of administration can be identified and designed. Next we develop preclinical for-mulations, which overcome the drug’s innate deficiencies. For example, a poorly soluble drug might require solubilising additives, and a poorly bioavailable drug might require a perme-ability enhancer.
Additional excipients are selected to over-come potential problems in processing, manufac-turing and stability. Bench studies are performed on pilot batches to establish the efficacy, manu-facturability and stability of dosage forms. The final formulation design is optimised to take into account the pharmacokinetic properties of absorp-tion, distribuabsorp-tion, metabolism, and excretion.
These steps in the drug development proc-ess are common to all routes of administration. However, this article covers only the develop-ment of oral dosage formulations.
Oral formulation has been the preferred and most common route of delivery around the globe owing to its ease of administration and good patient compliance. And from a drug develop-ment and manufacturing perspective, an oral formulation offers superior stability compared with intravenous formulations. Developing an oral formulation is by no means an easy task because each drug substance is a different entity with different characteristics.
To standardise oral formulation develop-ment, the US FDA published the biopharma-ceutical classification system (BCS) guidance in 2000, which formed the basis of the sci-entific framework used for classifying drug
substances based on their aqueous solubility and intestinal permeability.1
The biopharmaceutical classification sys-tem was developed primarily in the context of immediate release (IR) solid oral dosage forms. It is a drug development tool that allows estima-tion of the contribuestima-tions of three major factors – dissolution, solubility and intestinal perme-ability – that affect oral drug absorption from IR solid oral dosage forms. The classification is associated with a drug dissolution and absorp-tion model that identifies the key parameters controlling drug absorption as a set of dimen-sionless numbers: the absorption number, the dissolution number and the dose number.
According to the BCS, there are four classes of drug substances based solely on their solubil-ity and intestinal permeabilsolubil-ity:
Class I: High Solubility – High Permeability Class II: Low Solubility – High Permeability Class III: High Solubility – Low Permeability Class IV: Low Solubility – Low Permeability
Class I drugs exhibit a high absorption number and a high dissolution number. The rate-limiting step is drug dissolution; if dissolu-tion is very rapid, then the gastric emptying rate becomes the rate-determining step. Metoprolol, diltiazem, verapamil, and propranolol are exam-ples of Class I drugs.
Class II drugs have a high absorption number but a low dissolution number. In vivo drug dis-solution is then a rate-limiting step for absorption except at a very high dose number. The absorp-tion rate for Class II drugs is usually slower than the rate for Class I drugs and absorption occurs over a longer period. Phenytoin, danazol,
The objective of drug formulation is to develop a product with the correct amount of drug in the right form, and to maintain its chemical and biological integrity for delivery at or over the proper time, at the proper rate, and in the desired location. SRI International’s approach to drug formulation is customised according to the client’s needs and the stage of development. This article by Gita Shankar, PhD, Director of Formulations R&D, Pharmaceutical Sciences at SRI, describes the strategy that the company uses to develop an appropriate formulation.
THE RIGHT FORMULATION –
AND HOW TO GET THERE
Gita Shankar, PhD
Director of Formulations R&D, Pharmaceutical Sciences T: +1 650 859 2000 F: +1 650 859 3041 E: [email protected] SRI International 333 Ravenswood Avenue Menlo Park CA 94025 United States www.sri.com/biosciences
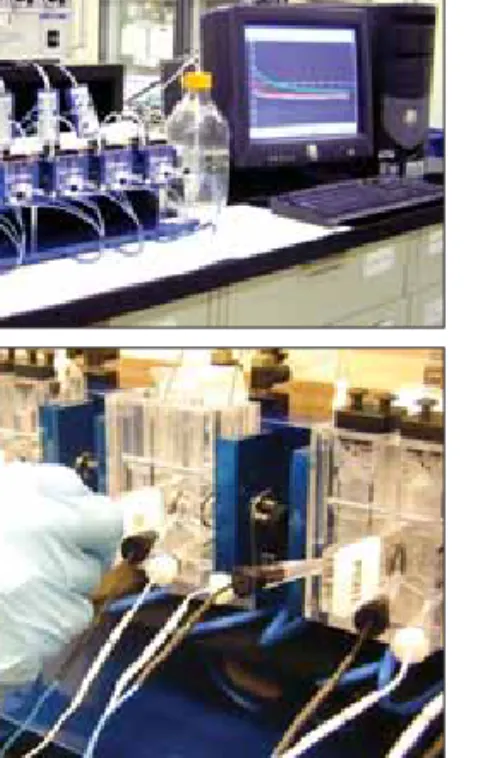
Figure 1: High Throughput Liquid Handling System.
ORAL Apr 2010.indd 21
www.ondrugdelivery.com Copyright © 2010 Frederick Furness Publishing 22
ketoconazole, mefenamic acid, and nifedipine are examples of Class II drugs. In vitro-in vivo correlation (IVIVC) is usually expected for Class I and Class II drugs.
For Class III drugs, permeability is the rate-lim-iting step for drug absorption. These drugs exhibit a high variation in the rate and extent of drug absorption. Cimetidine, acyclovir, neomycin B and captopril are examples of Class III drugs.
Class IV drugs exhibit a many characteristics that are problematic for effective oral administra-tion. A decade back, extreme examples of Class
IV compounds were an exception rather than the rule, yet today about 10% of the drug candidates under development fall into this category. A well-known example of a Class IV drug is paclitaxel.
PROPRIETARY HIGH-THROUGHPUT SOLUBILITY SCREENING SYSTEM
In recent years, there has been an increase in the drugs that fall into BCS Classes II, III and IV. Of these, Class II and IV pertain to drugs that are poorly water soluble. Currently, more than
one-third of the drugs listed in the US Pharmacopoeia are poorly water soluble. Poor solubility leads to sig-nificant hurdles in the oral absorption and bioavailability of the drug candi-date by decreasing its dissolution rate and membrane permeation.
SRI has developed its own pro-prietary solvent screening system, which is both economical and fast. This system, which we call the High-Throughput Solubility Screening (HTSS) system, uses minimal drug quantities, since in its early devel-opment stages, availability of the drug is limited.
Our proprietary screening sys-tem is based on a High-Throughput Liquid Handling Instrument (see figure 1) which is used to prepare the excipient combinations. This instrument is programmed for aspi-rating and dispensing the solvents/ excipients. A predetermined volume of the cosolvent combinations are dispensed into each well in a micro-titer plate. After solvent addition, the plates are shaken in a controlled environment for an extended period. Levels of solubility are read using the baseline turbidity of the excipi-ent. A software program is used to control the solvent combinations and the analytical outputs. Different level screens of solvent combinations are available to address different formulation options. A stock solution of the drug is prepared either in absolute alcohol or DMSO and added into plates prefilled with the premixed cosolvent combinations. The plates are again shaken and analysed using the turbid-ity reader. Solubilturbid-ity is assessed by the change in turbidity before and after addition of the drug in the solvent system.
Figure 2: Solvent combinations (SRI’s Level 1 screen) used for the paclitaxel solubility study. (Concentrations: ethanol X%v/v in water; water 100%; PEG400 100%; propylene glycol Y%v/v in water; Tween80 Z%v/v in water, and glycerin A%v/v in water).
Binary Combinations (1:1) Ternary Combinations (1:1:1)
Solvent Combination Abbreviation Solvent Combination Abbreviation
Ethanol / Water Eth Wat Ethanol / Water / PEG400 Eth Wat PEG Ethanol / PEG400 Eth PEG Ethanol / Water / Propylene Glycol Eth Wat PG Ethanol / Propylene Glycol Eth PG Ethanol / Water / Tween80 Eth Wat Twe Ethanol / Tween80 Eth Twe Ethanol / Water / Glycerin Eth Wat Gly Ethanol / Glycerin Eth Gly Ethanol / PEG400 / Propylene Glycol Eth PEG PG Water / PEG400 Wat PEG Ethanol / PEG400 / Tween80 Eth PEG Twe Water / Propylene Glycol Wat PG Ethanol / PEG400 / Glycerin Eth PEG Gly Water / Tween80 Wat Twe Ethanol / Propylene Glycol / Tween80 Eth PG Twe Water / Glycerin Wat Gly Ethanol / Propylene Glycol / Glycerin Eth PG Gly PEG400 / Propylene Glycol PEG PG Ethanol / Tween80 / Glycerin Eth Twe Gly PEG400 / Tween80 PEG Twe Water / PEG400 / Propylene Glycol Wat PEG PG PEG400 / Glycerin PEG Gly Water / PEG400 / Tween80 Wat PEG Twe Propylene / Glycol / Tween80 PG Twe Water / PEG400 / Glycerin Wat PEG Gly Propylene Glycol / Glycerin PG Gly Water / Propylene Glycol / Tween80 Wat PG Twe Tween80 / Glycerin Twe Gly Water / Propylene Glycol / Glycerin Wat PG Gly
Water / Tween80 / Glycerin Wat Twe Gly PEG400 / Propylene Glycol / Tween80 PEG PG Twe PEG400 / Propylene Glycol / Glycerin PEG PG Gly PEG400 / Tween80 / Glycerin PEG Twe Gly Propylene Glycol / Tween80 / Glycerin PG Twe Gly
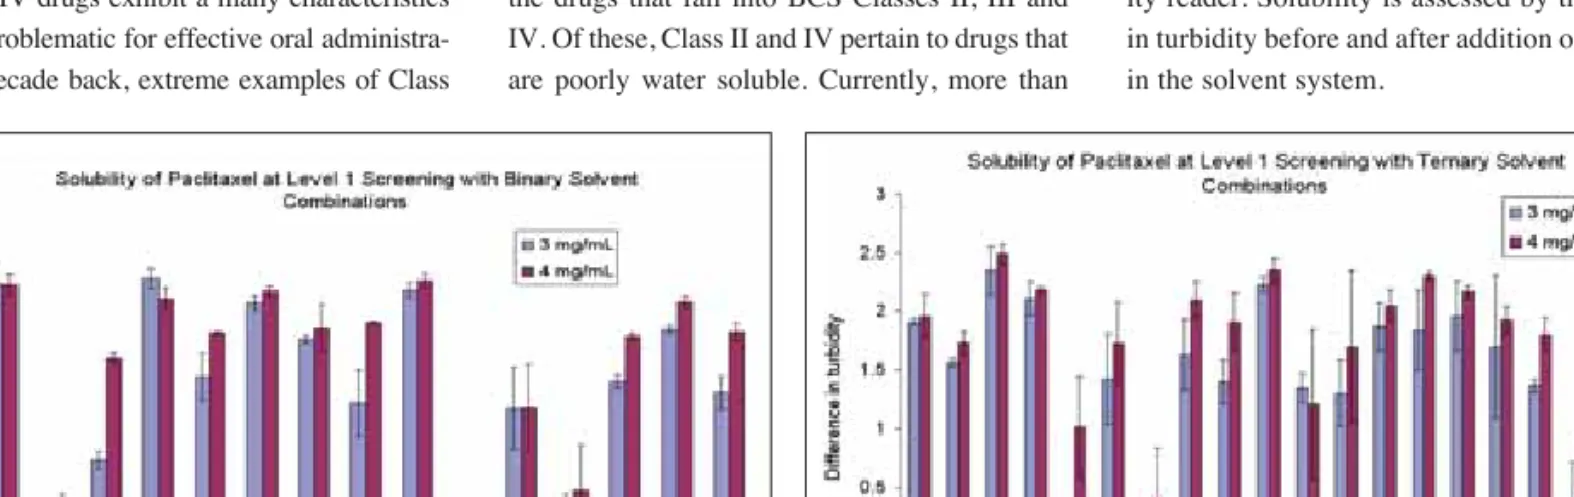
Figure 3: Solubility of paclitaxel (3 and 4mg/mL) with binary combinations of six solvents
Figure 4: Solubility of paclitaxel (3 and 4 mg/mL) with ternary combinations of six solvents
ORAL Apr 2010.indd 22
Copyright © 2010 Frederick Furness Publishing www.ondrugdelivery.com 23 The following is an example of the strategy
employed in developing a formulation for a model drug substance, in this case, paclitaxel.
SRI EXAMPLE
A total of 35 solvent combinations (listed in figure 2) were generated by the software using the six solubilising excipients in binary and ternary combinations at a 1:1 and 1:1:1 ratio, respectively. Paclitaxel stock solutions were prepared in absolute ethanol and dispensed into each of the micro-titer plates containing solvent combinations to obtain the desired final concentrations of 3 and 4 mg/mL. Turbidity was measured using the plate reader.
Figures 3 and 4 show the solubility profiles of paclitaxel in both binary and ternary combi-nations as obtained from the HTSS. In these fig-ures, the longer bars represent more turbidity in the formulation. Based on this analysis, we were able to narrow down a few cosolvent-based formulations options for paclitaxel, which were then tested in a pharmacokinetic study.
PROPRIETARY IN VITRO PERMEATION SYSTEM
Although Class III and Class IV drugs are poorly absorbed substances, in recent times there has been an increase in drug products falling into these categories owing to newer formulation options. Class III compounds are drug substances that are sometimes highly water
soluble, but they do not have the appropriate hydrophobic-hydrophilic balance to be absorbed by the intestinal epithelium.
Developing an oral formulation for these compounds sometimes requires imparting the right hydrophobic-hydrophilic balance to improve the GI-permeation of the drug. In this step in the drug development process, SRI uses an in vitro screen known as the Ussing Permeation System to rank-order formulations on the basis of their permeability.
The system at SRI is a modified Ussing system (shown at the top of figure 5) that has multiple sets of side-by-side chambers and is used for in vitro studies. Each set consists of two side-by-side diffusion chambers, a heating block for temperature control, needle valves for gas flow adjustment and gas mixing, and Ag/AgCl voltage and current electrodes for measuring transepithelial voltage and for passing current.
Harvested segments of small intestine or colon are mounted on sliders placed between the two horizontal chambers of the modified Ussing system (bottom of figure 5). One of the chambers is exposed to the mucosal side of the intestinal segment and the other to the serosal side.
For drug transport across epithelial mem-branes of harvested rat small intestine and colon segments in the mucosal-to-serosal (M-to-S) direction, aliquots of buffer are added to both the mucosal and serosal chambers. The buffer in the mucosal chamber is replaced with a solution of the drug formulation. Aliquots of buffer solutions are removed periodically from the serosal cham-bers and are replaced with equal volumes of fresh warm buffer previously saturated with 100% O2.
Changes in transepithelial short-circuit cur-rent (in micro-Amps) and membrane resistance (in Ohms) as a function of time are monitored continuously during in vitro studies to serve as indicators of tissue viability and drug perme-ability, respectively.
The buffer samples from the receptor cham-bers are analysed for drug content on a high pressure liquid chromatograph (HPLC). Owing to the expected variation for in vitro test condi-tions and harvested rat intestinal segments, four replicates are used per experimental condition.
Apparent Permeability Coefficient (Papp)
Calculation:
To compare data obtained from different in vitro experiments, the apparent permeability coeffi-cients are calculated using the equation:
Papp = dQ / dt C0 × A
where dQ/dt is the linear appearance rate of mass in the receiver compartment, C0 is the
ini-tial solute concentration in the donor compart-ment, and A is the surface area.2
The following is an example of the strategy employed in developing a formulation for a model BCS Class III drug substance.
SRI EXAMPLE
Figures 6, 7 and 8 illustrate this strategy for a poorly permeable drug substance. The plot between the amount of drug transported through the different regions of the intestine from the mucosal to the serosal side for the drug at a given concentration and formulation is presented in figure 6.
The cumulative amount of drug trans-ported through jejunum fragments of the intestine from the mucosal to the serosal side Figure 5: Top: Ussing absorption unit;
Bottom: Slider with the intestinal tissues being mounted between the side-by-side compartmental unit of the Ussing system.
Figure 6: Drug transport in the mucosal-to-serosal direction, across different segments of rat intestine and colon, from buffer.
Figure 7: Effect of drug concentration on transport in the mucosal-to-serosal direction across rat jejunum, from buffer.
Figure 8: Effect of a known Pgp inhibitor on drug transport in the mucosal-to-serosal direction across rat jejunum.
ORAL Apr 2010.indd 23
www.ondrugdelivery.com Copyright © 2010 Frederick Furness Publishing at increasing drug dose concentrations
(in the same formulation), is shown in figure 7.
Figure 8 presents data obtained from using a Pgp (permeability glycoprotein) inhibitor, which was placed either on the mucosal side or on the serosal side, compared with that without at inhibitor. In this figure, the dose, formulation, and kind of intestinal segment used are constant. Similar data compilation continues until all conditions and for-mulation options are covered.
Based on calculated Papp values (data not shown) obtained from in vitro data, the rate of M-to-S transport of drug was found to be highest in jejunum, followed by colon and ileum, and lowest in duodenum (fig-ure 6). Increasing the concentration of drug in the mucosal (donor) chamber increased M-to-S transport of drug in a dose-dependent manner (figure 7). Increased M-to-S transport of drug was observed in vitro, when a known Pgp inhibitor was added to the mucosal or serosal chambers. Addition of a known Pgp inhibitor to the serosal chamber caused a dra-matic (three-fold) increase in M-to-S transport of drug. Addition of inhibitor to the mucosal chamber also increased M-to-S transport of drug, but to a lesser extent (figure 8).
The above observations are indicative of the significant role of presystemic elimina-tion processes in poor permeaelimina-tion of drug across the GI tract. The secretory transport-ers involved may include Pgp, the family of multi-drug-resistance-associated proteins (MRP), and possibly other transporters operat-ing across the GI tract.
SRI’s strategy is to study the permeation properties of the drug substance in vitro with and without added permeation and solubility enhancers. Experiments are also conducted in the presence and absence of inhibitors of efflux proteins (glycoproteins that pump out the absorbed drugs through independent pathways, resulting in a net decrease in the amount of drug in the serosal side). If the drug substance is found to be influenced by the efflux proteins, the formulation strategy will include inhibition of those proteins.
IN SITU PHARMACOKINETIC DATA BY INTRA-DUODENAL ADMINISTRATION IN RATS
Once the in vitro permeation data has been obtained, we determine the pharmacoki-netic parameters of the drug in the presence of various formulation additives/permeation enhancers upon intra-duodenal administration
in rats. The in situ absorption of the drug in the presence of the various additives and enhanc-ers and upon intra-intestinal administration is evaluated in healthy rats. The rats are fasted overnight and anaesthetised so that the abdo-men can be opened for isolation of GI tract. Ligatures are placed above the mid-duodenum and below the mid-jejunum, and an intestinal dosing receptacle is created; the drug is then administered into the lumen of intestine by injecting formulation compositions at mid-duodenum level. Blood samples are collected pre- and post-dose, processed for collection of plasma, and analysed by LC-MS.
Selection of formulation additive combina-tions is based on the Papp values obtained from comparative in vitro studies. The absorption of the drug is determined by calculating the area under the plasma drug concentra-tion versus time curve (AUC). Based on the results from in vitro and in situ studies, AUC values obtained are compared with the corresponding Papp values calculated using in vitro experimental data. Figure 9 is a bar graph comparing the AUC values with their corresponding Papp values for the different compositions studied.
In vitro studies using the Ussing system may be useful for determining the preferen-tial site of drug absorption for BCS Class III/ IV drugs, and for screening and selection of formulation additives as permeation enhanc-ers. In situ studies would further facilitate optimising the concentrations and ratios of additives used, therefore reducing the cost and number of in vivo evaluations for for-mulation optimisation. In vitro-in situ cor-relations performed in our laboratories have indicated that it is difficult to predict the in vivo performance of different formulation additives solely based on in vitro transport studies using isolated intestinal segments at higher concentrations of permeation enhanc-ers or when paracellular transport is the mode of drug absorption.
CONCLUSION
Now is the time for integrating high-throughput experimental techniques into the preformulation and formulation steps in the drug discovery process. Companies are screening larger numbers of drug can-didates than ever before, and the decision to choose one drug candidate over anoth-er has become more complicated because increasing numbers of these drugs fall into BCS Classes II to IV.
The decision to choose a poorly solu-ble drug over a more solusolu-ble counterpart may be required for improved efficacy and safety, if the formulation can address the solubility issues. In drug discovery, time is of essence, and a fast in vitro method is required to screen the drug in the formulation alongside the drug itself.
No longer is it the drug alone, but the drug in combination with its formulation additives, that determine the probability of success for that molecule. SRI International has successfully used the above strategy for many client companies, helping these companies screen out many poten-tial drug candidates at a faster rate. We anticipate that the next few years will see many such time- and resource-saving revolutions in the way we attempt to develop these formulations.
ACKNOWLEDGEMENTS
The author wishes to thank the research-ers of the Formulations Laboratory for con-stantly striving to improve our experimental techniques. Special thanks to Helen J. Parish (Senior Director, Pharmaceutical Sciences, Biosciences Division) and Dr Walter H. Moos (Vice-President, Biosciences Division) for discussions and critical input in the strat-egy presented in this article. Thanks also to Janice Schindler-Horvat (Senior Director, Marketing, Biosciences Division) for helping with this article.
REFERENCES:
1. Amidon GL, Lennernas H, Shah VP, Crison JRA. “A Theoretical Basis for a Biopharmaceutic Drug Classification: The Correlation of In Vitro Drug Product Dissolution and In Vivo Bioavailability.” Pharm Res. 1995;12: 413-420.
2 Luo FR, Paranjpe PV, Guo A, Rubin E, Sinko P. “Intestinal transport of irinote-can in Caco-2 cells and MDCK II cells overexpressing efflux transporters Pgp, cMOAT, and MRP1.” Drug Metab Dispos 2002;30(7):763-770.
24
Figure 9: AUC versus Papp values obtained for different drug formulations
ORAL Apr 2010.indd 24
SRI International Biosciences Toll Free: 866.451.5998 [email protected] www.sri.com/ondd
SRI International
Biosciences
L E V E R A G E O U R E X P E R I E N C E F O R Y O U R S U C C E S S
S
Safety, Drug Metabolism
& Pharmacokinetics
Preclinical Development
Planning & Regulatory Services
Pharmacology, Efficacy
& Predictive ADMET
Taking you from
Idea to IND
®
Formulation,
Chemistry,
Manufacturing &
Controls
Preformulation
Formulation Development
Analytical Method Development
Clinical Manufacturing
Stability Studies
P
R
E
C
L
I
N
I
C
A
L
S
E
R
V
I
C
E
S
ORAL Apr 2010.indd 25