Comparing Achievement of Intended Learning Outcomes
in Online Programming Classes with Blended Offerings
Waleed Farag, Ph.D.
Indiana University of Pennsylvania
Computer Science Department
Indiana, PA 15705
+1 (724)357-7995
[email protected]
ABSTRACT
In the past decade, there has been a noticeable increase in the number of courses/programs offered online by higher education institutions in US and worldwide. This increase makes it necessary to comprehensively study the effectiveness of these offerings to ensure that they yield comparable outcomes to traditional offerings. This research discusses findings of a multi-year, in-depth quantitative study with the objective of assessing the effectiveness of delivering computer programming courses online and analyzing the quality of this delivery mechanism. The paper addresses several aspects of comparing tradition/blended offerings with fully online offerings. Several data sets are used in this study with primarily focus on direct assessments. Specifically, this research measures the Intended Learning Outcomes (ILOs) attained by students enrolled in online programming classes and compares them to the ILOs obtained when teaching the same course in a blended format. Moreover, several other students’ success and involvement indicators are measured in both cases and compared. Besides, the paper briefly addresses other indirect assessment findings. The employed data sets have been collected over a number of years (from 2006 till 2011) to enhance the accuracy and implications of the reported statistical findings. Generally, no significant differences were found regarding the attainment of almost all of the ILOs with the exception of one that showed better performance, on average, in the online offerings. On the other hand, blended offerings yielded favorable results that are statistically significant when considering other performance criteria such as withdrawal and failure rates.
Categories and Subject Descriptors
K.3.2 [Computers and Educations]: Computer and Information Science Education - computer science education, self-assessment.
General Terms
Measurement, Performance.
Keywords
Intended learning outcomes, Performance evaluation of learning, Student’s achievements.
1.
INTRODUCTION
With the availability of current technologies, online delivery of various course contents has become practical; therefore, there have been many recent attempts to deliver programming courses online by a number of institutions. This trend has been welcomed by higher education institutions and students alike. On one hand, the educational institutions see several advantages of online course delivery including increased enrollment, reduced cost and expanded outreach. All of these are very appealing pros for higher education especially in light of the many financial challenges facing higher education in general and public higher education in particular. On the other hand, students positively view online delivery as a flexible way of obtaining college credits. In fact many non-traditional students consider online courses and programs as their only way of finishing their programs or having access to graduate school in order to enhance their professional development.
There is no doubt that the introduction of online delivery has many influential impacts on the IT education and the transfer of knowledge. Many top schools have recently initiated online courses and programs with several of them open to public. A recent example is a joint initiative between Harvard University and Massachusetts Institute of Technology called edX [11]. EdX is a free massively open online course system that allows students from all over the world to take free courses offered by both universities. These are indicative that online delivery is on the rise in both traditional college course offerings and the open education domain. Moreover, such attempts make use of some inherit and powerful features of online delivery such as having no geographical boundaries.
With the wide-spread proliferation of online delivery several important questions emerge which require effective and scientific answers. Is this delivery mechanism effective? Are courses offered online suitable for everyone? What are the impacts of this spread on higher education? These are just some examples but probably the most important question to be answered is: Do these online courses yield comparable Intended Learning Outcomes (ILOs) to traditional offerings? The last question is especially important in the IT field where some students already report difficulties with traditional courses and their contents.
This work discusses a sub-set of the findings of a long-term research study that has the objective of fully investigating the usefulness of delivering introductory computer programming courses online and assessing the quality of such offerings. This paper focuses on presenting the results of direct assessment of the Intended Learning Outcomes (ILOs) of the online course in
comparison with the ILOs achieved in blended courses. Appropriately measuring the ILOs of the course provides reliable indicators to the success of the course and to whether students have attained the expected outcomes or not. In addition, several other direct assessment performance metrics are analyzed and compared. The paper also succinctly reports on the findings of other indirect assessment analyses such as the measurement of student perception of online delivery and the comparison of students’ satisfaction in both delivery mechanisms. This study employs extensive data sets collected from classes offered over a period of six years. It is believed that the use of such large and extended data has considerably contributed to the reliability and significance of the reported results. A brief review of related work in online delivery of programming contents follows.
There have been many attempts to deliver computer programing courses online and among the pioneer ones was a junior-level programming course described in [14]. That study was concluded by reporting a set of lessons learned. Other recent ones are presented in [1, 7, 12] where the authors have reported on their experience teaching online programming courses and presented suggestions to improve such offerings.
Edwards et al. [4] presented the results of comparing students’ perception of pair programming in face-to-face (f2f) and online courses and reported significant difference between the two groups in which students preferred the f2f modality. In [9] a blended design to an Engineering Materials course was introduced and very primitive results showing students’ satisfaction were presented. Warren et al. [15] published the results of studying student satisfaction with an online homework generation modules added to an electrical Engineering course. The results of that study addressed only students’ perception of the modified course and only provided simple quantitative findings without further analysis of whether these findings are significant or not. The quality of student experience was assessed in [8]. Miles [10] compared students’ satisfaction and success in traditional and online classes. That study found no significant difference in students’ satisfaction but reported that online students scored significantly lower grades than traditional ones. That study was done over one semester and used very limited sample size. In [3] interesting comparative study of three instruction modalities was presented. Although this research presented some useful findings, the limitation of the study time and sample sizes are of concern. Although some researchers have considered the importance of assessing online offerings, as described above, many of these studies focused only on using indirect measures of course success such as students’ perceptions and satisfaction. However, it is more important to conduct comprehensive studies that directly measure the degree of students’ attainment of the course ILOs in order to have more robust view of the success of online courses. The direct assessment of the ILOs, the use of multi-year, diverse data sets, and the in-depth statistical analyses represent the main contributions of this study. Below is a brief description of our study followed by sections reporting on the results of comparing several performance parameters.
2.
DESCRIPTION OF THE STUDY
The findings presented in this paper are the results from an experimental study that mainly uses direct assessment of a number of performance parameters to compare two groups. The first (control) group data were collected from fourteen different
sections of our first programming course (CS1) which is taken by computer science majors and other related majors. Our CS1 is a conventional introduction to programming that emphasizes functional programming and algorithm design. Topics covered range from introductory ones such as arithmetic operations and decision making then advance to structured data types and recursion. These fourteen sections were taught in the period between 2006 and 2011 where 347 students enrolled in them. The course was offered in a blended format where the f2f component of the course is preserved via weekly class and laboratory sessions. The blended flavor was achieved by moving a number of class activities online including project submission and exams in addition to a comprehensive set of course materials. WebCT was used first then our institution switched to Moodle as the chosen Learning Management system (LMS).
The experimental group data were collected from five sections of the same course taught fully online during 2010 and 2011 and enrolled 104 students. The online course has the same exact course objectives and its contents are identical to the blended course with the exception that there was no f2f interaction between the instructor and students. Rather, all class activities were conducted online. The syllabus of the online course provides a comprehensive coverage of all class policies, expectations and course contents. Large sets of online course materials are posted online in addition to various activities. Course activities include asynchronous ones such as discussion forums in addition to light use of synchronous activities such as chatting. The syllabus also fully describes the set of assessment tools used in such course. In designing the experiments, special attention has been made to ensure the homogeneity of the study and to exclude extraneous factors. For instance, we tried our best to make sure that course contents, facilitator, and assessment methods are identical in both offerings (the blended and the online ones). The following section presents the methodologies, the analyses and the findings obtained from comparing the ILOs in both groups.
3.
COMPARING COURSE INTENDED
LEARNING OUTCOMES
The course syllabus lists nine learning objectives. These objectives were mapped into four main Intended Learning Outcomes (ILOs) that the student needs to acquire/exhibit upon completion of the course. These outcomes address several categorizes of the Bloom’s taxonomy of cognitive levels. Our data analyses will focus on these four main ILOs, mentioned below:
1. Put into practice effective use of an Integrated Development Environment to edit, compile, and run programs (O1). 2. Demonstrate the ability to develop algorithms from problem
specification and apply various structured programming techniques to proficiently transform them into programming code (O2).
3. Illustrate the ability to use debugging and testing techniques to locate and fix errors to ensure program correctness (O3). 4. Recognize the proper use of the language’s constructs and
apply this knowledge in creating effective programs (O4). Measuring the ILOs is very important because equivalent ILOs in both groups signify that both student populations have acquired comparable knowledge and skills upon completion of the course. As part of ABET -Accreditation Board for Engineering and Technology- accreditation requirements, our department
continues, after being accredited, the assessment of its courses. Therefore, a model called EAMU proposed in [5] was adopted by our department in its assessment procedure and is also adopted in this research in order to quantify students’ achievement of the ILOs. In our experiments, the above-mentioned four course ILOs were measured by computing the EAMU vector for each outcome. Specifically, for each outcome, a set of course graded activities are selected as a measure for this particular outcome. Each student’s achievement in this set is measured to come up with a percent value indicating how well a student attains such an outcome. Then, a number of thresholds were used to differentiate Exemplary (E), Adequate (A), Minimal (M), and Unsatisfactory (U) performance. This procedure is applied to the four outcomes and on every student in the course to derive EAMU vectors for the ILOs. For example, in a blended offering of this course in spring 2011, the computed EAMU vector for the first outcome (O1) is [16, 3, 1, 2] meaning that among the 22 students who passed the course, 16 exhibit exemplary attainment of outcome 1, 3 at the adequate level, one minimal and 2 unsatisfactory. These computed EAMU vectors are analyzed in details in the following sub-sections.
3.1
EAMU Vectors as Categorical Data
In this subsection, our statistical analyses [6, 13] deal with the data as categorical ones in which we consider the attainment of an ILO as a categorical variable that can take one of four different values (E, A, M, or U). All computed EAMU vectors for all ILOs in both the online and the blended classes are weighed to form the contingency table shown in Table 1. To statistically analyze the relationship between the control and the experimental groups, the Pearson’s square test was used. Results of applying the chi-square test on each of the four studied outcomes are given in Table 2.
Table 1. Contingency table showing the number of students receiving E, A, M, and U in the two groups Delivery EAMU O1_
weight O2_ weight O3_ weight O4_ weight Blended E 192 105 117 45 Blended A 31 94 72 139 Blended M 11 31 27 44 Blended U 19 23 37 25 Online E 33 22 24 16 Online A 5 10 9 17 Online M 3 8 3 8 Online U 3 4 8 3
Table 2. Chi-square test results for all four outcomes
Outcome X2 df p odds ratio O1 0.54 3 .91 1.05 O2 3.86 3 .28 0.71 O3 2.29 3 .52 0.72 O4 8.58 3 .035 0.39
Based on the results listed in Table 2 (where: X2 is the chi-square test value, df is the degree of freedom, and p is the 2-sided test significance), the test statistic for Outcome 2 (O2) can be interpreted as follows: there was no significant association between the delivery mechanism and whether or not students can demonstrate the ability to develop algorithms and implement them from problem specifications, X2 (3) = 3.86, p = 0.28. This finding was also supported by the computed odds ratio, 0.71, which indicates that the odds of students performing at the exemplary level in the blended class were only 0.71 times if they were taking the online class. It is worth noting that the chi-square test yielded non-significant results also for both outcomes 1 and 3. For outcome 4, there was a significant association between the delivery mechanism and the ability of the students to recognize the proper use of various language’s constructs and apply this knowledge in creating effective programs, X2 (3) = 8.58, p < 0.05. This finding was also confirmed by the computed odds ratio, 0.39 which indicates that the odds of students performing at the exemplary level in the blended class were 0.39 times if they were taking the online class. To summarize these interested findings, there was no significant difference between the two delivery mechanisms in the first three outcomes (O1–O3) but outcome 4 has significant difference. Interestingly enough, the difference found in O4 indicated that students taking the online class have better chances achieving that outcome than those taking the blended one, see Table 2. It is worth noting that the odds ratio was computed by considering the E values versus all three other levels. Besides, the chi-square test assumptions are fulfilled including that expected frequency constraint in which all cases have only one or two cells with expected values less than 5 which still give acceptable statistical power for the test [6].
3.2
Using t-test to Compare ILOs Attainment
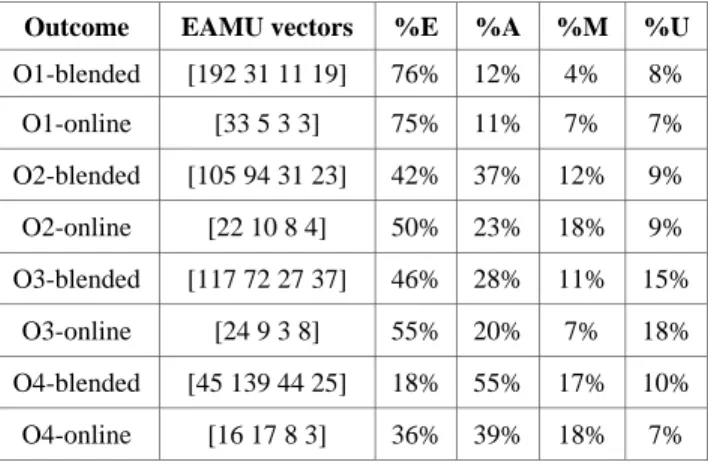
In order to confirm the interesting findings in the previous subsection, the obtained EAMU vectors data are analyzed differently in this section. First, all computed EAMU vectors for each delivery method are accumulated to produce a single EAMU vector. The blended course was offered in eight different academic semesters (253 passing students) while the online course was offered five times including two during summer sessions (44 passing students). The accumulated EAMU vectors for each outcome along with the percentage of each level are listed in Table 3 for both delivery methods
.
Table 3. Accumulated EAMU vectors and percentages Outcome EAMU vectors %E %A %M %U
O1-blended [192 31 11 19] 76% 12% 4% 8% O1-online [33 5 3 3] 75% 11% 7% 7% O2-blended [105 94 31 23] 42% 37% 12% 9% O2-online [22 10 8 4] 50% 23% 18% 9% O3-blended [117 72 27 37] 46% 28% 11% 15% O3-online [24 9 3 8] 55% 20% 7% 18% O4-blended [45 139 44 25] 18% 55% 17% 10% O4-online [16 17 8 3] 36% 39% 18% 7%
The percentages in Table 3 show comparable values for corresponding EAMU levels in both mechanisms with the exception of O4 where online class has 36% for E level compared to 18% in the blended one. To further investigate these preliminary trends and verify their statistical significance, the following analyses were performed. For each semester in which the course was offered, an overall EAMU vector is computed for each outcome. Then, each EAMU vector is transformed to a scalar value that indicates the degree of achievement of this outcome in this offering. The transformation is accomplished by using a proposed weighted sum formula, see equation 1, that places increasingly higher weights on good performance (A and E) while penalizes marginal and unsatisfactory performance by assigning them diminished weight values. The formula is normalized to the number of students (N) in the offering to produce a comparable scale. For each semester, we have a value that expresses the degree of attainment of an outcome and we would like to compare the average of these values for blended offerings with the average for the online offerings. A straightforward statistical method is to use the Independent Samples t-Test provided that the data satisfy the parametric test assumptions. To test the normality and homogeneity of variance assumptions the Shapiro-Wilk and Levene’s tests are used and the results are listed in Table 4.
0.05U) 0.15M 0.25A (0.55E N 1 = Outcome(i) (1)
Table 4. Results of parametric assumptions tests Outcome
overall Shapiro-Wilk Levene Statistic
Stat df Sig. Stat df1 df2 Sig. O1-blended 0.96 8 .78 0.60 1 11 .46 O1-online 0.81 5 .09 O2-blended 0.98 8 .98 1.13 1 11 .31 O2-online 0.94 5 .66 O3-blended 0.91 8 .32 2.82 1 11 .12 O3-online 0.93 5 .62 O4-blended 0.92 8 .45 0.86 1 11 .37 O4-online 0.96 5 .82
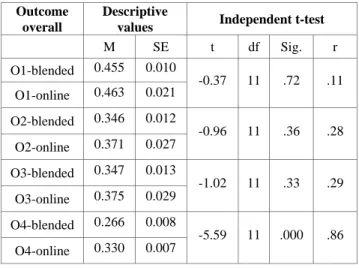
Given that all significant values (p) are larger than 0.05 for both tests in Table 4, one can conclude that the data conform to the parametric assumptions and the independent samples t-test can be used. The detailed results of all t-tests along with descriptive statistics and the computed effect sizes are listed in Table 5 (where: M is the mean, SE is the standard error, t is t-test value and r is the effect size). For outcome 1, on average, students in the online class scored slightly higher in achieving the ILO (O1) (M = 0.463, SE = 0.02) than students taking the blended class (M = 0.455, SE = 0.01). This difference was NOT significant t(11) = -0.37, p > 0.05. Moreover, the effect size (r) is 0.11 which represents a small effect. Similar conclusions can be drawn for both O2 and O3 based on the fact that the t-test produces non-significant results for both outcomes. On the other hand, the t-test yields a significant difference between the two groups for outcome 4. One can conclude that for outcome 4, on average,
students in the online class scored higher in achieving the ILO (O4) (M = 0.330, SE = 0.007) than students taking the blended class (M = 0.266, SE = 0.008). This difference was significant t(11) = -5.59, p < 0.001. Moreover, the effect size (r) is 0.86 which represents a very large effect. These obtained results are in conformance with the ones in section 3.1 where the first three outcomes have no significant differences between the two groups while the last outcome (O4) gives a statistically significant higher average in the online class.
Table 5. Results of independent samples t-test comparisons Outcome
overall
Descriptive
values Independent t-test
M SE t df Sig. r O1-blended 0.455 0.010 -0.37 11 .72 .11 O1-online 0.463 0.021 O2-blended 0.346 0.012 -0.96 11 .36 .28 O2-online 0.371 0.027 O3-blended 0.347 0.013 -1.02 11 .33 .29 O3-online 0.375 0.029 O4-blended 0.266 0.008 -5.59 11 .000 .86 O4-online 0.330 0.007
3.3
MANOVA Analysis of ILOs
In the previous two subsections, the analyses were performed on each outcome individually as a single dependent variable which gave us conclusions about each outcome separately. In order to also consider the correlations that might exist between the studied four dependent variables, Multivariate Analysis of Variance (MANOVA) [13] is used here. First, we need to check if the data satisfy the MANOVA test assumptions.
1. Test of normality: Shapiro-Wilk tests were used for each one of the outcomes individually and all yielded normally distributed data, see Table 4.
2. Homogeneity of variances was also confirmed by Levene’s test results for all four outcomes, see Table 4.
3. Homogeneity of covariance matrices were tested using Box’s test that gives non-significant result M = 18.85 with p = .43, i.e., the assumption is tenable.
Running MANOVA on the four outcomes simultaneously produces between-subject effects test results and significant values identical to the ones obtained in Table 5. Using the Pillai’s Trace, there was a significant effect of the delivery mechanism on the collective attainment of the course ILOs, V = 0.79, F(4, 8) = 7.59, p < .01. The MANOVA test was followed by discriminant analysis to investigate the nature of the relationship between the four dependent variables. The discriminant analysis revealed only one discriminant function which significantly discriminant both groups. According to [2], higher correlational coefficient value indicates that this variable contributes the most to group separation. This is obvious by examining the values of the canonical variate correlation coefficients in the structure matrix (0.06, 0.15, 0.16, 0.87 for O1, O2, O3, and O4 respectively). Outcome 4 has a corresponding variate value of 0.87 while other
outcomes have very small values. One can conclude that the significance of the MANOVA test was mainly the result of the effect produced by the O4 variable while the other lower values in the structure matrix confirm the previous findings that all other outcomes did not differ significantly across the studied groups.
4.
SUCCESS AND INVOLVEMENT
Although measuring and comparing the ILOs in the previous section gives a reliable indicator to the effectiveness of the course, it also helpful to assess other students’ success and involvement criteria. Therefore, in this section, a number of student-related performance criteria are measured and compared across both delivery mechanisms. First, the chances of receiving the highest grade (A), a failure grade (F), and withdrawing from the course (W) are first assessed using simple descriptive statistics then the chi-square test is used to verify whether the observed differences are statistically significant or not. Moreover, statistical comparison of the overall class grade percentage is presented. Lastly, student involvements are also analyzed by measuring and comparing the unitization of online resources.
4.1
Analysis of Chances of Receiving Grade A
The following analysis focuses on comparing grade A rates in both delivery mechanisms. For the blended class, the percentage of A students (the number of students received A grade to the total number of students passed the class: 81/253) is 32% while the corresponding percentage for the online class (21/44) is 48%. It is clear that the rate of receiving A is higher in online classes compared to the blended ones. To ensure the significance of that observation, the chi-square test is used yielding NO significant association between the delivery mechanism and whether or not students can receive a final grade of A in the class X2 (3) = 4.72, p = 0.19. The computed odds ratio is 1.94.
4.2
Chances of Failing the Class
For the blended course, the percentage of failure (the number of students received F grade to the total number of students completed the class: 43/296) is 15%. This percentage (22/66) is 33% for the online class which is obviously much higher (around twice) than the corresponding percentage in the blended course. Chi-square test also confirmed that there was a significant association between the delivery mechanism and failure rates in the class X2 (4) = 16.95, p < 0.01. This finding was also supported by the computed odds ratio, 2.94 which indicates that the odds of students failing the online class were 2.94 times if they were taking the blended class.
4.3
Chances of Withdrawing from the Class
The withdrawal ratio is defined here as the number of students who withdrew from the class to the total number of students who enrolled in the class. For the blended class, the withdrawal percentage from class (51/347) is 15%. In other words, 85% of the students initially enrolled in the class have completed the class and received a final grade. For the online class, the withdrawal percentage (38/104) is 37% which is a much higher rate compared to the blended case. Again, chi-square test was used and it was found that there was a significant association between the delivery mechanism and whether or not students withdraw from the class X2 (1) = 24.1, p < 0.001. This conclusion was also confirmed by the odds ratio, 3.34, indicating that the odds of withdrawal from the online class were 3.34 times the blended case.
4.4
Comparing Overall Percentage Grade
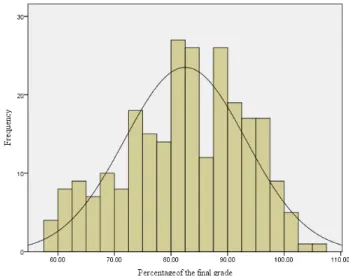
This analysis focuses on comparing the average overall percentage grade in the blended course with the corresponding percentage for the online one. Such a comparison gives us better understanding of whether the delivery mechanism has a role affecting the average overall percentage grade for all students in the class. The null hypothesis states that the distribution of final grade percentages is the same across categories of class delivery. Although the data have homogenous variance, the data for both cases are not normal; the Shapiro-Wilk test produced significant results. Figure 1 also shows a distribution with apparent negative skewness and kurtosis. Thus, the Mann-Whitney non parametric test is used to compare both averages and yielded non-significant difference. To summarize the test outcome, students final grade percentages in the blended class (Median = 83.21) did not differ significantly from those enrolled in the online class (Median = 89.35), U = 4663.00, z = -1.72, ns: p > 0.05, r = -0.10. This was also obvious in the close values of the average final grades in the blended and the online class, 82.53 and 85.14 respectively.
Figure 1. Distribution of percentage grades in blended courses
4.5
Analysis of Resources Utilization
In this subsection, we use the frequency of utilization of course online resources as a rough indicator to the involvement of the student then compare the computed values across both delivery methods. Our research hypothesis states that students enrolled in the online class will utilize the online class contents much more than those enrolled in the blended class. As expected students in the online class have higher access frequency to course online materials (M = 1343) while the corresponding mean for the blended students is (M = 637). Applying the Levene’s test found that the variance is not homogeneous; therefore, Mann-Whitney, a non-parametric test, was used yielding the following. There was a highly significant difference between the utilization of online contents between students taking the online class (Median = 1388.00) and those taking the blended class (Median = 606.00), U= 297,z = 4.48, p < 0.001. The obtained effect size (r) was -0.48 which represents a large effect that accounts for around 25% of the variance. It is worth noting that the online contents used are exactly the same in both classes. This finding supports our research hypothesis mentioned-above. Thus, one can conclude that the nature of the online class stimulates students to more frequently utilize the online contents compared to other offerings.
5.
INDIRECT ASSESSMENT
In addition to the direct assessment analyses reported in sections 3 and 4, the study also measures and statistically compares students’ perception and satisfaction of online delivery with blended one. Due to space limitation, the details of indirect assessment analyses are not discussed here but generally comparable satisfaction levels were found. Moreover, very interesting correlations between various perception-related factors were spotted.
6.
CONCLUSIONS
In spite of the rapid spread use of online courses, it is believed that there is a gap in the literature of the assessment of online programming courses. This paper is a trial to fill this gap and to comprehensively assess the effectiveness of online delivery in comparison with blended offerings. The results presented in this paper focused on direct assessment of such offerings which is definitely a more important factor in determining the effectiveness of these offerings than indirect assessment techniques used by the majority of other studies. This paper used more than 450 samples (students) and such data were collected over a period of six years. The longevity of the study in addition to the used sample sizes are some of its positive features. In addition, we consider that the main contribution of this paper is the measuring and comparison of the Intended Learning Outcomes (ILOs) as the prime determining factor of effectiveness.
All three statistical tests (chi-square, t-test- and MANOVA) used to compare the four studied ILOs yielded identical findings where there was no significant difference between the blended and online delivery mechanism in attaining the first three outcomes. Interestingly enough, the significant difference revealed by all tests for the last outcome (O4) indicted that online students have higher chances of attaining this outcome. This finding might be explained by considering that most students who completed the online classes were very motivated and serious students and thus have higher chances of attaining some of the ILOs.
With respect to other success and involvement indicators, there was no significant effect of the delivery mechanism on the chances of students receiving A as final course grades and on the distribution of the percentage of final grades. On the other hand, statistically significant differences were reported for both failure and withdrawal chances in which the blended offering has a positive role in reducing these ratios compared to the online offering. Moreover, it was found that there is a significant difference in the frequency of utilizing online resources between the two groups in which online students have used them more frequently. The last finding can be attributed to the nature of the online environment which stimulated the students to better unitize the available materials and be active contributors to the learning process.
7.
REFERENCES
[1] Armitage, W., Boyer, N., Langevin. S., and Gaspar, A. 2009. Rapid conversion of an IT degree program to online delivery: impact, problems, solutions and challenges. In
Proceedings of the SIGITE Conference on information technology education (Fairfax, Virginia, October 22 - 24, 2009). ITE '09. ACM, New York, NY, 100-107. DOI=
http://doi.acm.org/10.1145/1631728.1631758.
[2] Bray, J. and Maxwell, S. 1985. Multivariate Analysis of Variance, volume 54, Sage, Newbury Park, CA.
[3] Caldwell, E. 2006. Comparative study of three instructional modalities in a computer programming course: Traditional instruction, web-based instruction and online instruction. Doctoral Thesis. UMI Order No. AAI3227694, University of North Carolina at Greensboro.
[4] Edwards, R. Stewart, J., and Ferati, M. 2010. Assessing the effectiveness of distributed pair programming for an online informatics curriculum. ACM Inroads 1, 1 (Mar 2010), 48-54. DOI= http://doi.acm.org/10.1145/1721933.1721951. [5] Estell, J. 2007. Streamlining the assessment process with the
faculty course assessment report, Workshop in the 37th ASEE/IEEE Frontiers in Education Conference (Milwaukee, WI, October 10 - 3, 2007), IEEE, W1A-1. DOI=
http://doi.ieeecomputersociety.org/10.1109/FIE.2007.4418236
[6] Field, A. 2009. Discover Statistics Using SPSS. SAGE Publications Ltd, London, UK.
[7] Karsten, R. Kaparthi, S., and Roth, R. 2005. Teaching programming via the Web: A time-tested methodology, J. College Teaching Methods & Styles, 1, 3, 73-79.
[8] Kist. A. and Wandel, A. 2011. Performance evaluation of online learning tools, In Proceedings of the 41st ASEE/IEEE Frontiers in Education Conference (Rapid City, SD, October 12 - 15, 2011), IEEE, T1C-1-T1C2. DOI=
http://doi.ieeecomputersociety.org/10.1109/FIE.2011.6143077
[9] Masad, L. and Griffin, R. 2011. Effectiveness of multiple curriculum delivery methods on students' learning, In
Proceedings of the IEEE Global Engineering Education Conference, (Rapid City, SD, April 4 - 6, 2011), EDUCON ’11. IEEE, 850-852. DOI=
http://doi.ieeecomputersociety.org/10.1109/EDUCON.2011. 5773243
[10]Miles, G. 2011. Comparison of satisfaction and success of traditional and online students in an introductory computer literacy course in a small liberal arts university, J. Computing Sciences in Colleges, 27, 2 (December 2011), 206-212.
[11]MIT-edX 2012. Retrieved May 21, 2012 from
http://web.mit.edu/press/2012/mit-harvard-edx-announcement.html.
[12]Romanowski, C., Raj, R. and Ramkumar. S. 2011.
Successful practices for online computing, engineering, and technology courses, In Proceedings of the 41st ASEE/IEEE Frontiers in Education Conference (Rapid City, SD, October 12 - 15, 2011), IEEE, T1C-1-T1C6. DOI=
http://doi.ieeecomputersociety.org/10.1109/FIE.2011.6143092
[13]Tabachnick, B. and Fidell, L. 2007. Using Multivariate Statistics. Pearson – Allyn and Bacon, Boston, MA. [14]Thomas, R. 2000. Experiences Teaching C++ Online, J.
Computing Sciences in Colleges 15, 5, 214-222.
[15]Warren, S., Tare, B. and Bennett, A. 2008. Lessons learned from the application of online homework generation modules in a signals and systems course, In Proceedings of the 38th ASEE/IEEE Frontiers in Education Conference (Saratoga Springs, NY, October 22 - 25, 2008), IEEE, T4B-17-T4B-22. DOI=