http://wrap.warwick.ac.uk/
Original citation:
Sovinsky, Michelle and Helland, Eric (2013) Do research joint ventures serve a collusive function? Working Paper. Coventry, UK: University of Warwick, Department of
Economics. (Warwick economics research papers series (TWERPS)).
Permanent WRAP url:
http://wrap.warwick.ac.uk/59368
Copyright and reuse:
The Warwick Research Archive Portal (WRAP) makes this work of researchers of the University of Warwick available open access under the following conditions. Copyright © and all moral rights to the version of the paper presented here belong to the individual author(s) and/or other copyright owners. To the extent reasonable and practicable the material made available in WRAP has been checked for eligibility before being made available.
Copies of full items can be used for personal research or study, educational, or not-for-profit purposes without prior permission or charge. Provided that the authors, title and full bibliographic details are credited, a hyperlink and/or URL is given for the original metadata page and the content is not changed in any way.
A note on versions:
The version presented here is a working paper or pre-print that may be later published elsewhere. If a published version is known of, the above WRAP url will contain details on finding it.
Do Research Joint Ventures Serve a Collusive Function?
Michelle Sovinsky and Eric Helland
No 1030
WARWICK ECONOMIC RESEARCH PAPERS
Do Research Joint Ventures Serve a Collusive Function?
Michelle Sovinsky and Eric Helland
1September, 2012
(First version: October 2007)
Abstract
Every year thousands of …rms are engaged in research joint ventures (RJV), where all knowl-edge gained through R&D is shared among members. Most of the empirical literature as-sumes members are non-cooperative in the product market. But many RJV members are rivals leaving open the possibility that …rms may form RJVs to facilitate collusion. We ex-amine this by exploiting variation in RJV formation generated by a policy change that a¤ects the collusive bene…ts but not the research synergies associated with a RJV. We use data on RJVs formed between 1986 and 2001 together with …rm-level information from Compustat to estimate a RJV participation equation. After correcting for the endogeneity of R&D and controlling for RJV characteristics and …rm attributes, we …nd the decision to join is impacted by the policy change. We also …nd the magnitude is signi…cant: the policy change resulted in an average drop in the probability of joining a RJV of 34% among telecommu-nications …rms, 33% among computer and semiconductor manufacturers, and 27% among petroleum re…ning …rms. Our results are consistent with research joint ventures serving a collusive function.
JEL Classi…cation: L24, L44, K21,O32
Keywords: research and development, research joint ventures, antitrust policy, collusion
1 Sovinsky is at the University of Warwick, the University of Zurich, and CEPR; Helland is at Claremont
McKenna College and RAND. Corresponding author is Sovinsky ([email protected]). We are
“People of the same trade seldom meet together, even for merriment and diversion, but the conversation ends in a conspiracy
against the public, or in some contrivance to raise prices.” Adam Smith inWealth of Nations
1
Introduction
Every year thousands of …rms are engaged in research joint ventures (RJV), an agreement in which all knowledge gained through research and development (R&D) is shared among
mem-bers. RJVs often provide pro-competitive bene…ts, such as shared risk, increased economies of scale in R&D, asset complementarities, internalized R&D spillovers (i.e., overcoming
free-rider problems), alleviated …nancial constraints, and shared cost. The majority of the
literature focuses on the bene…ts of RJVs and assumes that members do not collude in the product market.2 However, by construction, RJVs permit multiproject and multimarket
contact and o¤er …rms an opportunity to coordinate behavior. As Martin (1995) notes, “It is conceivable that …rms that start to work very closely on R&D projects might start to
extend the coordination of their behavior onto other spheres of the life of the …rms.”3
There are numerous ways in which R&D collaborations may lead to collusive product
market behavior. For instance, RJV formation could centralize decision making by
com-bining collaborative e¤orts with control over competitively signi…cant assets, by imposing collateral restraints that restrict competition among participants, by including member …rms’
individual R&D in the collaborative e¤ort, by facilitating the exchange of competitively sen-sitive information, or by functioning as a vehicle to signal cooperative behavior. Finally,
production joint ventures, which involve jointly manufacturing a new or improved product,
2 See for instance, Marin, et al (2003), Cassiman and Veuglers (2002), Kaiser (2002), Hernan, et al (2003),
and Roller, et al (2007). Caloghirou and Vonortas (2000) and Hagedoorn, et al (2000) provide summaries of the RJV formation literature.
3 Theoretical papers that address the potential for product market collusion among RJV members include
typically involve agreements on the output level, the price of the joint product, or other competitive variables.
The collusive potential is even more pronounced when RJV members are product market rivals, as is frequently the case. Examples of direct product market competitors involved in
joint RJVs include Xerox and Dupont who formed a RJV to develop copying equipment; Shell and Texaco to re…ne crude oil; General Motors and Toyota to produce a new type of
car; Merck and Johnson & Johnson to develop new over the counter medicines; MCI and
Sprint to provide enhanced telecommunications services; Samsung and Sony to develop LCD panels; and SEMATECH, a consortium of leading semiconductor manufacturers established
to improve semiconductor manufacturing technology.
In many industries competitors are in numerous RJVs together. Multiproject contact
is an anticompetitive concern, and a number of arguments for how it can facilitate tacit
collusion are discussed in the theoretical literature.4 In addition, Snyder and Vonortas (2005) show that multiproject contact can facilitate explicit collusion in that it serves to
bundle markets, which reduces the heterogeneity of …rms’private information making collu-sive agreements more e¢ cient. Another avenue through which multiproject contact may be
anticompetitive is that by participating in several markets together …rms are able to punish deviations from collusion with price wars on all markets in which they meet.5
Firms in computer manufacturing, petroleum re…ning and telecommunications industries
exhibit the highest multiproject contact via joint membership in numerous RJVs. Among RJVs registered with the antitrust authorities from 1985 to 1998, Amoco and Chevron were
involved in more than 60 joint RJVs, resulting in the highest multiproject contact among all …rms. Furthermore, over three-quarters of all RJVs exhibit multiproject contact in that
they have at least one …rm pair that is also in at least one other RJV during the same time
4 Bernheim and Whinston (1990) …nd that multimarket contact may reduce the incentive to deviate
by pooling asymmetries among …rms. Spagnolo (1999) shows that multimarket contact will facilitate tacit colllusion (when …rms have concave utility functions over pro…t) because as markets are added the lost pro…ts from deviation increases more than proportionately with the gain from deviation.
5 Cooper and Ross (2009) present a theoretical model in which a joint venture between …rms in one
period, where 60% of the cases involve …rm pairs from the same industry.6 A common justi…cation for promoting RJVs is that R&D cooperation eliminates wasteful duplication,
but the frequent occurrence of numerous RJVs with overlapping research agendas seems to suggest an alternative motivation for RJV formation.
The possibility that …rms may undertake legal RJVs as a means to facilitate illegal product market collusion has generated regulatory scrutiny in a wide variety of industries and
research areas.7 For example, in the petroleum industry in 1990, antitrust authorities found
evidence that six major oil companies, who were involved in numerous RJVs with overlapping membership, were sharing price information through direct contacts among competitors,
press releases, and price postings.8 More recently, an antitrust lawsuit was …led in 2006
against CITGO Petroleum and Motiva, a research joint venture between Shell, Texaco,
and Saudi Re…ning, alleging that the defendants conspired with the Organization of the
Petroleum Exporting Countries (OPEC) to …x the price of gasoline.9 The following year a group of California gasoline station owners brought a suit against Equilon Enterprises,
another RJV between Texaco and Shell, alleging that the RJV violated unfair competition laws and illegally …xed gasoline prices from 1998 to 2001. The suit states that the chairmen
of the oil companies met privately starting in March 1996 for the “purpose of forming and organizing a combination,”that the executives destroyed documents from the meetings, and
that the (now-defunct) RJV violated antitrust laws and caused arti…cially high wholesale gas
prices.10 Texaco had to withdraw from Equilon and Motiva when it merged with Chevron to
6 See Snyder and Vonortas (2005) for more analysis on multimarket contact among RJV members.
7 For an extensive discussion see Brodley (1990), Jorde and Teece (1990), and Shapiro and Willig (1990).
8 See Coordinated Proceedings in Petroleum Products Antitrust Litigation, 906 F2d 432 (9th Cir. 1990)
and Petroleum Products Antitrust Litigation, 906 F.2d 432 (9th Cir.1990). The …rms were Texaco, Inc., Union Oil Co. of California, Atlantic Rich…eld Co., Exxon Corp., Mobil Oil Corp., and Shell Oil.
9 On January 9, 2009, the case was dismissed due to lack of subject matter jurisdiction. See Re…ned
Petroleum Products Antitrust Litigation (MDL No. 1886) (2006).
10 The lawsuit hinges on a marketing deal that allowed former rivals to collude on prices starting in 1998,
satisfy federal regulators. In addition, European antitrust authorities required Mobil Corp. to withdraw from a re…ning and marketing RJV with BP Amoco as a condition for approval
of its merger with Exxon Corp.
There have also been high pro…le cases in the computer industry. In one such case
Ad-damax Corp., a producer of security software, alleged that the RJV formed among Hewlett-Packard, IBM, and Digital Equipment, called the Open Software Foundation, engaged in
horizontal price …xing by conspiring to force input prices (the price of security software)
below the competitive price.11
Recently, in the semiconductor memory market, the US Department of Justice (DOJ)
charged four companies (Samsung, In…neon, Hynix, and Elpida) with …xing prices for dy-namic random access memory (DRAM). The suit states that company executives discussed
the price of DRAM at joint meetings, agreed to …x prices, and exchanged information with
competitors. Micron, who was a coconspirator, sought amnesty from prosecution through the DOJ’s leniency policy, and hence was not subject to criminal …nes in exchange for
infor-mation on the other conspirators. Samsung, Hynix, Elpida and In…neon plead guilty and agreed to pay more than $732 million in collective …nes, the second highest total obtained in
an investigation aimed at one industry. These companies had been involved in various RJVs with overlapping membership including SEMATECH, of which Micron was a member.
Another industry with a history of collusive behavior in which RJVs are commonplace is
telecommunications, where nearly 40% of …rms are involved in at least one RJV with another direct product market rival. Between 1984 and 1996, telecom …rms were not permitted to
o¤er both local and long distance services.12 During this period of regulation, the long
that the uni…ed price for the two companies’brands was not an antitrust violation under the rule of reason.
11 Open Software Foundation (OSF) was founded to develop a version of the Unix operating system to
compete with AT&T and Sun Microsystems. Addamax, was a producer of Unix based security software.
OSF considered bids for security software from Addamax, AT&T, and SecureWare and selected SecureWare. Addamax then sued OSF alleging horizontal price …xing and unlawful joint venture conduct. The court ruled in favor of the defendents primarily based on the …nding that the lower price of security software was not a substantial cause of Addamax’s failure to succeed in selling security software. See Addamax Corp. v. Open Software Foundation, 964 F. Supp. 549 (D.Mass. 1997), a¤’d, 152 F.3d 48 (1st Cir. 1998).
12 In 1984, AT&T relinquished its hold on the local market when the Department of Justice ordered AT&T
distance market consisted of a regulated dominant …rm (AT&T), two main competitors (MCI and Sprint), and hundreds of resellers. AT&T was required to provide services to
all long distance customers, to …le with the Federal Communications Commission (FCC) to add a new service, and to average its rates across consumer markets. MCI and Sprint were
not regulated in their prices or provision of services. Despite being unregulated, MCI and Sprint charged prices a little lower than those of AT&T. Furthermore, almost every new
rate decrease proposed by AT&T was challenged under the umbrella of predatory behavior.
These observations have led some economists to classify the market for long distance services in the 1990’s as collusive with AT&T as the price leader.13 It is also notable that from
1984 to 1996, AT&T, MCI, and Sprint were involved in numerous joint RJVs.
In spite of the suggestive evidence, to our knowledge, this is the …rst study in the empirical
literature to examine whether collusive behavior may be facilitated by RJVs.14 Estimating
the impact of the returns to collusion on the decision to join a RJV is di¢ cult as there are many legal reasons to join a RJV which also result in increased market power of the members.
One option is to consider a subset of …rms engaged in RJVs and another subset not engaged in RJVs and test whether collusion is higher among the …rst group. However, such a test
would only be able to tell us something about collusive behavior that was detected, but would not inform us about the prevalence of …rms that form RJVs with collusive intentions
but are not caught. An additional problem is the endogeneity of the choice to join a RJV.
In this paper we propose a test of whether the data are consistent with …rms forming RJVs as a way to facilitate collusion in the …nal goods market. Rather than directly testing for
collusion by …rms engaged in RJVs we examine their potentially collusive function through a quasi-experiment. The quasi-experiment tests whether a 1993 revision of the antitrust
leniency policy, which was enacted to detect collusive behavior, made …rms more or less
likely to join RJVs. We argue that the policy revision made applying for amnesty easier and
13 See Huber, et al (1992) and MacAvoy (1995).
14 The closest empirical work on this topic is that of Scott (1988, 1993), who examined all RJV …lings over
more attractive and, hence, reduced the gains from trying to establish a collusive relationship because coconspirators would be more likely to defect and seek amnesty. This change in the
value of collusion should change the bene…t of joining a RJV only if membership serves some sort of collusive function at the margin. Since the leniency policy applies to all …rms after
1993 we are concerned that our results might be driven by some unobserved trends in the data. For this reason we construct a “treatment”group that consists of potential colluders in
the sense that these are …rms that have joined a RJV with other …rms in the same …nal goods
industry. Furthermore, we examine whether the policy revision di¤erentially impacts …rms for whom collusion might be more valuable. To do so, we develop a measure of the RJV’s
collusive value to a …rm that is considering whether to join a particular RJV. The …rm-speci…c measure of “RJV market power”allows us to obtain a heterogeneous treatment e¤ect
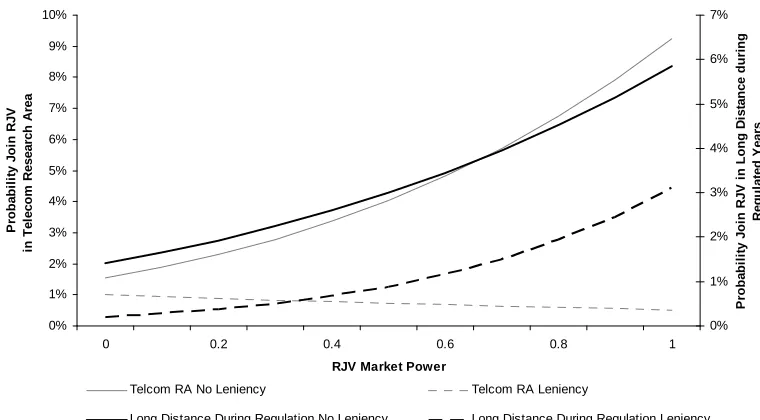
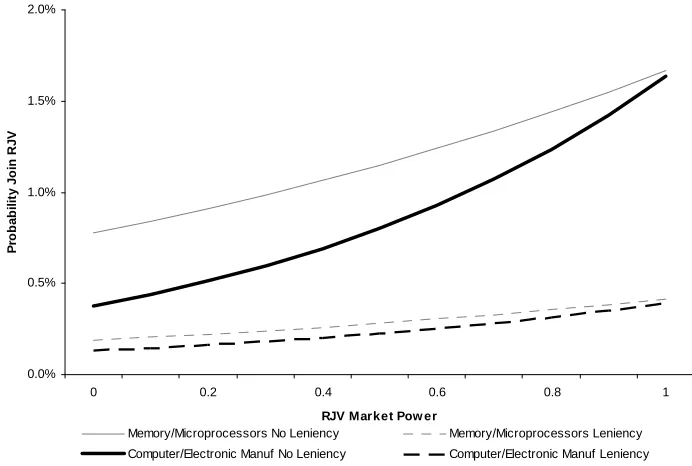
of RJV participation. Determining the entire shape of the curve relating the probability of
joining a RJV to the market power of the RJV allows us to make a more precise inference on the collusive potential of RJVs. Our test of a RJV’s collusive function is (i) whether the
revised leniency policy changed the probability that …rms join a RJV and (ii) whether the policy has a di¤erential impact if the RJV market power is larger.15 Our approach has the
advantage that we are able to examine the collusive potential of RJVs without observing costs or prices.
Another obvious problem in measuring collusive intentions, which plagues the majority of
studies of collusion, is de…ning the relevant product market. To this end we consider many de…nitions of the relevant market, ranging from very broad (e.g., 3-digit NAICS) to very
narrow and industry speci…c (e.g., the market for long distance carriers under the period of telecommunications regulation). We apply our quasi-experiment to three industries with a
history of antitrust suits coupled with high RJV participation: petroleum manufacturing,
computer and electronic product manufacturing, and telecommunications.
15 We cannot predict what direction the impact of the leniency policy will be. For example it is possible
We …nd that the decision to join a RJV is impacted by the policy change and that this impact is very signi…cant across relevant market de…nitions. Speci…cally, we …nd that the
revised leniency policy reduces the average probability that telecom …rms join a given RJV by34%;the reduction among computer and semiconductor manufacturers is33%;and among
…rms in petroleum re…ning the probability decreases by27%:Our results are consistent with RJVs serving (at least in part) a collusive function.
The rest of the paper proceeds as follows. In section 2 we provide background on the
legal policies surrounding RJV formation and collusive behavior. We present the model and estimation technique in section 3. In section 4 we discuss the data. We present the
results in section 5. In section 6 we conclude.
2
Antitrust Policy Background
2.1
Leniency Policy
The Sherman Act of 1890 makes it illegal for …rms to agree to …x prices or engage in other agreements that restrict output or harm consumers. In 1978, the US Department of
Justice (DOJ) Antitrust Division enacted the leniency policy program designed to detect …rms engaged in collusive behavior. The DOJ substantially revised the leniency program,
in August 1993, to make it easier and …nancially more attractive for …rms to cooperate with the Division. According to a DOJ policy statement, “Leniency means not charging such
a …rm criminally for the activity being reported.” There were three major revisions: (i)
amnesty was made automatic if there was no pre-existing investigation (ii) amnesty could be granted even if cooperation began after the investigation was underway (iii) all directors,
o¢ cers, and employees of the …ling …rm are protected from criminal prosecution. There is one important caveat: only the …rst company to …le receives amnesty.
In addition to making it more attractive for cartel members to report illegal behavior, in 1995, the DOJ substantially increased the penalties for antitrust violations. Prior to
1995, the largest criminal …ne was $6 million. In contrast, the average criminal …ne was
from 1976 through 1995.” In 1999, total …nes imposed exceeded $1.1 billion.16 Since the Division revised its leniency program, cooperation from leniency applications has resulted
in numerous convictions and nearly $4 billion in criminal …nes.
There is much evidence that …rms reacted to the policy change. Most concretely, the
revi-sion resulted in a surge in amnesty applications. Under the old policy, the Divirevi-sion obtained about one amnesty application per year, whereas the new policy generates more than one
application per month. Scott Hammond of the DOJ stated that leniency programs have been
responsible for “detecting and cracking more cartels than all search warrants, secret audio or videotapes and FBI interrogations combined.”17 A Deputy Assistant Attorney General
of the Division remarked “The early identi…cation of antitrust o¤ences through compliance programs, together with the opportunity to pay zero dollars in …nes under the Antitrust
Division’s Corporate Amnesty Program, has resulted in a ‘race to the courthouse,’...”
In-deed, it is not uncommon for a company to request amnesty a few days after one of its coconspirators has already secured amnesty by …ling …rst.18 Miller (2009), who provides
estimates from a structural model of cartel behavior, shows that the leniency policy reduced cartel formation by 59%, while it increased the detection rate by 62%.
Some well-known examples of collusive behavior thwarted via the leniency policy include markets for DRAM chips, marine hosing (used to funnel oil from tankers to storage facilities),
air cargo transportation, graphite electrodes production, vitamin sales, …ne arts auctions,
and USAID construction. Each of theses cases involved multimillion dollar …nes and in some cases criminal sentences, whereas the amnesty applicant incurred no …nes and received
prosecution protection. For instance, in the graphite electrodes investigation, the second company to …le paid $32.5 million (10% of annual earnings), the third $110 million (15% of
annual earnings), and the fourth $135 million (28% of annual earnings). Mitsubishi was later
convicted at trial and was sentenced to pay $134 million (76% of annual earnings). Executives from these companies incurred …nes and prison sentences. In the vitamin investigation, F.
16 See Brown and Burns (2000), Kobayashi (2001), and Spratling (1999) for more details.
17 http://www.justice.gov/atr/cases/f202300/202397.htm
Ho¤mann-La Roche and BASF AG plead guilty and incurred …nes of $500 million and $225 million, respectively. Again, executives from these companies served time in prison. In
the …ne arts auctions case Sothebys paid $45 million, and the chairman was sentenced to one year in jail and a $7.5 million …ne. Finally, in the USAID Construction case, …rms
were ordered to pay …nes of $140 million and to pay $10 million in restitution to the U.S. government. An executive for one of the companies received a three year prison sentence.19
0 20 40 60 80 100 120 140
1985 1987 1989 1991 1993 1995 1997 1999 2001
Year
T
o
tal
New
RJV
s
(dash
ed
)
0 5 10 15 20 25 30
New
RJV
s
b
y
Area
(sol
id
)
[image:12.612.94.506.245.478.2]Total Computers Telecom Petroleum
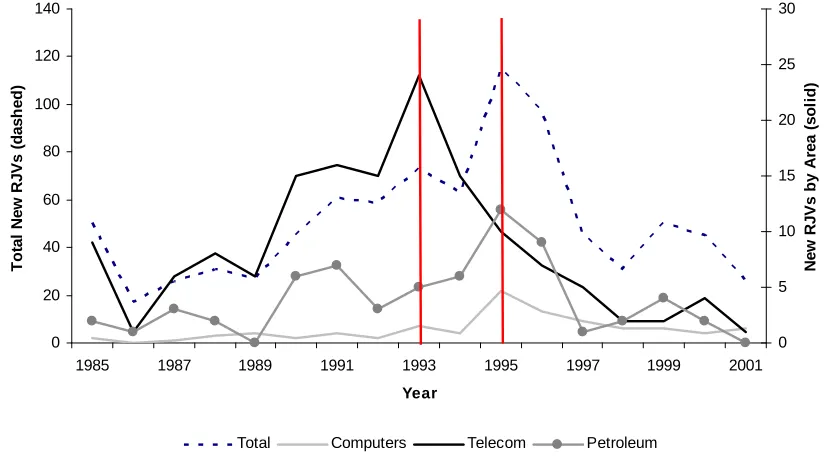
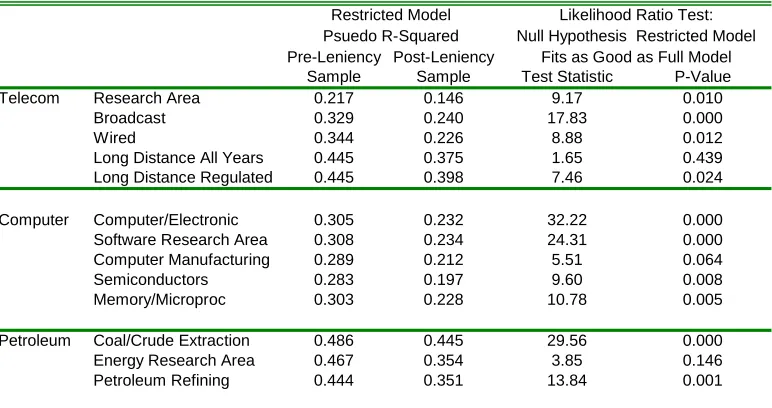
Figure 1: Number of New RJV Filings
Figure 1 shows the number of new RJV …lings across research areas (RAs). The dashed line indicates all RAs, the dark solid line indicates telecommunications RAs, the light solid
line indicates computer RAs, and the line with circles indicates petroleum RAs. The vertical lines are in 1993 (when the leniency policy was revised) and 1995 (when the …nes increased
sharply). The …gure shows a dramatic drop in RJV …lings across all RAs that is consistent with the …ne increase, while the telecommunications RA’s decline is consistent with the policy
revision. Recall that the long-distance segment of the telecommunications industry was
19 Due to a 2002 revision in the British O¢ ce of Fair Trading amnesty leniency policy there have been
under close scrutiny until 1996 (during the period of regulation) and, hence, telecom …rms may have been more responsive to policy aimed at deterring collusive behavior. Whereas
…rms from non-regulated industries may have reacted more to an increase in guaranteed …nes associated with collusive behavior and the further incentive this provided to defect from any
future collusive arrangements. Obviously, there may be other (non-leniency policy related) reasons for …rms to reduce their RJV applications. However, this …gure suggests that the
decline in RJV applications may be due, at least in part, to the changes in policies regarding
detection and punishment of collusive behavior via the leniency policy.20
2.2
National Cooperative Research and Production Act
The National Cooperative Research Act (NCRA), established in 1984, requires all …rms
interested in forming a RJV to …le with the Federal Trade Commission (FTC).21 The
NCRA was extended in 1993 to include all …rms involved in production joint ventures (and
was renamed the National Cooperative Research and Production Act, NCRPA). By …ling,
if member …rms are subjected to criminal or civil action, antitrust authorities are required to apply the (more lenient) rule of reason that determines whether the joint venture improves
social welfare rather than the per-se illegality rule.22 If found to fail a rule-of-reason analysis, member …rms are granted antitrust protection, which limits their possible antitrust
20 While the empirical evidence to date suggests that the leniency policy is e¤ective in curbing collusive
behavior, it is theoretically possible that the policy could have the opposite e¤ect. Cartels are illegal,
and therefore, no written contract between member …rms exists. As a result, colluding …rms must rely on
trust to enforce the collusive behavior. If …rms deviate other members have a powerful punishing tool in
the leniency policy: deviation is punished by another member reporting the cartel (and gaining antitrust
protection). Hence, the leniency policy may foster cartel behavior in that it provides a tool that can be
used to discourage deviations from collusive agreements. See Spagnolo (2000).
21 According to the NCRA, a RJV is “any group of activities, including attempting to make, making or
performing a contract, by two or more persons for the purposes of (a) theoretical analysis, experimentation, or systematic study of phenomena or observable facts, (b) the development or testing of basic engineering techniques, (c) the extension of investigative …nding or theory of a scienti…c or technical nature into practical application for experimental and demonstration purposes..., (d) the collection, exchange, and analysis of research information, or (e) any combination of the [above].”
22 If a behavior is per se illegal then authorities need only prove the behavior exists, there is no allowable
exposure to actual (rather than treble) damages, plus costs and attorneys’fees with respect to activities identi…ed in the …ling.23
In deciding whether to approve a proposed RJV, the primary consideration of the FTC is whether the venture is likely to give member …rms the ability to retard the pace or scope
of R&D e¤orts. In practice, antitrust authorities are unlikely to challenge a RJV when there are at least three independent …rms with comparable research capabilities to those
of the proposed RJV.24 Furthermore, authorities have indicated they will not challenge
RJVs in certain research areas. For example, authorities will permit modi…cations to RJVs involving pharmaceutical …rms engaged in cardiovascular research; those formed by the four
US manufacturers of centrifugal pumps (used by electrical utilities) that focus on improving pump performance; or RJVs formed to conduct R&D relating to computer aided design and
manufacturing.25
Finally, we should note that the broadening of the NCRPA coincides with the revision of the leniency policy. Note, however, that we would expect to see more RJVs formed due
to the NCRPA broadened protection. If the e¤ect of the leniency policy is to reduce RJV applications, the presence of the NCRA revision would make any negative signi…cant results
we …nd even stronger.
3
Theory
A RJV has the potential to facilitate collusion when member …rms are rivals in the …nal
product market. RJVs commonly involve a subset of all potential rivals. Hence a cartel formed among RJV members is likely to be partial in the sense that the cartel will involve
a subset of all the …rms in the industry. Partial cartels have been observed in many indus-tries. For example, a cartel in carbonless paper production had combined market shares
of about 85% (Levenstein and Suslow, 2006); a cartel among shipping …rms in the North
23 Prevailing defendents are entitled to recover costs and attorneys’ fees if an action is found to be
“frivolous, unreasonable, without foundation, or in bad faith.” See 15 USC section 4304(a)(2)(2000).
24 See Competitor Collaboration Guidelines, section 4.3. www.ftc.gov/os/2000/04/ftcdojguidelines.pdf.
25 See US DOJ Business Review Letter to American Heart Association March 20, 1998; the Pump Research
Atlantic constituted 75% of the market (Escrihuela-Villar, 2003); and, famously, petroleum manufacturing …rms in the US and Russia are excluded from the OPEC cartel.
There is a growing theoretical literature that examines partial cartels. Included in this literature is work by Bos (2009) and Bos and Harrington (2010) (hereafter BH), who consider
partial cartels among …rms in dynamic di¤erentiated products industries. BH endogenize cartel composition and show that, when …rms are su¢ ciently patient, there exists a stable
partial cartel that involves the largest …rms in the industry.26 BH prove that there is a
positive correlation between …rm size and the incentive to join a partial cartel, where the most pro…table partial cartel comprises the largest …rms in the industry.27 They establish that
…rms have an incentive to form this cartel when its smallest member is su¢ ciently large. Bos (2009) shows that partial cartels are often dominant in terms of having a signi…cant
combined market share, while …rms not included in the cartel are typically the small players
in the market.
The link between Bos (2009) and BH’s results to our work is straightforward: if the RJV
is formed to facilitate (partial) collusion then (BH’s results imply) the RJV will be the most valuable the larger is its size. RJV size (measured as the combined market share of its
members) has a monotonic e¤ect on the value of forming a RJV to collude. Our measure of the RJV market power is motivated by this theoretical result.
Speci…cally, suppose …rm i belongs to industry k; and let j be the subset of …rms in
industry k that are engaged in RJV j: The collusive value of a partial cartel j (formed
via RJV j) is given by Vi(S j; d); which is a function of the total size of the partial cartel (S j =Pr2
js
2
r;wheresr is the market share of …rmrcomputed as sales of …rmrover total
26BH, and other papers in the theoretical literature, assume that a cartel member’s demand is proportional
to the pre-cartel size of the …rm. This allocation rule is motivated by actual cases as cited in BH: these include the Norwegian cement cartel, several German cartels during the early 1900s, and other examples noted in Harrington (2006).
27 BH provide the intuition: The price charged by the cartel is increasing its capacity, which implies that
sales in industryk)28 and the probability the cartel is detectedd. For a prospective cartel member, the antitrust leniency policy revision makes collusion more costly (by increasing
d). When cartelizing is costly, BH show the collusive value of a partial cartel is the highest when the cartel is formed by the largest …rms in the industry. We de…ne the collusive value
(i.e., the market power) of the RJV as
Hijt =
S j
HHIkt =
P
r2 js
2 r
HHIkt
(1)
where HHIkt is the Her…ndahl Index for industry k.29 Why this is a measure of the
RJV market power is best understood from the perspective of …rm i who is considering joining RJV j: When making this decision …rm i may be interested in how much collusive potential joining RJVj will yield. The number and size of …rms in his market is …xed (the denominator) so in assessing the collusive potential of the RJV he will consider his size as well as the size of the other …rms in the RJV relative to the overall industry concentration.
Notice the larger are the …rms in RJVj the higher isHijt, which re‡ects the higher collusive
potential of the RJV. If there were only a few large …rms in industryk then the RJV would require fewer members to have substantial market power. A RJV in which most of the large
…rms in the industry are members has more collusive potential. That is, holding the HHI of the industry …xed, the greater the combined market shares of the participants the greater
will be Hijt as consistent with the theory of partial cartels.30 If the RJV consists of all
…rms in the industry (i.e., is an all-inclusive cartel) then Hijt = 1.
4
Econometric Speci…cation
In this section, we provide an econometric framework for a …rm’s decision to join a RJV, which we use to understand the implications of our quasi-experiment on …rm RJV joining
28 As the collusive value is increasing in the sum of the market shares of the colluding …rms, it is also
increasing in the sum of the squared market shares of the colluding …rms.
29 Where the industry changes depending upon the relevant market we consider. We discuss this in more
detail in section 5.
30 Notice that we cannot use the measure of RJV market power to compare across industries. That is,
behavior.31 The model describes the behavior of a …rm conditional on the characteristics of the …rm, the characteristics of the RJV, and the characteristics of the industry, where we
account for the endogeneity of RJV formation.
4.1
Model
We develop a model of a …rm’s decision to enter into a particular RJV. The unit of
obser-vation is a …rm, RJV, time combination. Let Vijt be the (latent) value to …rmi = 1; :::; N
of engaging in RJV j at timet:
Vijt= 1Lij + 2LijHijt+ Hijt+ 1rdijt+ xit+ zijt+"ijt: (2)
If …rms enter into a RJV to facilitate collusion, antitrust policy targeted at product market collusion could impact the decision to engage in a RJV (through an increase in the probability
of detection and increased …nes). TheLij term is an indicator variable taking on the value
of 1 if …rm i joins RJV j after the leniency policy revision or the increase in …nes (see discussion in next paragraph). Furthermore, the potential payo¤ to collusion in the product
market could depend upon the market power of the RJV (theHijt term) as discussed in the
previous section. This is best thought of as the collusive value to the …rm of joining RJV
j. We are primarily interested in the total e¤ect of the leniency policy on RJV formation (determined by the 1 and 2 terms). The remainder of the terms in (2) capture other
potential motivations for RJV formation. Therdijt term represents the expected change in
R&D intensity of …rm i after entering RJV j, xit are a vector of …rmi characteristics, zijt
are a vector of …rm-RJV characteristics, and ijt is an i.i.d. normally distributed mean zero
stochastic term. We now discuss the terms of Vijt in more detail.
31 The decision to enter into an RJV may depend upon the decisions of rival …rms (Bloch 1995; Greenlee
and Cassiman, 1999; and Yi and Shin, 2000). We do not estimate a structural model of …rms’ decisions because we would need to specify the game played among competing …rms in R&D choices, RJV formation,
and product market decisions. This game is best speci…ed in a dynamic setting. Estimation would need
to address the simultaneity of R&D decisions, RJV formation, and product market decisions, which would require assumptions on the nature of equilibrium and a means to choose among multiple equilibria. Second, addressing the nature of product competition would require estimates from competitive and collusive models of product market behavior. We could compare actual to predicted markups under both models (Nevo, 2000), but this requires cost data (not easy to obtain and often proprietary). Finally, the telecom industry was
regulated. So the model would have to address strategic behavior in a regulated industry. The model
presented in this section captures the collusive intent of …rms absent the additional structure and data
Leniency Policy Indicator
There are reasons to believe that some …rms may be more a¤ected by an increase in
…nes than an increase in the probability of being caught in collusive behavior conditional on receiving a lower …ne. For example, in some industries being able to punish your rivals
(with a higher guaranteed …ne) may provide more of an impetus to reveal the cartel ac-tivity and, hence, be more e¤ective in curbing collusive behavior than the revisions alone.
Indeed, as Figure 1 indicates the decline in RJV applications is most dramatic in 1993 for
telecommunications …rms (coinciding with the revision in the leniency policy) and in 1995 for the petroleum and computer …rms (coinciding with the increase in …nes). To determine
which leniency policy tool (revision or …ne increase) is most relevant to the industry under consideration we used the RJV data to identify structural breaks in formation behavior over
time for each industry.32 The results of these tests indicated that a break occurred in
1993 (1995) for the telecommunications RJVs (computer and petroleum RJVs). Therefore,
Lij takes on the value of one post-1993 (post-1995) for the telecommunications (computer
and petroleum) market de…nitions. We also conducted robustness checks ex-post where we estimated versions of our model with the leniency policy indicator de…ned for di¤erent years.
We discuss these tests in more detail in section 7.
RJV Market Power
Our measure of the market power of a RJV, Hijt, is motivated by the observation that
the larger the joint market shares of the …rms engaged in collusive behavior (via the RJV) relative to the other …rms in the industry, the higher is the pro…t to split among members.
Hence, the market power of the RJV is a function both of the market shares of the members as well as the overall level of industry concentration. Furthermore, because we wish to
measure the potential for product market collusion, the market power of the RJV should
be relevant only among product market competitors, even though RJV members may be in di¤erent industries.
Our primary measure of the RJV market power is given by equation (1), which is increas-ing in the fraction of …rms in the industry that join the RJV but is non-increasincreas-ing in the
fragmentation of the …rms that join conditional on the fraction joining. This is reasonable if we believe that the RJV will be less e¤ective in sustaining collusion relative to the status quo
when the members are more fragmented. Alternatively, if it is more di¢ cult to coordinate collusion across many …rms, more fragmented …rms may have more to gain from joining a
RJV if the RJV also acts as a tool to coordinate. To allow for this possibility, we consider an alternative measure of the collusive potential of the RJV that is increasing in both the
fraction of …rms in industry k that join the RJV and in their level of fragmentation (which we refer to as the fragmentation measure denoted Hijtf rag). The fragmentation measure is de…ned as: industry concentration post-RJV if the RJV acts as a single entity normalized
by the pre-RJV industry concentration.
To motivate the value to considering both measures suppose there are two industry
structures: Market Structure A (MSA) has eight equally-sized …rms and Market Structure
B (MSB) has four equally-sized …rms. If four …rms under MSA and two …rms under MSB join a RJV, the …rst measure of the RJV collusive potential (referred to as the primary measure)
is identical: Hijt = 1=2. The fragmentation measure yields di¤erent results: the post-RJV
HHI in MSA is5=16if the RJV acts as a perfectly collusive entity and1=8 under the status quo, yieldingHijtf rag = 5=2. The post-RJV HHI in MSB is3=8if the RJV acts as a perfectly collusive entity and 1=4 under the status quo, yielding Hijtf rag = 3=2. The fragmentation measure indicates the RJV has higher collusive potential under the more fragmented MSA.
To take a more extreme example if all the …rms in an industry join the same RJV should the RJVs collusive potential be the same or di¤erent if there are four or two equally-sized
…rms in the industry? As this is an empirical question, we consider both the primary and fragmentation measure of the market power of the RJV in estimation.33
R&D Intensity Many papers in the RJV literature show that the expected impact
on R&D may be an important motivation for joining a RJV (see for example, Kamien, Muller, and Zang, 1992). For instance, …rms may engage in RJVs to take advantage of
complementarities among member …rms, share R&D related costs, or overcome free-rider problems. Following the RJV literature, we de…nerdijt as the change in R&D intensity of
33 We are grateful to an anonymous referee for the idea and motivation for the fragmentation measure of
…rmi that would result from joining RJVj at timet: It is given by
rdijt =
R&Dit 1
salesit 1
R&Dijt
salesijt
; (3)
where R&Di represents R&D expenditures and salesi represents gross dollar sales.
Firm Characteristics Firm-speci…c terms are captured by xit and include …rm size
(assetsit), the number of other RJV’s in whichiis currently engaged and the square, capacity
constraints (cashit);and industry …xed e¤ects (when we consider de…nitions of markets with
…rms from many industries, such as research areas).34 Firms may have di¤erent absorptive capacities, which in turn determine their willingness to form RJVs (Cohen and Levinthal,
1989). The absorptive capacity is impacted by factors such as size and past experience with research collaboration (Kogut, 1991). We use total assets as an exogenous measure of
size and as a control for the capital and equipment that a particular …rm brings to a RJV. This is consistent with the notion by Irwin and Klenow (1996) that larger …rms gain more
from RJVs and from R&D knowledge spillovers.35 Much of R&D is funded from retained
earnings, and we use free cash ‡ow as a proxy for capital constraints. Firms with a high free cash follow should be more attractive partners in a RJV since they are able to sustain
investment without loans or new equity issues (see Compte et al, 2002).
RJV Characteristics RJV-speci…c terms are included in the zijt. These are the
number of members of RJV j, whether the intent is to patent the RJV outcome, measures of …rm-RJV asymmetries, and the RJV market power measure. Baumol (2001) showed that the potential bene…ts of RJVs may increase with the number of participating …rms since
technological spillovers increase. The intent to patent is a measure of e¢ ciency with which …rms innovate and may proxy for absorptive capacity (see Gugler and Siebert, 2007). The
theoretical literature suggests that the degree of asymmetries across …rms may in‡uence RJV participation (Petit and Towlinski, 1999). Previous empirical work (for instance,
Roller et al, 2007) …nds that size asymmetries and the degree of product complementarity
between …rms in‡uences participation decisions. We include variables designed to capture
34 For a summary of the literature see Caloghirou and Vonortas (2000) and Hagedoorn, et al (2000).
35 Hernan, et. al. (2003) consider the decision to join a RJV in the European Union. They …nd that
the attractiveness of a …rm to other partners in the RJV, which consist of a measure of …rm size relative to the average RJV member (rassetijt) and a measure of capital constraints
relative to the average RJV member (rcapconijt). We de…ne the measure of …rm size
relative to the RJV as
rassetijt =
assetsit 1 avgassetsjt 1
avgassetsjt 1
; (4)
where avgassetsjt 1 are average assets of all members of the RJV in the period previous to
RJV j formation. Relative capital constraints, rcapconijt; are similarly de…ned, where we
usecashit as a proxy for capital constraints.
State of Economy Ghosal and Gallo (2001) suggest that antitrust enforcement by the
DOJ is countercyclical. R&D investments may also be counter-cyclical; when the economy
is weak …rms may lack su¢ cient internal resources to …nance long-term R&D projects so they may be more likely to rely on cooperative research arrangements. We include year
…xed e¤ects to capture any economic or time-speci…c variables relevant to RJV formation that are not captured in other variables.
4.2
Estimation
Firms that join RJVs join on average more than one.36 Hence, …rm i will form RJV j at timet if the value to doing so is larger than the value to not doing so. Let Vi0trepresent the value to …rm i of not joining a RJV :
Vi0t= 0rdit+ 0xi0t+"i0t; (5)
where rdit is the average annual intensity of R&D undertaken by …rm i when it is not in a
RJV. Hence, …rm i will join RJVj if Vijt>Vi0t where Vijt is given in equation (2). Notice that the number of feasible alternatives does not impact the decision to join a particular
RJV, although our model allows the number of RJVs a …rm is currently engaged in to impact the value to joining a RJV.
36 Our data indicate that the average number of RJVs …rms join is 1.721 (with a standard deviation of
We don’t observe Vijt or Vi0t, instead we observe whether …rm i enters a RJV. De…ne
Vijt 1Lj + 2LjHijt+ (rdijt rdit) + (xit xi0t) + zijt: (6)
Any model of RJV formation must address two issues regarding estimation, both relate to the observation that the value to …rmiof joining RJV j is a function of(rdijt rdit): That
is, …rms consider the expected e¤ect on R&D expenditures when considering whether to form a RJV. However, R&D intensity is in‡uenced by RJV formation. Thus, the …rst
issue to address concerns the endogeneity of R&D. The second issue concerns the e¤ect on
R&D from joining a RJV. We can construct (rdijt rdit) from the data when …rm j joins
a RJV. However, we do not observe rdijt if the …rm is not engaged in a RJV. We need a
consistent estimate of the expected e¤ect of RJV formation on R&D intensity when a RJV is not formed. The endogenous switching model estimation procedure (see Lee, 1978) allows
us to address the endogeneity and missing values issues and to obtain consistent parameter estimates. However, there is one more endogeneity concern related to the fact that Hijt is
a function of the market shares of member …rms and industry concentration and hence may
be endogenous. For instance, if establishing a RJV raises barriers to entry it could increase the market power of the involved …rms even if they do not collude. We have included the
measure of the market power separately (in the zijt) as well as interacted with the leniency
policy variable, but it is important to keep this caveat in mind when interpreting the results.
Estimation is based on the following equation of RJV formation
Pijt =Vijt+ ijt; (7)
where ijt "i0t "ijt N(0; 2).37 We observe rdijt when …rm i is engaged in RJVj:
rdijt = 1wijt+u1it if Vijt> ijt (8)
where wijt includes a constant, the number of members of RJV j, …rm size relative to the
average RJV member (rassetijt), and capital constraints relative to the average RJV member
(rcapconijt). Note that the coe¢ cient on the constant term will pick up other e¤ects on R&D
37 The parameters ofV
of being in RJV such as cost-sharing. If …rm i is not engaged in RJVj we observe:
rdit = 0vit+u0it if Vijt< ijt (9)
where vit includes the assets and capital constraints faced by …rm i. We assume the
er-rors (u1; u0; ) N(0; ): To obtain asymptotically e¢ cient estimates, we simultaneously
estimate all the parameters of the model by full information maximum likelihood. The parameters of the model are =vecf 1; 2; ; ; ; 0; 1; g:38
4.3
Identi…cation
Our strategy to identify collusive intentions relies on the variation in RJV formation arising
from the revisions in the leniency policy. For this to be a reasonable quasi-experiment,
the leniency policy should impact collusive behavior but not a¤ect the other motivations to form a RJV. As discussed in section 2.1, there is su¢ cient evidence that the revision to
the leniency policy has been successful in curbing collusive behavior. Furthermore, there is no evidence that the DOJ changed the leniency policy with an intention to in‡uence RJV
formation or R&D investments directly.39
The leniency policy revision (…ne increase) applies to all …rms after 1993 (1995) so our results could be driven by some unobserved trends in the data. For this reason we construct
a “treatment”group that consists of potential colluders in the sense that these are …rms that have joined a RJV with other …rms in the same …nal goods industry. Our de…nition of which
…rms are in the treatment group depends upon the level of aggregation (i.e., which relevant
38 See Maddala (1983) p. 223-224. The model could be estimated in stages. First, consistent estimates
of the predicted probabilities (Pbijt)come from a reduced form probit regression obtained by substituting
equations (8) and (9) into (6). To control for the endogeneity of R&D, equations (8) and (9) are corrected by including control variables (constructed using the inverse Mill’s ratio and the predicted probit probabilities
b
Pijt): Least squares yields consistent estimates of the corrected R&D equations. The predicted values from
the corrected R&D equations are used to construct the predicted di¤erence in R&D intensity, (rdbijt
b
rdit), from joining a RJV for all …rm-RJV combinations. The probit selection equation in (7) could
be estimated after including the predicted R&D di¤erence as a regressor, which Lee (1978) shows yields consistent estimates of the parameters. However, to obtain asymptotically e¢ cient estimates all parameters of the model should be estimated simultaneously.
39 The revision appears to have been motivated by the desire to thwart international cartels. See
market) we are considering. Note that …rm i from industry k would be in the treatment group for a particular RJV j; if other …rms from industry k are in RJV j, but not in the treatment group for another RJV m; if there are no other …rms from industry k in RJV m:
We should also note that we do not have to rely on a discrete law change to identify
potentially collusive e¤orts as the e¤ect of the leniency policy revision on RJV formation is allowed to vary with a continuous measure of RJV market power (Hijt). While it is possible
that some unknown policy (that has not been controlled for) impacted the propensity to join
a RJV at the same time the leniency policy was revised, it is less likely that this hypothetical policy would vary with the RJV market power measure as well.
To summarize, the parameters of the model are identi…ed by i) the leniency policy ex-clusion restriction that should not impact R&D investments directly (equations (8) and (9))
rather only the decision to enter a RJV and ii) through nonlinearities in the model.40
5
Data
Our data cover the period 1986-2001.41 Information on RJVs comes from the CORE
database constructed by Albert Link (Link, 1996) and includes the name of the RJV, date of …ling, general industry classi…cation, and the nature of research to be undertaken. We
augment the CORE data with the names of the member …rms in each RJV in our time
frame, as reported in the Federal Register.42
Firm-level data come from the U.S. Compustat database, which includes industry
classi-…cation, assets, sales, free cash, and R&D expenditures for over 20,000 publicly traded …rms. There are a few data issues to address. First, small …rms are underrepresented. They are
less likely to …le a RJV application with the FTC since they are less likely to be the subject of antitrust investigation, and they are less likely to be in the Compustat database.43 As
40 These nonlinearities arise from the inclusion of the inverse Mill’s ratio in the corrected R&D equations.
41 Link and Bauer (1989) document that cooperative research e¤orts were occuring informally before the
NCRA was implemented in 1984. It is likely that RJV applications in 1985 may capture a portion of the pre-1985 stock. For this reason we include all RJVs starting in 1986.
42 See http://www.gpoaccess.gov/fr/index.html.
a result of losing small …rms, we observe a few RJVs with only one member, which we drop. If …rms add members to the RJV they are required to re…le with the FTC, therefore we
observe changes in the composition of RJV membership across years. Unfortunately, …rms do not re…le when the RJV is terminated. As a result, we observe new RJVs and changes
to RJV membership, but not end dates. In practice many RJVs do not span the period of our data; a RJV formed in 1986 is not likely to be around for new …rms to join in 2001. We
had to make some assumptions regarding the set of potential RJVs available for each …rm
to join (i.e., the choice set). We decided to “end” a RJV in the year that we last observe a member join.44 Imposing this restriction, there were 386 RJVs in all industries with an
average length of three years.45
The …rm’s choice set requires some additional explanation. One option would be to
assume that every …rm in the sample could join every RJV we ever observe in the data.
Given that there are thousands of RJVs in the sample and tens of thousand of …rm years this is computationally infeasible. It also assumes that all …rms could contribute to any
RJV. To narrow the viable options we assume a …rm could join any RJV that was formed or that exists in a given year in which the …rm exists. To make the explanation complete,
consider an example involving AT&T starting in 1986. AT&T’s choice set in 1986 includes all RJVs in 1986 in which at least one telecommunication …rm has joined –there were three
such RJVs of which it joined one. In 1987 two new RJVs that included telecommunications
…rms formed, so AT&T’s choice set in 1987 is four (the two continuing from 1986 which it did not join and the two new RJVs). It joined two of these. No telecommunications
…rms joined a RJV in 1988, so AT&T choice set in 1988 consisted of two RJVs (the two continuing from 1987 which it did not join) of which it joined one. Hence, the number of
RJVs in AT&T’s choice set (and the total number of RJVs joined) in each consecutive year
is 3(1), 4(3), and 2(4). AT&T’s choice set continues to evolve over the sample period with new RJVs being created and entering the choice set while others exit either because the …rm
joins or our ending rule removes the RJV from all the choice sets.
44 Our results are robust to changes in our end date assumption.
45 For more on RJVs …led under NCRA see Link (1996), who provides an overview; Majewski and
When considering the collusive intent of …rms it is important to be certain that the level of aggregation is not too broad, so as to include more …rms than the relevant antitrust market,
nor to narrow, so as to exclude potential rivals.46 This is di¢ cult to address in a sample spanning many industries, therefore, we do not focus on estimates from the entire pooled
sample.47 Instead, we consider three industries in detail: telecommunications, computer
manufacturing, and petroleum re…ning, which we discuss in turn.
5.1
Telecommunications Markets
The telecommunications sector is very important to the US economy and is a critical input in production as well as consumption. In addition to a history of potentially collusive behavior,
RJVs are common among rivals, where 38% of …rms involved in at least one RJV with another direct product market competitor. This history, coupled with an ability to construct a
well-de…ned antitrust market (due to the telecommunications regulatory mandate), makes the
telecom industry ideal for our study.
We consider …ve de…nitions of the relevant telecom antitrust market. At the most
aggre-gate (3-digit NAICS) industry level we consider two potential markets: …rms in “Broadcast Telecom” (NAICS 513) and …rms involved in telecommunications research, “Telecom RA,”
stated as the primary research area in their RJV …ling. There are reasons to believe that this level of aggregation may be too broad. For instance, Broadcast Telecom includes wired
telecommunications carriers, radio stations, television broadcasters, cable providers, and
wireless carriers, which are not always competitors with each other. The Telecom RA also includes …rms that are often in very di¤erent competitive markets (e.g., …rms in publishing
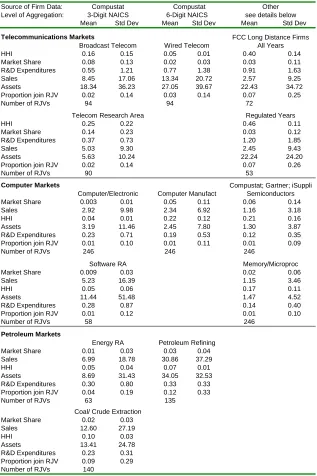
as well as chemical manufacturing) . Indeed, the descriptive statistics presented in the top panel of Table 1 indicate the Broadcast Telecom market is less concentrated as given by
the 3-digit Her…ndahl Index (HHI, which is calculated as the sum of squares of the market
shares of all …rms in the relevant industry).
46 See Werden (1988) and Pittman and Werden (1990) for a discussion of the divergence between industry
classi…cations and antitrust markets.
Source of Firm Data: Compustat Compustat Other
Level of Aggregation: 3-Digit NAICS 6-Digit NAICS see details below
Mean Std Dev Mean Std Dev Mean Std Dev
Telecommunications Markets FCC Long Distance Firms
Broadcast Telecom Wired Telecom All Years
HHI 0.16 0.15 0.05 0.01 0.40 0.14
Market Share 0.08 0.13 0.02 0.03 0.03 0.11
R&D Expenditures 0.55 1.21 0.77 1.38 0.91 1.63
Sales 8.45 17.06 13.34 20.72 2.57 9.25
Assets 18.34 36.23 27.05 39.67 22.43 34.72
Proportion join RJV 0.02 0.14 0.03 0.14 0.07 0.25
Number of RJVs 94 94 72
Telecom Research Area Regulated Years
HHI 0.25 0.22 0.46 0.11
Market Share 0.14 0.23 0.03 0.12
R&D Expenditures 0.37 0.73 1.20 1.85
Sales 5.03 9.30 2.45 9.43
Assets 5.63 10.24 22.24 24.20
Proportion join RJV 0.02 0.14 0.07 0.26
Number of RJVs 90 53
Computer Markets Compustat; Gartner; iSuppli
Computer/Electronic Computer Manufact Semiconductors
Market Share 0.003 0.01 0.05 0.11 0.06 0.14
Sales 2.92 9.98 2.34 6.92 1.16 3.18
HHI 0.04 0.01 0.22 0.12 0.21 0.16
Assets 3.19 11.46 2.45 7.80 1.30 3.87
R&D Expenditures 0.23 0.71 0.19 0.53 0.12 0.35
Proportion join RJV 0.01 0.10 0.01 0.11 0.01 0.09
Number of RJVs 246 246 246
Software RA Memory/Microproc
Market Share 0.009 0.03 0.02 0.06
Sales 5.23 16.39 1.15 3.46
HHI 0.05 0.06 0.17 0.11
Assets 11.44 51.48 1.47 4.52
R&D Expenditures 0.28 0.87 0.14 0.40
Proportion join RJV 0.01 0.12 0.01 0.10
Number of RJVs 58 246
Petroleum Markets
Energy RA Petroleum Refining
Market Share 0.01 0.03 0.03 0.04
Sales 6.99 18.78 30.86 37.29
HHI 0.05 0.04 0.07 0.01
Assets 8.69 31.43 34.05 32.53
R&D Expenditures 0.30 0.80 0.33 0.33
Proportion join RJV 0.04 0.19 0.12 0.33
Number of RJVs 63 135
Coal/ Crude Extraction
Market Share 0.02 0.03
Sales 12.60 27.19
HHI 0.10 0.03
Assets 13.41 24.78
R&D Expenditures 0.23 0.31
Proportion join RJV 0.09 0.29
Number of RJVs 140
[image:27.612.148.465.116.592.2]Notes: An observation is a firm-year pair. Sales, assets and R&D expenditures are in billions of chain weighted $2004. Gartner and iSuppli shares are from published reports. HHI are calculated at either the 3- or 6-digit NAICs depending on the market definition.
Table 1: Descriptive Statistics
As we re…ne the market de…nition to “Wired Telecom” (6-digit NAICS) we …nd a less
same as a percentage of their sales (7%). While signi…cantly narrower, this de…nition may still be too broad to be the relevant antitrust market. Wired Telecom consists of all …rms
o¤ering local and long distance telephony, which were not overlapping markets during the period of telecommunications regulation (prior to 1996).
Our …nal de…nitions of the relevant market uses data from the FCC’s Report of Common Carriers,48 which permits us to further divide telecom …rms into those o¤ering long distance
versus local service. Furthermore, the FCC data include all …rms in telephony regardless
of size. Our …nal two de…nitions of the relevant market consist of all …rms o¤ering long distance services. Over all years of the data (1986-2001) the market of long distance …rms
may be too narrow since after 1996 long distance carriers were permitted to o¤er local services. Therefore, we also consider a subset of the long distance market restricted to the
years of regulation. Although the latter is a relatively small sample, this market de…nition
is particularly attractive since, by law, the market includes only these …rms and these …rms are not permitted to enter other telecom markets. Table 1 indicates that the market for
long distance services is much more concentrated relative to our other antitrust telecom market de…nitions. Furthermore, the long distance market was more concentrated during
the period of regulation with an HHI suggesting it operated similar to an industry with two equally sized …rms. Finally, on average more …rms join a RJV (7%) relative to other telecom
antitrust market de…nitions.
5.2
Computer Markets
The computer industry is a highly-evolving, rapidly-changing industry. It is characterized
both by upstream …rms (such as semiconductor producers) selling inputs to PC …rms, as well as PC …rms selling to …nal users. The industry consists of several large companies with
worldwide sales and a high degree of capital intensity. RJVs started to play a large role in
computer markets starting in the late 1980s with the formation of SEMATECH, and they continue to play a large role with over10%of all RJV …lings registered in computing related
markets. Unlike the telecommunications markets, the computer industry is unregulated
during our sample period and, hence, subject to competitive pressures that have increased the pace of technology (Jorgenson, 2001). Indeed, recently …rms in this industry have been
convicted of collusive behavior, which was revealed via the leniency policy, making it directly relevant to our study.
We consider …ve relevant market de…nitions and present descriptive statistics in the middle panel of Table 1. A broad de…nition consists of …rms engaged in the computer software
research area, “Software RA.”Most RJVs in memory-related industries are associated with
the software RA. However, this market de…nition is likely to be too broad as there are …rms from more than ten 3-digit NAICs industries engaged in software related research. The other
3-digit market de…nition, “Computer and Electronic Product Manufacturing,”encompasses …rms with NAICS classi…cations that begin with 334. These consist of …rms that manufacture
computers (such as Dell), computer peripherals, and communications equipment as well as
…rms that manufacture components for such products (such as Intel). As these …rms are not always rivals, indeed Dell is a customer of Intel, the Computer and Electronic Product
Manufacturing market is also likely to be too broad a market de…nition.
A narrow de…nition comprises establishments that engage in manufacturing or
assem-bling of electronic computers (such as mainframes, personal computers, servers, etc.). The “Computer Manufacturing”de…nition consists of all 6-digit NAICS starting with 33411 and
encompasses …rms such as Dell, HP, Sun, and Apple. This is a more convincing relevant
market, as it does not contain semiconductor manufacturers and hence is more likely to consist of product rivals to the extent that …rms selling mainframes compete with PC …rms.
The second 6-digit de…nition includes …rms that are engaged in manufacturing semicon-ductors and other components for electronic applications. The “Semiconsemicon-ductors”de…nition
consists of all 6-digit NAICS starting with 3344 and includes …rms such as Intel, AMD,
Micron, and Motorola. Semiconductors are used as inputs in computer products, in commu-nications equipment, and in electronics. Semiconductor production, which consists primarily
of memory chips and microcomponents, constitutes the largest component of the computer industry. Examining the market at this narrow level is particularly worthwhile given the
that the number of observations are fewer and perhaps not su¢ cient to estimate our model. Furthermore, there are two issues with using the Compustat data at this level. First,
Com-pustat provides total sales data for publicly traded US …rms, but does not break sales down at the level of detail we require. For instance, IBM’s Microelectronics division was involved
in semiconductor sales during the 1990s. However, IBM is one of the world leaders in main-frame computers, thus using the Compustat sales data (which is for all of IBM’s divisions)
will lead us to over-estimate the importance of IBM in the semiconductor industry.
Sec-ond, there are many foreign …rms in the semiconductor industry, some of which are major players, such as Samsung, Toshiba and In…neon. If …rms in the US enter RJVs to facilitate
international collusion then the Compustat data will not give us an accurate measure of the RJV market power if it does not take into account sales of international …rms. To overcome
these problems, we augment the Compustat data with sales data for semiconductor …rms
published by Gartner Group and iSuppli Corporation.49 These data are provided for the top worldwide semiconductor …rms (constituting 50% to 70% of worldwide sales) and are
limited to sales of semiconductors.50 We use the data on non-US …rms to get an accurate measure of the RJV market power as we have information on all worldwide members of the
RJV. We use the Gartner/iSuppli sales data from US …rms together with Compustat data (on R&D expenditures, etc.) to estimate the model.
While much more narrow than the other relevant markets, the Semiconductor de…nition
consists of …rms that manufacture and sell their chips (such as Intel and Samsung) as well as …rms that outsource the manufacturing to other companies (such as Qualcomm). The
manufacturing of microprocessors (CPUs) and memory chips (such as dynamic random ac-cess (DRAM), static random acac-cess, and ‡ash memory) accounts for approximately half of
the sales of semiconductors. Our …nal narrow market de…nition consists of …rms that
man-ufacture microprocessors and memory chips. This market encompasses producers of DRAM who were involved in the recent antitrust amnesty case. Furthermore, RJVs play a large
49 Prior to 2000 the sales data are from Gartner Dataquest Press Releases (www.gartner.com) and
post-2000 data are from iSuppli Corporation (www.isuppli.com). Sales data are released in March.
50 The press releases report the sales for the top 20 …rms (approximately 70% of total semiconductor sales)
role in microprocessor and memory production. Indeed, the largest …rms in the market for Flash memory products are AMD and Fujitsu, who are the only members of a joint venture
in this area (named Spansion Inc.). We again use the …rm level sales data provided by Gartner/iSuppli combined with the Compustat data to estimate this market de…nition.
As Table 1 indicates, …rms have high R&D intensities (ranging from 8 to 12%; on aver-age). Indeed, semiconductor companies rank highest in R&D intensity: approximately 13%
worldwide, which is higher than R&D intensity in pharmaceutical markets. In our data …rms
in the semiconductor industry spend10% of their sales on R&D, with …rms in memory and microprocessing spending 12%. Furthermore, as the market de…nition narrows the
num-ber of RJVs stays the same or increases and market concentration grows substantially with industry concentrations at the 6-digit level consistent with moderate concentration levels.
5.3
Petroleum Markets
Our …nal set of markets involves …rms in petroleum related production, where the prevalence of numerous overlapping RJVs involving product market rivals is most pronounced. The
importance of oil production worldwide, the existence of an international cartel, and the high degree of multi-market contact make this industry worthwhile to consider.
The petroleum industry is organized into four broad sectors: exploration and production of crude oil and natural gas; transport; re…ning; and marketing and distribution. Due
to data limitations common to studies in this industry, we are only able to examine three
market de…nitions.51 Our …rst broad 3-digit de…nition contains …rms engaged in “Coal and Crude Oil Extraction” who focus on the transformation of crude petroleum and coal
into usable products. The dominant process in the transformation is petroleum re…ning that involves the separation of crude petroleum into components. In addition, this subsector
includes establishments that further process re…ned petroleum and coal products to produce
related products such as asphalt coatings and petroleum lubricating oils. Our more narrow de…nition focuses on …rms engaged in petroleum re…ning (de…ned at the 6-digit NAICS).
51 Unfortunately due to the presence of the OPEC cartel it is di¢ cult to …nd accurate data on sales of