Alaska Department of
T
ransportation & Public Facilities
Alaska University
T
ransportation Center
Feasibility Study of RFID Technology for
Construction Load Tracking
Final Report
FHWA-AK-RD-12-27
INE/AUTC # 10.07
Prepared By:
Morgan Henrie, PMP, Ph.D
University of Alaska Anchorage
Mike Ronchetti, PMP, MBA
RFIDcomplete, LLC
December 2010
Alaska University Transportation Center Duckering Building Room 245
P.O. Box 755900
Fairbanks, AK 99775-5900
Alaska Department of Transportation Research, Development, and Technology Transfer
2301 Peger Road
Fairbanks, AK 99709-5399
REPORT DOCUMENTATION PAGE
Form approved OMB No.
Public reporting for this collection of information is estimated to average 1 hour per response, including the time for reviewing instructions, searching existing data sources, gathering and maintaining the data needed, and completing and reviewing the collection of information. Send comments regarding this burden estimate or any other aspect of this collection of information, including suggestion for reducing this burden to Washington Headquarters Services, Directorate for Information Operations and Reports, 1215 Jefferson Davis Highway, Suite 1204, Arlington, VA 22202-4302, and to the Office of Management and Budget, Paperwork Reduction Project (0704-1833), Washington, DC 20503
1. AGENCY USE ONLY (LEAVE BLANK)
FHWA-AK-RD-12-27
2. REPORT DATE December 2010
3. REPORT TYPE AND DATES COVERED
Final Report (12/01/2009 to 12/31/2010)
4. TITLE AND SUBTITLE
Feasibility Study of RFID Technology For Construction Load Tracking
5. FUNDING NUMBERS AUTC#RR08.12 DTRT06-G-0011 T2-08-09 6. AUTHOR(S) Morgan Henrie, PMP, Ph.D. Mike Ronchetti, PMP, MBA
7. PERFORMING ORGANIZATION NAME(S) AND ADDRESS(ES) Alaska University Transportation Center
P.O. Box 755900 Fairbanks, AK 99775-5900
8. PERFORMING ORGANIZATION REPORT NUMBER
INE/AUTC 10.07
9. SPONSORING/MONITORING AGENCY NAME(S) AND ADDRESS(ES) Alaska Department of Transportation
Research, Development, and Technology Transfer 2301 Peger Road Fairbanks, AK 99709-5399 10. SPONSORING/MONITORING AGENCY REPORT NUMBER FHWA-AK-RD-12-27 11. SUPPLENMENTARY NOTES
12a. DISTRIBUTION / AVAILABILITY STATEMENT
No restrictions
12b. DISTRIBUTION CODE
13. ABSTRACT (Maximum 200 words)
ADOT&PF is seeking more efficient business practices and processes to increase its speed in delivering supplies to work sites, optimize the workforce, and minimize costs. The current tracking process uses a computer-generated ticket carried by the truck driver to the dump point. The truck driver initially receives a cargo ticket while loading. The load weight is recorded on the ticket at a plant weigh scale. At the dump point, the ticket is handed to a ticket taker on the grade. The ticket taker records additional information on the ticket such as the time and the station of the dump point. At least four people handle this cargo tracking ticket: a truck driver, scale person, ticker taker, and an office person. A driver must maintain possession of the ticket at all times during cargo or load transportation, by state and federal regulations. A scale person updates this ticket. A ticket taker at the end records the final data. An office person tallies the day’s tickets to create an account payable item (payment) to the carrier or driver. These tracking tickets must be physically stored for three years after project date of completion. Technologies such as RFID and GPS can be used to track or record the same data. This study is exploring using new technologies to improve this process. These changes could also improve new project planning, management, and tracking of transportation operational data. In the past year, the research team has completed a literature review, purchased the necessary test RFID equipment, installed the new system in the field, and begun data collection.
14- KEYWORDS: Radio frequency identification (Dmbjs), Detection and identification
system applications (Dmby)
15. NUMBER OF PAGES 44 16. PRICE CODE N/A 17. SECURITY CLASSIFICATION OF REPORT Unclassified 18. SECURITY CLASSIFICATION OF THIS PAGE Unclassified 19. SECURITY CLASSIFICATION OF ABSTRACT Unclassified 20. LIMITATION OF ABSTRACT N/A
NSN 7540-01-280-5500 STANDARD FORM 298 (Rev. 2-98)
Notice
This document is disseminated under the sponsorship of the U.S. Department of
Transportation in the interest of information exchange. The U.S. Government assumes no liability for the use of the information contained in this document.
The U.S. Government does not endorse products or manufacturers. Trademarks or manufacturers’ names appear in this report only because they are considered essential to the objective of the document.
Quality Assurance Statement
The Federal Highway Administration (FHWA) provides high-quality information to serve Government, industry, and the public in a manner that promotes public
understanding. Standards and policies are used to ensure and maximize the quality, objectivity, utility, and integrity of its information. FHWA periodically reviews quality issues and adjusts its programs and processes to ensure continuous quality improvement.
Author’s Disclaimer
Opinions and conclusions expressed or implied in the report are those of the author. They are not necessarily those of the Alaska DOT&PF or funding agencies.
SI* (MODERN METRIC) CONVERSION FACTORS
APPROXIMATE CONVERSIONS TO SI UNITS
Symbol When You Know Multiply By To Find Symbol LENGTH in inches 25.4 millimeters mm ft feet 0.305 meters m yd yards 0.914 meters m mi miles 1.61 kilometers km AREA
in2 square inches 645.2 square millimeters mm2 ft2 square feet 0.093 square meters m2 yd2 square yard 0.836 square meters m2
ac acres 0.405 hectares ha
mi2 square miles 2.59 square kilometers km2
VOLUME
fl oz fluid ounces 29.57 milliliters mL
gal gallons 3.785 liters L
ft3 cubic feet 0.028 cubic meters m3 yd3 cubic yards 0.765 cubic meters m3
NOTE: volumes greater than 1000 L shall be shown in m3
MASS
oz ounces 28.35 grams g
lb pounds 0.454 kilograms kg
T short tons (2000 lb) 0.907 megagrams (or "metric ton") Mg (or "t")
TEMPERATURE (exact degrees)
o F Fahrenheit 5 (F-32)/9 Celsius oC or (F-32)/1.8 ILLUMINATION fc foot-candles 10.76 lux lx fl foot-Lamberts 3.426 candela/m2 cd/m2
FORCE and PRESSURE or STRESS
lbf poundforce 4.45 newtons N
lbf/in2 poundforce per square inch 6.89 kilopascals kPa APPROXIMATE CONVERSIONS FROM SI UNITS
Symbol When You Know Multiply By To Find Symbol LENGTH mm millimeters 0.039 inches in m meters 3.28 feet ft m meters 1.09 yards yd km kilometers 0.621 miles mi AREA
mm2 square millimeters 0.0016 square inches in2 m2 square meters 10.764 square feet ft2 m2 square meters 1.195 square yards yd2
ha hectares 2.47 acres ac
km2 square kilometers 0.386 square miles mi2
VOLUME
mL milliliters 0.034 fluid ounces fl oz
L liters 0.264 gallons gal
m3
cubic meters 35.314 cubic feet ft3
m3 cubic meters 1.307 cubic yards yd3
MASS
g grams 0.035 ounces oz
kg kilograms 2.202 pounds lb
Mg (or "t") megagrams (or "metric ton") 1.103 short tons (2000 lb) T
TEMPERATURE (exact degrees)
o C Celsius 1.8C+32 Fahrenheit o F ILLUMINATION lx lux 0.0929 foot-candles fc cd/m2 candela/m2 0.2919 foot-Lamberts fl
FORCE and PRESSURE or STRESS
N newtons 0.225 poundforce lbf
kPa kilopascals 0.145 poundforce per square inch lbf/in2
*SI is the symbol for th International System of Units. Appropriate rounding should be made to comply with Section 4 of ASTM E380. e (Revised March 2003)
v
Table of Contents
DISCLAIMER ... iii
Table of Contents ... v
List of Figures ... vi
List of Tables ... vii
Acknowledgements ... viii
Abstract ... ix
Summary of Findings ... x
CHAPTER 1 - INTRODUCTION ... 1
Problem Statement and Research Objective ... 2
Scope of Study ... 3
Research Approach ... 3
CHAPTER 2- LITERATURE REVIEW ... 6
High Temperature Testing ... 6
Asphalt Paving ... 7
RF Signal and Data Accuracy ... 7
Performance Variables ... 10
Summary ... 10
CHAPTER 3 – FINDINGS ... 11
As-is Analysis ... 11
Data Analysis ... 12
Table 1: Truck Round Trip Statistical Analysis. ... 13
Asphalt Plant Time Analysis ... 14
Table 2: Truck Time in Asphalt Plant... 15
On The Job Time ... 15
Table 3: Truck Time on Job ... 16
Truck Travel Time ... 16
Table 4: Truck Travel Time ... 17
Summary of Data Analysis ... 17
CHAPTER 4 - INTERPRETATION, APPRAISAL, AND APPLICATIONS ... 18
Research Limitations ... 19
General Recommendations ... 20
CHAPTER 5 - CONCLUSIONS AND SUGGESTED RESEARCH ... 21
Suggested Research ... 21
REFERENCES ... 23
vi
List of Figures
Figure 1: Research Approach... 4
Figure 2: RFID Tab Mounted on a Hauling Truck (adjacent license plate - left side) ... 4
Figure 3: Granite scale in Anchorage with stationary pole and RFID reader/antenna in the foreground. The PaveTag™ processing hardware is the gray box sitting on top of the concrete support, next to the antenna pole. Photo by Janet Burton, University of Alaska. .... 5
Figure 4: Weight Scale ... 5
Figure 5: Construction paver, CAT AT-1055. Mike Ronchetti is attaching an RF reader. Photo by Janet Burton, University of Alaska. ... 6
Figure 6: As-Is System Map ... 11
Figure 7: Number of Asphalt Material Movements per Truck ... 12
Figure 8: Per Truck Statistical Results... 13
Figure 9: Truck Time in Asphalt Plant ... 14
Figure 10: Truck Time on Job ... 15
vii
List of Tables
Table 1: Truck Round Trip Statistical Analysis ... 13
Table 2: Truck Time In Asphalt Plant ... 15
Table 3: Truck Time on Job ... 16
viii
Acknowledgements
This research reported herein was performed under AKDOT&PF/AUTC Project No. C-08-01 by the University of Alaska Anchorage (UAA) College Business and Public Policy (CBPP), School of Logistics, Anchorage, Alaska and RFIDcomplete, LLC. UAA CBPP was the contractor for this study. The work undertaken by RFIDcomplete, LLC dba Intertiviti was under a subcontract to UAA CBPP to provide technical support and project assistance.
Oliver Hedgepeth, Ph. D. and Morgan Henrie, PhD., PMP were the principal investigators. Mike Ronchetti is the other author of this report and is the owner of RFIDcomplete, LLC.
The literature review and documentation was performed under the general supervision of Dr. Hedgepth. Dr. Hedgepeth provided further oversight of the Radio Frequency Identification (RFID) technical selection and program overview. Mike Ronchetti provided the general supervision over the project deployment, field installation, data collection and analysis. Dr. Henrie provided the general supervision to development of the final report with the assistance of Mike Ronchetti.
ix
Abstract
This study was commissioned to test whether the RFID Technologies are resilient enough to survive environmental operating conditions such as vibration, heat, dust, and that the data is sufficiently reliable that project personnel could use it for near real time tracking and planning purposes. PaveTag’s Radio Frequency Identification (RFID) was chosen because it is a complete system developed expressly for tracking construction materials and provides documentation which may increase the efficiency of tracking those materials. This report documents and presents the results of the Alaska Department of Transportation and Public Facilities (ADOT&PF) road construction material transportation RFID automatic logging and tracking feasibility study. System level testing was performed on a road construction project to test RFID technology capabilities and concepts of automatically identifying and tracking material hauling vehicles from an asphalt production facility to a road construction site. The system test included six asphalt hauling trucks with fixed RFID readers at the asphalt plant and at the construction site. The data was uploaded to the RFID vendor’s data base using cellular phone connectivity to test the reliability of cell phone data collection. Data included the truck identification tag number, arrival and departure times from the asphalt plant, as well as arrival and departure times on the construction site. These time stamps provide the ability to calculate the time it takes to load each truck, wait time at the construction site, as well as round trip time for each trip. The data was used to evaluate whether the system could help the ADOT&PF improve the tracking of asphalt material to the job site.
x
Summary of Findings
ADOT&PF’s feasibility study of Radio Frequency Identification (RFID) technology for construction load tracking met all the predetermined project goals. Specifically, a meaningful case scenario was developed and implemented: to test the use of RFID technologies on highway construction projects. This scenario clearly demonstrated that the integrated system is capable of withstanding the operation environments, such as vibration, heat, dust, and weather conditions encountered in this field test.
The efforts also met the research goal of accurately tracking asphalt transportation from an asphalt plant to a construction site using automatic data capture technology. For the duration of the test time frame, each of the six RFID tagged trucks load movements, including arrival and departure times were automatically captured and recorded. The RFID reader data at the jobsite and the scale house data were in complete agreement indicating that the RFID data were at least as accurate as the paper tickets. Based on the recorded data, the resulting analysis is able to derive the average truck:
• asphalt loading time = 7.69 minutes
• on the job off-loading time = 10.91 minutes
• travel time = 32.61 minutes
• round trip travel time = 51.12 minutes
While this feasibility study met the research objectives, the study has several limitations. These limitations include:
1. The study was conducted in an area where cellular communications are readily available. Many areas where ADOT&PF works have intermittent or no cellular communication available. The test does not demonstrate how an automatic capture system can be deployed in an area where telecommunication service is intermittent due to geographical or telecommunication site limitations. This is not a limitation to the base information required by ADOT&PF since they are only interested in the quantity of material delivered to the project, not any other information requiring real-time analysis. However, the team wanted to determine if cell phone coverage could be leveraged to transmit the data to a central location to track and manage the trucks.
2. No direct comparison to the manual system data such as location within the jobsite, quantity deductions due to waste, and asphalt temperature was performed. Instead, the study focused on comparing the material hauled by the truck, when it left the scale and when it arrived on the jobsite. Performing a direct comparison between the automatic data capture and manual system could quantify any reductions in data entry error as well as timeliness of data available to the decision makers. No attempt was made to automate comparison between the two systems, beyond the comparison between scale house data and RFID data.
xi 3. It does not automate the process of determining the location of placement of the asphalt or recording of waste. By incorporating technology ADOT&PF may be able to improve their cost efficiency and effectiveness while providing the same or an improved quality of work, then providing a recommended procurement, testing, and measurement process is essential. Moving the application from a feasibility study to an applied application was not an objective of the current initiative but it is required to maximize future applications. It is recommended that ADOT&PF continue this line of applied research. The following identifies some suggested research topics that, if implemented, would advance the application of this technology within the integrated system.
1. Develop protocols for the following:
a. Measure and record asphalt temperature at the time of delivery.
b. Record the location on the project at which the material was delivered and compute the quantity of material placed per unit area or unit length.
c. Certification of the placement of the material as required by FHWA
d. Ensure data integrity and security either by producing paper tape or through data backup.
e. Track waste material which is deducted from the total quantity.
2. Develop an integrated automatic capture system that allows communications in areas of intermittent as well as continuous cellular communication. ADOT&PF area of responsibility occurs in areas with varying strength of telecommunication services. Developing a system which provides for automatic data capture in most ADOT&PF construction areas would enhance the final system capabilities.
3. Research the ability to expand the tested RFID automatic capture system to include weight measurements, material weight, and load travel time tracking per contractor. This research would apply the technology at several scale facilities, for multiple products, and for multiple contractors. Implementing an integrated, multi-contractor, multi-material automatic data capture process could provide an enhanced material tracking and utilization capability.
4. Future research should develop methods to integrate the automatic data captured by ADOT&PF operations, as well as how to provide the data to contractors. Developing and implementing a fully integrated automatic data system that ADOT&PF and their contractor have access to would provide the ability for greater utilization of raw data and support the ability for the contractor to make operational changes such as the number of trucks or modifying the haul routes. A key in the integrated research effort would be development of RFID vendor neutral system implementation and utilization specification. The specification could be incorporated within ADOT&PF bid documents and subsequent contracts as requirements that the contractors must adhere to.
Taking these next steps can help ADOT&PF and the contractor improve its cost efficiency as well as increase project effectiveness while maintaining or improving overall project quality.
1
CHAPTER 1 - INTRODUCTION
ADOT&PF’s load tracking process is predominately a manual effort. ADOT&PF’s tracking process uses a computer-generated ticket carried by the truck driver to the dump point. Specifically, when the loaded truck is weighed, a computer-generated ticket is printed out. This ticket contains, the load weight, the time the truck was weighed, along with other data. The truck driver receives this cargo ticket and transports it to the dump point. At the dump point, the ticket is handed to a ticket taker on the grade. The ticket taker records additional information on the ticket, such as the time and the dump station.
In this manual process there are at least four people handling this cargo tracking ticket: a truck driver, scale person, ticket taker, and an office person. A scale person generates this ticket. A driver is responsible for maintaining possession of the ticket at all times during the load transportation process. A ticket taker at the end records the data. An office person tallies the day’s tickets to compute quantities for contractor payment. Since the tickets are a source document, they must be stored for a minimum of three years after the project closes.
RFID technology offers potential savings in labor costs, increased safety to project personnel, as well as a reduction in the amount of paper generated to track material. It also offers enhanced data capture and communication capabilities that not only allows for tracking load travel times but other capabilities such as automatically logging weight. ADOT&PF has a responsibility to its stakeholders to operate in a cost effective manner as it continues to meet its mission as the state’s custodian for transportation infrastructures. Technology can help ADOT&PF exceed expectations as new technologies help ADOT&PF meet its obligation.
In other industries—such as the military and retail industries—automatic data capture systems, including RFID, have been successfully utilized to monitor and track the movement of goods and material between locations. These implementations have achieved greater accuracy in the data captured and faster delivery of data to decision makers. These characteristics are positive outcomes of utilizing this technology which could be realized within ADOT&PF road construction material transportation system.
RFID tags have been used since the 1940s. There two basic types of RFID tags—passive and active. Passive tags have no internal power source. Rather, passive tags convert radio frequency energy emitted from the reader into a DC current which in turn provides power to a micro-chip placed at the center of an antenna array. The low level of energy emitted requires the tag be within a few feet of the reader. Passive tags are routinely used in the commercial sector to reduce theft and track inventory as it moves from the warehouse to the sales floor. These tags have also been used to track tools in and out of a factory tool room. The cost of these tags can be as low as three cents per tag.
Active RFID tags use a battery powered system to store and transmit data. Active tags can contain sensors for temperature, pressure, shock, and time. Active tags are now routinely used by the military to track cargo transported in warzones which is a testament to their resilience.
2 Other documented uses include tracking fresh fish from Alaska to markets throughout the US. When the fish arrives at its destination, the tags can be read and checked to ensure temperature and the age of the fish remained within acceptable limits. Another advantage of active tags is that they can be read up to 100 feet from the reader. Because active tags cost between $30 and $100 per tag it is desirable to reuse the tags.
Combining RFID, and telecommunication technologies creates an integrated and automated system that can be used to track and record the same data that is currently captured by manual efforts. Automating the manual process has the potential advantages of reducing the number of people involved and the number of data entry errors, as well as faster data transfer capabilities, enhanced data analysis capabilities, and more timely payment processing. Having more timely and accurate data provides the opportunity to improve cost efficiency and overall system effectiveness, such as informed decision making, while maintaining or improving quality of the final result.
The integration of RFID technology also provides potential benefits to the contractor by allowing real-time tracking of each truck. This allows for identifying bottle necks or optimizing the number of trucks used to transport the asphalt. The plant operator can also use the information to balance the truck flow by managing the spacing between the trucks. The paving foreman can alter the paver speed based on the expected arrival of the next truck.
Problem Statement and Research Objective
The major problem with tracking asphalt delivery is that the process of tracking and documenting the placement of materials on the project is labor intensive. The current ADOT&PF system of tracking material such as asphalt to the jobsite is heavily reliant on manually transferring truck load tickets between the loading and construction sites. This process requires personnel to physically retain the tickets, transfer the tickets, enter key data on each ticket, and later manually enter the data. The predominately manual based system is subject to human errors, time delays in data transfer, and it does not provide for near real time decision support information transfer. Applications of RFID/GPS based systems are postulated as an approach that can overcome the limitations and errors of the current state including a reduction in manpower.
A key objective of this study is to develop meaningful case scenarios to test a particular RFID/GPS tool. For this specific test, the Minds, Inc. PaveTag application was used. PaveTag was selected because it is a turnkey system with a proven track record in other construction applications.
Another key objective is to accurately track asphalt transportation from the asphalt plant to the construction site using automatic data capture technology. Fulfillment of this objective requires an accurate understanding of the requirements of the existing tracking system and the process by which new technologies can meet these needs. The details of the various steps are discussed in the Research Approach section.
3
Scope of Study
The scope of this study is to understand whether implementing an automated data capture system can benefit both ADOT&PF and the contractor, the technical issues concerning its implementation, and identify improvements that may be required. The data collection system utilizes RFID to track the material from the plant to the jobsite. The automatic data capture system was based on RFID/GPS/Cellular phone technology and the RFID technology system supplier data capture software.
The scope of effort includes acquisition and data analysis of all RFID system recorded data. This analysis statistically determines the data capture rate, average truck round trip travel times, maximum and minimum round trip times, and aggregate results.
Research Approach
This study follows a sequential approach where each step builds on previous effort. The research approach is separated into three specific phases with intermediate steps. The following outlines the major phases and the major steps of each phase. As part of each major step an anticipated outcome description is included:
Phase 1: Foundation Data/Information Development
1. Develop the existing state. This effort documents how the current system operates. This establishes the foundational understanding of the key activities that occur within the process.
2. Conduct an RFID system literature review. The literature review identifies any research that is similar to the current scope of work as well as any lessons learned that can be leveraged within this feasibility study. Understanding previous research efforts allows this effort to build on those endeavors to advance the knowledge in this type of system implementation.
Phase 2: Field System Design and System Acquisition
3. Develop an automatic data capture system design. The automatic data capture system design merges the technology features and functions within the as-is system. The new system provides full material transportation movement tracking, as required in the as-is state, yet optimally leverages technology to provide a cost efficient, effective, and lower error occurring system.
4. Perform an RFID system vendor search. The objective of the vendor search was to identify at least one vendor whose technology meets the needs of this feasibility study. Leveraging acquisition of commercial-off-the-shelf (COTS) technology is a key element of cost mitigation for this and future efforts as COTS systems are historically lower cost than custom or one-of-a-kind system implementations.
Phase 3: Data Acquisition, Analysis, and Report Generation
5. Acquisition and implementation of the system designed in item #3.
6. Data acquisition. During the timeline of this effort, the automatic data acquisition system will acquire and store all available data.
7. Data analysis. In this phase of the study, all available data will be statistically analyzed to determine key attributes of round trip load time averages per truck, maximum and
4 minimum per truck round trip load times, and standard deviations. An aggregate statistical analysis will also be derived.
8. Write and distribute the final report.
Figure 1, below, demonstrates the general research approach.
Figure 1: Research Approach.
The successful research approach plan performed included developing the current state map, completion and documentation of the literature review, obtaining a COTS for field testing, and conducting the field test.
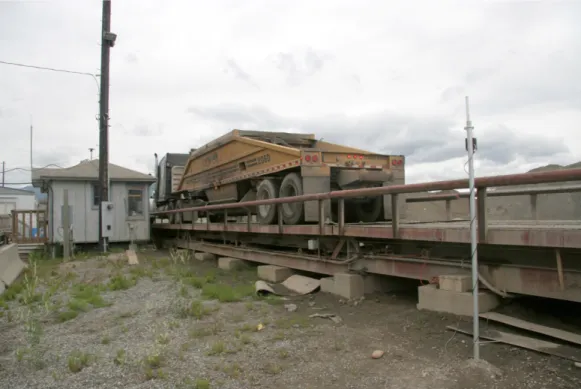
In performing the field test, the originally single planned RFID tagged asphalt truck tracking was expanded to six asphalt hauling trucks. Each of these six trucks were outfitted with a RFID tag as shown in Figure 1. A semi-permanent RFID reader was installed at the asphalt plant scales, Figure 3 and Figure 4, and a reader was deployed at the construction site by attaching it to the paver, Figure 5. The remote site data was communicated to the vendor database using cellular phone connections.
5
Figure 3: Granite scale in Anchorage with stationary pole and RFID reader/antenna in the foreground. The PaveTag™ processing hardware is the gray box sitting on top of the concrete support, next to the antenna pole. Photo by Janet Burton, University of Alaska.
6
Figure 5: Construction paver, CAT AT-1055. Mike Ronchetti is attaching an RF reader. Photo by Janet Burton, University of Alaska.
CHAPTER 2- LITERATURE REVIEW
This literature review was designed to “provide insight into ways in which the researcher can limit the scope” of this study. (Creswell, 2009, p. 23) It examines published documentation on the use of RFID tags focused on studies examining the road construction industry, specifically the use of asphalt truck tracking. The literature review is created to bridge any gaps between what is expected in the scope and problem definition of this study and any similar or comparative studies. (Creswell, 2009, p. 25) The time horizon for the documents reviewed is as of January 2005. Due to the significant increase in interest in the use of RFID technology for tracking and tracing vehicles and goods, it is expected that any published reports prior to 2005 would provide insufficient information or data.
High Temperature Testing
Ross, Burns, Wu, and Jarad (2009) conducted testing of passive RFID (Hedgepeth, 2007) tags in a laboratory environment. Part of the scope of their work was to simulate the harsh conditions RFID tags are expected to experience in the field in the future. They also performed chain-of-custody tracking and tracing of items in a building (p.3). The RFID tags used were from a variety of vendors, such as PSC, Think Magic, Motorola, and SATO (p. 4). The construction material used with such tags was “reinforcement steel, geosynthetics, and concrete cylinders” (p. 4). RFID tags were subjected to harsh field conditions simulated in a laboratory. These conditions included immersion in liquid (water, acid, base solutions), pressure testing, freezing and thawing, and exposure to extreme temperatures (pp. 5-6). The extreme temperature test consisted of
7 placing the RFID tags “into a paper cup inside the oven at 100ºC (212ºF) for a prolonged period of time” (p. 8). The temperature was increased over time and the read range measured at each temperature. The result was that “the read range for tags subjected to extremely high
temperatures tended to decrease with time” (p. 8). The read range varied from approximately seven to 17 feet between the RFID tag and the reader (p. 8). The reduction of effective read distance of a seven feet resulted only after exposure to a temperature of “250ºC (482ºF)” (p. 8).
Asphalt Paving
Kilpellainen, Heikkilam, and Parkkila (2007) conducted field research on “transportation of the mass to the work site, asphalt laying, and compacting” (p. 35). This was a qualitative research design (Creswell, 2009) consisting of interviews with construction professionals (p. 36), plus a quantitative research design tracking variables such as, “weather, traffic conditions, failures of the machines, the number of trucks available, and transportation distance” (p. 36). The
construction consisted of a mobile asphalt mixing plant with distances from the paving
construction site within 100 km (62 m) (p. 36). This distance for delivery became a key factor in the process of analyzing paving. Thus, a key factor in the analysis by Kilpellainen, Heikkila, and Parkkila (2007) was the need for the “asphalt production, transportation, spreading and
compacting” (p. 36) to work seamlessly. The asphalt loading temperature was not to “be lower than 150ºC (302ºF)” (p. 38). However, this was not a test of RFID technology. It was one of using other wireless communications devices, such as the cell phone, to report needed
measurement data, and embedded temperature sensors with long range data transmission devices (p. 38). However, “one of the disadvantages discovered is that the system is totally dependent on the users” (p. 37). This qualitative aspect of the research introduces the possibility of human error. The use of cell or mobile phones was useful to communicate activity at the work site. However, these wireless devices were not connected to temperature of other environmental or paving data collecting devices (p. 37). Kilpellainen, Heikkila, and Parkkila (2007) also indicated that the metrics to be captured for a complete supply route of one asphalt truck should include times for loading, transportation, waiting, unloading, returning, and waiting for loading (p. 37). Two other metrics were the transportation distance and the amount of asphalt mass transported (p. 37). This research identified the different types of professionals at the work site that could be interviewed if a qualitative research was needed for this current project including a work
supervisor, asphalt mixing plant operator, asphalt paver operator, and truck drivers (p. 37).
RF Signal and Data Accuracy
Lee, Song, Kwon, Chin, Choi, and Kim (2008) developed an RFID “gate sensor for real-time delivery status monitoring” (p. 101) of construction trucks entering and leaving a work site. While their field tests indicated that RFID signals could be read from a truck entering a fixed gate position, it was found that the physical placement of the antenna and RFID tag could “affect the recognition rate” (p. 105) of the signal. Lee, McCullouch (2007) conducted a study to
automate the manual tracking of truck tickets using bar codes instead of RFID tags. While the technology is different in many ways (Hedgepeth, 2007), the process of going from a manual system of collecting data from construction trucks to an automated system was comparable. One valuable lesson was identifying one additional potential data capture variable, the “driver and customer signature capture” (p. 11) which is required by many agencies. Lee and McCullouch
8 (2007) conducted a sample of different Departments of Transportation’s capabilities with manual tracking of trucks for material delivery to construction sites. Their study indicated that only two states, Louisiana and New Jersey (p. 22) had an automated system to track the delivery of construction materials from the pick-up point to the construction site. Other states contacted indicated the use of a manual or paper delivery system or field laptops for data dumping using the Internet (p. 23). When Lee and McCullouch asked different states about the need for automated tracking of trucks, “41% answered that they need an automated delivery tracking system” (p. 25). Of course, that 41% could be a bit misleading as they contacted only seven states (p. 25). Their final conclusion was that an “automated materials delivery records system will potentially be beneficial to all the project parties from material suppliers, trucking
companies, contractors, to the state” (p. 44). Fedrowitz (2007) analyzed the use of RFID technology for a Virginia DOT highway maintenance project. Their research indicated that for construction trucks moving from a parked position to 10 mph, the tags could be read at a distance of up to115 feet (p. 43). They also examined the capability of attaching fixed antennas for RFID tags to metal mile marker signs for trucks traveling at speeds of 10 to 65 mph. The distance from the readers varied from 5 to 100 feet (p. 34). Various antennas sizes were also employed in this field test. Arrington (2009) examined the causes of the loss of accuracy reported in the research conducted by Fedrowitz (2007). One of the Arrington’s findings was that, “the performance of RFID systems are adversely affected by water or wet surface” (p. 16). Field testing indicated that RFID “tags cannot be placed directly onto the metal mile marker sign” (p. 16). As for the rate of RFID tags data to be read by an antenna, this research indicated that the RFID “can handle 100 reads per second” (p. 17). While the field testing appears to have shown value in the use of RFID technology there was still needed “some method of ensuring data integrity” (p. 71). Wyld (2005) was one of the early supporters of RFID technology in government projects. A wide range of applications were evaluated. The study showed that RFID technology could be adapted to transportation applications.
Almanza, Hernandez-Gutierrez, and Ibarra-Manzano (2006) evaluated the tracking of vehicles and drivers crossing a gate or threshold using RFID technology. While this was not part of road construction efforts, it did point out the accuracy of RFID technology. One of the lessons learned was that “when a system is implemented with passive RFID tags range is highly dependent on antenna orientation because readers and tags must be magnetically coupled in order to
communicate” (p. 225). The knowledge gained in this study provided guidance for mounting RFID systems on a truck or paver.
Khan, Akhtar, and Qadeer (2009) bring up an interesting point that is often overlooked in programs planning to use RFID technology. They found that “only 23% of consumers have heard of RFID” (p. 334). The authors of this study also examined antidotal evidence from military and retail sources that indicated a high percentage of warehouse workers today do not know of RFID technology or how it compares to bar codes. This could be an issue for data capture and accuracy if workers in the field are not properly trained on the placement of RFID tags on construction equipment.
Ergen and Akinci (2009) evaluated RFID use in the construction industry. They indicate that the “construction industry mostly has dynamic and uncontrollable environments where tracking and locating materials and accessing related information is challenging” (p. 5). They found that while
9 RFID technology is successful in this industry, that “limitations of the current technology can be overcome by using some reasoning mechanisms that are developed and implemented for data cleaning and processing purposes” (p. 5). Data accuracy and data mining of the captured data is one of the emerging trends in the use of RFID (Hedgepeth, 2007).
Lim and Koh (2009) conducted studies to examine what they termed as the “organizational fit” for RFID technology. Their results indicate a higher level of match to the organizational values and objectives to the use of RFID. This suggests again that human errors could increase if the workers within the organization are not properly trained to understand the implications of using RFID technology.
El-Omari and Moselhi (2009) analyzed how to organize and store data collected from RFID systems. They indicated that the application of RFID tags “in the construction industry is hampered by the rough conditions of site operations that may damage barcode tags” (p. 493). They found that “RFID was introduced to overcome barcode drawbacks” (p. 493). Barcodes only contain information concerning the product which must then be connected to a database for detail. The data in barcodes is static which does not allow data such as temperature to be collected.
Closely aligned to the accuracy of RFID signal is standardizing the functionality of the tags. Engels and Sarma (2005) highlight a potential problem with “vendor specific functionality” (p. 5) in the use of RFID tags. This is an old warning in this technology since its surge in 2005 (Hedgepeth, 2007), but the warning bears paying attention to. If the functional data capture of tags in the construction industry is not standard in its data capture protocols, this could cause some issue with communicating the results to others in the construction industry.
Wang (2007) indicated that construction companies “began to examine the use of barcodes for tool management in the early 1990s” (p. 469) and, as a result, construction companies are not new at using automated methods of data capture. However, as in previous research, barcodes have been found to have “problems in the construction industry due to poor durability and the requirement for close proximity reading” (p. 469). The barcode “becomes unreadable when scratched or dirty” (p. 469). The implication is that RFID technology with its non-line-of-sight capability provides better data capture and accuracy than barcodes (Hedegpeth, 2007; Wang, 2007).
Song, Haas, and Caldas (2006) found that the amount of power used in RFID tags are a consideration if they are to work properly in the construction industry (p. 914). They also developed metrics for data collection. Their metrics were “the maximum number [sic] of reads that can be contribute to each … set of proximity information” (p. 915). They measured the number of tags, pattern of placement, and number of data reads (p. 915). They found that “approximately 68% of the experiments when the medium if power is in use” (p. 916). That is, “although economic considerations were factored into the development…potential economic feasibility should be estimated to justify up-front cost of implementation” (p. 917). This is indeed the case, and Newnan, Lavelle, and Eschenbach (2009) provide a foundation for RFID
calculations for future worth calculations. Their study goes beyond the scope of this current research study, but should be considered for the final report and decision making.
10
Performance Variables
The initial metrics of this study are based on a comparison of a current manual process of tracking and tracing the complete cycle of asphalt paving to an automated process.
The range of metrics might include:
• Tracking data accuracy
• Asphalt loading time per truck
• Truck transportation time
• Truck and driver waiting time
• Truck unloading time for asphalt
• Truck return time for a new load of asphalt
• Truck waiting time to load asphalt mass
• Truck driver signature capture time
• Asphalt temperature during loading and unloading
Summary
Ross, Burns, Wu, and Jarad (2009) demonstrated that in a controlled laboratory environment RFID tags can maintain an operational read range from seven to 17 feet after exposure to temperatures below 210oF. Depending on the distances considered for the field tests of this project, the results indicate that the read range for passive tags should not to exceed 17 feet. However, this test result is not conclusive or exhaustive and was performed on passive, not battery assisted active tags (Hedgepeth, 2007).
When examining the distance from the asphalt mixing plant to the construction work site, the example from Kilpellainen, Heikkil, and Parkkila (2007) indicated that about 62 miles is a maximum transport distance for hot-mix asphalt. Anticipated haul distances for the Anchorage, Alaska demonstration project is far less than the maximum. As such, asphalt cooling during the haul should not be a factor.
While the process did rely on wireless communications, the process of data collection and reporting was still manual. The reports would be essentially instantaneous between sender and receiver, eliminating the paper trail from a truck driver. From their research we can determine that the team for the current research project should include at least a work supervisor, asphalt mixing plant operator, asphalt paver operator and truck drivers. However, in this current research design we have also included weight scale operators and AKDOT&PF analysts processing the daily truck tickets.
Data capture and accuracy are an essential part of the emerging results from RFID studies. It is apparent that the focus is changing to data capture accuracy and eliminating automated data capture errors. Just moving from a manual process to an automated system with RFID does not guarantee 100% data capture.
11
CHAPTER 3 – FINDINGS
The outcome of this research demonstrating that an automatic capture data system could be implemented to monitor and track the transportation of asphalt from the asphalt plant to the work site. To this end, the research findings are separated into the categories of as-is analysis, literature review results, and field data analysis. Each of these categories is discussed below.
As-is Analysis
As discussed earlier in this document, it is essential that the research team understand the as-is system before moving forward with designing, implementing, and testing an automatic identification/tracking system.
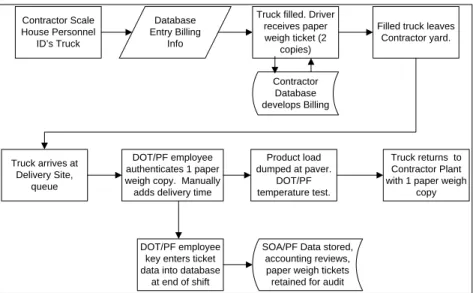
Figure 6: As-Is System Map
As the system map identifies and verifies, the current system includes several manual steps that require an individual to take a specific action. For this type of a system, reliance on manual data collection may not be the most cost efficient or effective. Over the course of a construction project— relying on predominately manual processes—the potential for lost paperwork has been recognized by the contractor, sub-contractor trucking companies, and ADOT&PF field personnel.
The current system of creating dual paper tickets which are transferred to subcontractor drivers, who transport them to an active road construction site, and manually handed off to a site based ADOT&PF field person is problematic. Anecdotal evidence has shown that tickets have been lost to gusts of wind or under seats.
The loss of a weigh ticket generates significant interruptions in the normal business process. Lost or incorrect tickets also negatively impacts vendor payments as they are disputed, audits are often required, and many times, the outcome leads to vendor appeals which require more time and increased costs.
Contractor Database develops Billing Contractor Scale House Personnel ID’s Truck
Truck filled. Driver receives paper weigh ticket (2
copies)
Filled truck leaves Contractor yard. Truck arrives at Delivery Site, queue DOT/PF employee authenticates 1 paper weigh copy. Manually adds delivery time
Product load dumped at paver. DOT/PF temperature test. Truck returns to Contractor Plant with 1 paper weigh
copy
DOT/PF employee key enters ticket data into database
at end of shift
SOA/PF Data stored, accounting reviews, paper weigh tickets retained for audit Database
Entry Billing Info
12 As federal highway policy makers monitor the growth and maturity of RFID technology based processes, a greater appreciation for the simplification of labor is recognized as beneficial for developing a first-time right work environment.
Data Analysis
This data analysis section is specific to PaveTag’s RFID system recorded automatic acquisition data set. This analysis is inclusive of all data obtained during the research test period. Specifically, RFID tags were affixed to six asphalt hauling trucks for the time frame of June 30, 2010 to July 17, 2010, a total of 18 days. During the test period the six asphalt trucks completed a total of 280 round trips from the asphalt plant to the construction site.
Figure 7 identifies the number of round trips per truck that the automatic data tracking system logged during the test time frame. As this figure depicts, during the analysis time frame truck 215B made the most round trips with a total of 57 trips. Truck 701B had the fewest trips with a total of 40. Overall the trucks made an average of 47 round trips during the test.
Figure 7: Number of Asphalt Material Movements per Truck.
A review of the test data does not identify any time frame where data was not recorded. Comparing the manual scale data to the data collected by the RFID reader shows that the automatic data capture system recorded 100% of the trucks. The data also showed full agreement concerning the quantity of asphalt carried by each truck. Consequently, it can be argued the automated data capture system is as accurate as the paper ticket process in recording the number of trucks and the quantity of asphalt delivered to the jobsite.
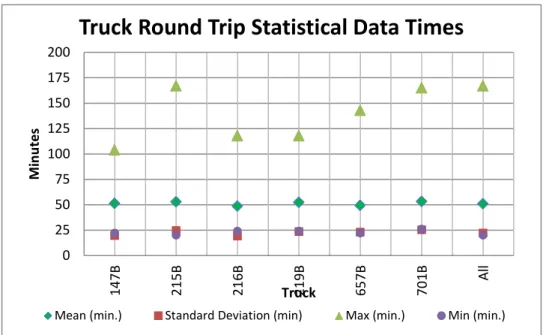
Statistically the data indicates that the trucks were fairly consistent in the amount of time each round trip required. Figure 8 provides the round trip mean, standard deviation, and maximum and minimum times for each truck, as well as values for the aggregate.
30 35 40 45 50 55 60 14 7B 21 5B 21 6B 21 9B 65 7B 70 1B Co un t Truck
Number of Trips
13
Figure 8: Per Truck Statistical Results.
Table 1: Truck Round Trip Statistical Analysis.
Table 1 provides the numeric details shown in Figure 8. The data identifies that on average the trucks required 50.92 minutes to complete a round trip. The round trip time includes time to load the asphalt, time on the job, and time required to travel from the asphalt plant to job site then return to the asphalt plant.
The shortest round trip time took just 20 minutes and one trip required a total of 167 minutes. This results in an average standard deviation of 22.04 minutes. Overall the individual truck standard deviation and minimum times are closely aligned with the aggregate values. Truck 215B and 701B have the longest round trip times of 167 and 165 minutes, respectively. These times are at least 22 minutes longer than the next truck’s longest time. No effort was made to
0 25 50 75 100 125 150 175 200 14 7B 21 5B 21 6B 21 9B 65 7B 70 1B All M in ut es Truck
Truck Round Trip Statistical Data Times
Mean (min.) Standard Deviation (min) Max (min.) Min (min.)
Truck Mean (min.) Standard Deviation (min) Max (min.) Min (min.) Trips
147B 51.33 19.66 104 22 43 215B 52.96 24.49 167 20 57 216B 48.58 18.96 118 24 48 219B 52.43 23.53 118 24 47 657B 49.38 23.03 143 22 45 701B 53.23 25.31 165 26 40 All 50.92 22.04 167 20 280 average 47 Truck Round Trip Statistical Results
14 determine the cause of the delay, however, project personnel indicated the delay was due to the trucks being used to haul away waste material.
Automatically captured data also provides the ability to analyze the amount of time trucks were in the asphalt plant loading, on the job (unloading), in transit to and from the asphalt plant, and on the job site. These statistical results are presented in the following sections.
Asphalt Plant Time Analysis
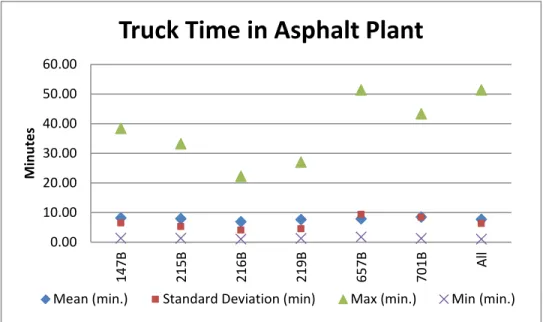
Figure 9 and Table 2 are the visual and numeric data representations for how long the various trucks were timed to be at the asphalt plant. This time is assumed to be the time required for the truck to arrive, obtain an asphalt load, and then begin their trip back to the job site.
These times are the difference between when the RFID database logged the truck “Plant Arrival” time and “Plant Left” time. These indicate there can be a significant difference in how long a truck may be at the asphalt plant. On average the shortest time in the plant is just over a minute while the longest time average is 51.33 minutes as shown in Figure 9. In general, the trucks took 7.69 minutes to arrive, load, and leave. While the overall range is very large, the average truck load time standard deviation is 6.29 minutes. Again, no effort was made to determine the cause of the delay, but such delays are common for a variety of reasons.
Figure 9: Truck Time in Asphalt Plant.
0.00 10.00 20.00 30.00 40.00 50.00 60.00 14 7B 21 5B 21 6B 21 9B 65 7B 70 1B All M in ut es
Truck Time in Asphalt Plant
15
Table 2: Truck Time in Asphalt Plant.
On The Job Time
Figure 10 and Table 3 are the profile and numeric values for how long the trucks were on the job site. This time is the difference from the RFID database “Job Arrival” time and “Job Left” time. Similar to the asphalt plant time, the on the jobsite time range is very large. The shortest average time on the job is 1.02 minutes while the longest is 57.73 minutes. On average, the trucks required 10.91 minutes on the job with a statistical deviation of 10.91 minutes.
When comparing the individual truck time on the job site, truck 701B had the shortest on the job time in all categories. Truck 701B’s average time on the job was 9.92 minutes; its statistical variation was 8.7 minutes and its longest time on the job site was 36.58 minutes.
Figure 10: Truck Time on Job Site.
Truck Mean (min.) Standard Deviation (min) Max (min.) Min (min.)
147B 8.14 6.45 38.37 1.33 215B 7.89 5.27 33.15 1.32 216B 6.87 4.03 22.18 1.02 219B 7.63 4.52 27.00 1.28 657B 7.85 9.40 51.33 1.73 701B 8.46 8.38 43.28 1.27 All 7.69 6.29 51.33 1.02
Truck Time in Ashpalt Plant Statistical Results
0.00 10.00 20.00 30.00 40.00 50.00 60.00 70.00 14 7B 21 5B 21 6B 21 9B 65 7B 70 1B All M in ut es
Truck Time on Job
16
Table 3: Truck Time on Job
Truck Travel Time
Figure 11 is the profile for the overall travel time between the asphalt plant and the job site. Table 4 shows the numeric values associated with Figure 11.
On average the trucks required 32.61 minutes to travel between sites. There is a statistical variation of 17.57 minutes associated with this travel time. The minimum logged travel time is 14.67 minutes with a maximum of 150.14 minutes.
As shown in Figure 11, trucks 215B and 701B had the longest travel time—each of these travel times occurred on July 11 at approximately 02:36 am. If these two long travel times are excluded from the data set, the average travel time is reduced to 31.77 minutes, the statistical variation declines to 14.61 minutes, and the maximum travel time is 87.47 minutes.
Figure 11: Truck Travel Time.
Truck Mean (min.) Standard Deviation (min) Max (min.) Min (min.) 147B 12.98 12.17 52.88 1.33 215B 9.89 10.20 57.73 1.02 216B 10.99 10.74 47.03 1.73 219B 11.64 11.91 52.48 1.63 657B 10.26 11.64 55.35 1.33 701B 9.92 8.70 36.58 1.03 All 10.91 10.91 57.73 1.02 Truck Time On Job Statistical Results
0 20 40 60 80 100 120 140 160 14 7B 21 5B 21 6B 21 9B 65 7B 70 1B All M in ut es
Truck Travel Time Statistical Results
17
Table 4: Truck Travel Time
Summary of Data Analysis
The results of this feasibility study verified that incorporating the technologies of RFID, GPS and cellular communications provides a system that can monitor and track material movement on an ADOT&PF project. In addition, the acquired data provides the ability to identify how long it takes individual trucks to load, travel between sites, and off load. Understanding the travel time from the asphalt plant to the job site provides potential benefits to both ADOT&PF and the contractor.
From the perspective of ADOT&PF, there is a direct relationship between the quality of the deployed pavement and travel time between the asphalt plant and the construction site. If the travel time is long, the asphalt may cool to a temperature that reduces the quality of the product. Understanding the relationship between long travel times and asphalt temperature allows ADOT&PF personnel the opportunity to address the issue early.
Tracking cycle times allows the contractor to optimize the material haul by minimizing the truck wait times at the plant and at the paver. Under ideal conditions, a truck will arrive just as the previous one is leaving. This ensures that the paver can operate at a constant speed without stopping. This improves the ride quality or smoothness of the pavement surface Analysis of wait times allows the contractor to manage the flow of material to the paver to prevent cold asphalt loads ensuring the asphalt is above the minimum compaction temperature. .
The study verified that under the environmental test conditions, the selected technologies did not experience any failures or outages. The technology was able to meet the operational constraints required by ADOT&PF. The system also performed well under the typical construction environment which includes: humidity, torrid summer rain storms, road construction generated dirt and mud encapsulation, and severe equipment vibrations.
Truck Mean (min.) Standard Deviation (min) Max (min.) Min (min.) 147B 30.21 12.23 70.85 17.10 215B 35.17 20.89 150.13 14.67 216B 30.72 15.08 81.93 16.13 219B 33.15 18.48 99.33 15.83 657B 31.31 15.30 84.70 16.08 701B 35.49 23.77 146.33 16.22 All 32.61 17.57 150.13 14.67
18
CHAPTER 4 - INTERPRETATION, APPRAISAL, AND APPLICATIONS
The system produced a meaningful test scenario to evaluate the particular RFID/GPS/cellular tool as an automatic material transportation data capture system. Application of this automatic data capture system provides key metrics for the length of time a truck was at the asphalt plant, travel time between the asphalt plant and the job site, and time on the job site.
Comparison of the scale house data, paper tickets, and the data captured from the RFID data collection system demonstrated 100% agreement between the manual and automated data. In addition, the times recorded at the scale house and the RFID agree within one minute. The differences are likely in the clock settings. Consequently, moving to an automated RFID system will yield the same quantities as the paper ticket.
However, there are still issues to be resolved. Applications of asphalt or base course requires computing the quantity of material placed per square yard, linear foot, or other unit in order to control the quantity of material placed. At this time, the current data capture method does not allow for that since the data does not contain the exact location of the placement of the material. There are several ways to overcome this including GPS data which can be made available with the Pave Tag system. However, that was outside the scope of this project to implement and test that technology.
Another barrier to implementation is the process of verifying that the material was placed on the project site. As part of this process, it will be necessary to compare the trucks that leave the scale house and those arriving at the jobsite. The advantage of the automated process is that this can be done electronically saving a considerable amount of time. Processes to do so should be relatively simple to develop, but again, that was not within the scope of the project.
There is also a concern of data security. Scale house data uses a paper copy of the information as a redundant copy in case the electronic data is lost. Some form of data security will be required before the system can be implemented.
Finally, asphalt temperature of the mixture is an important data element. Again, adding this data set to the system can be readily accomplished with the addition of temperature sensors
In short, the data collected agrees with the conventional collection method. However, the ability to compute yield, data security, automated validation of product delivery, and the collection of temperature must be resolved before full implementation can be achieved.
There are advantages to using the automated RFID data collection system for both the contractor and ADOT&PF, such as knowing the truck cycle time and delays which can help optimize the number of trucks and ensure asphalt is delivered to the jobsite in a continuous stream. This helps minimize the number of stops of the paving train and reduces the potential for rejecting the asphalt because it is too cold. The data collected and analyzed here demonstrates that these data provide that information.
19 The acquired time data identified that, on average, the time for a truck to make a round trip was fairly consistent at about 51.12 minutes. Included in the average are two outliers indicating that truck 215B and 701B took 167 minutes and 165 minutes, respectively, to make the longest two trips. Project personnel indicated these trucks were being used to haul waste material from the project during this period. These examples show that no system is likely to be able to track every possible scenario. However, the system was able to detect an anomaly which can be investigated.
The time on the project consistently averaged 10.91 minutes. The time required to back up to the paver and dump is less than 5 minutes. In hind sight it would have been good to obtain this information for the projects. By taking the difference of the time on the job and the time to dump the load gives the dwell time of the truck. From this the contractor can adjust the number of trucks to manage the dwell time which in this case is about 6 minutes.
In regard to the length of time at the asphalt plant, it is interesting to note that on average all trucks were fairly consistent requiring about 7.69 minutes at the plant with a standard deviation of 6.29 minutes. This appears to demonstrate a fairly consistent and smooth operation at this location. There are cases where the trucks took up to 51.33 minutes, but these instances are likely due to plant shut down.
Although the minimum time for each truck is very consistent between trucks the maximum time shows the extremes of 22.18 minutes to 51.33 minutes. There are a number of possible causes including repair or fueling of the truck or plant shutdown.
Trucks 216B and 219B had the shortest maximum time while truck 657B had the longest. A review of times indicates that some trucks arrived while others were still apparently loading. It can be assumed that as multiple trucks arrive at a given work location they will be delayed in either loading or off-loading. The recorded time data indicates this but no field collaborating verification information is available for this assumption.
Research Limitations
While the study showed that RFID technology can be successfully used in areas with good cellular communication, this is not always the case within ADOT&PF’s area of responsibility. The test did not demonstrate how an automatic capture system can be deployed within an area where remote communications are intermittent or severely limited. This may or may not be an issue, depending on the needs of the project. It should be noted that cell phone coverage is not necessary for the basic needs of ADOT&PF; that is, the replacement of the paper ticket. However, if the other functions of the automated system such as tracking the location of a truck or real-time transfer of data to the office, a communication system will be required.
Other technology approaches may compensate for this limitation, such as the use of handheld readers to capture the data. The captured data could then be downloaded to ADOT&PF’s and the contractor’s databases periodically throughout the day or at the end of the work shift by
20 connecting to online computers. While this may be an approach to overcome areas of limited telecommunication, this research did not test and validate the method.
A second limitation of this research is the direct comparison to the manual system beyond the delivery of the material and the quantity of material delivered. While the system did agree completely for the manual system in tracking the amount of material that went over the scale and the time the material arrived on the project, the system was not designed to track the location at which the asphalt was placed, the temperature of the asphalt at the time of placement or track any waste material. Existing technologies are available to track these, but was not within the scope of this project.
General Recommendations
Incorporating technology to enhance cost efficiency and overall system effectiveness appears to have positive potential for ADOT&PF material transportation tracking and measuring. A key recommendation, which is expanded on in the future research recommendation section, is that ADOT&PF continues to develop this technology. Future technology development efforts should bridge the gap of less than full time communication capabilities and how the automatic data capture system information can be integrated within the decision makers’ key inputs as well as contractual support capabilities.
It is suggested that DOT consider using RFID technologies to track asphalt across the scales and onto the project. It is also suggested that methodologies to record the placement location of the asphalt, asphalt temperature and tracking of waste material be developed. This requires working with the vendors to develop data collection RFID readers with the ability for the operator to manually add information. It also requires adding GPS and temperature sensors to the system. If ADOT&PF wishes to investigate the use of RFID technology further, protocols for integrating RFID into mainstream operations must be developed. These include
• Certification that material was incorporated into the project as required by FHWA
• Determining the quantity placed per unit area or length
• Measuring delivery temperatures of asphalt
• Data security
• Methods to handle wasted material.
• Automate the synchronization of the scale house data and the data collected at the job site.
ADOT&PF must also separate which data is necessary for its needs and decide whether communications systems are necessary to meet those needs. While communications were used heavily in this study, it may not be necessary to meet ADOT&PF’s needs. That said, the contractor may wish to gather information not needed by ADOT&PF to help the contractor manage the project more efficiently.
21
CHAPTER 5 - CONCLUSIONS AND SUGGESTED RESEARCH
In summary, the outcomes of this feasibility study met the project identified objectives. The RFID/GPS and cellular communications integrated automatic data capture system was able to track material transfer in the test environment. The system provides key time elements, such as time to load, travel time, and time on job. The test also provided the ability to document the approximate dump location using short range RFID readers. The short range RFID readers provide a more exact indication of deployment location than a long range reader. These quantifiable, near real time, metrics, could assist both the ADOT&PF contractor and ADOT&PF project manager monitor in-process activities and proactively address changes in the field as they occur.
The feasibility system captured 100% of the truck movements that occurred within the test time frame. If incorporated into ADOT&PF’s and contractor’s database system it appears that the feasibility system could reduce labor required for the manual processes and reduce potential costly data entry errors.
Based on information derived from this study, this technology has the potential to assist ADOT&PF meet its mission statement of improving cost efficiencies and improving effectiveness while meeting or exceeding overall project quality requirements. However, there are issues which must be addressed before full integration can occur. These issues are primarily related to operational issues rather than technical issues.
Suggested Research
As noted in the Research Limitation section the present feasibility study did not provide a holistic metric capability for a fully integrated system. Further research is required to address the limitations of this effort.
Integration into the operational environment requires further development. Areas of research include:
• Measure and record asphalt temperature at the time of delivery.
• Record the location on the project at which the material was delivered and compute the quantity of material placed per unit area or unit length.
• Certification of the placement of the material as required by FHWA
• Ensure data integrity and security either by producing paper tape or through data backup.
• Track waste material which is deducted from the total quantity.
It is suggested that ADOT&PF continue to expand this research by addressing the limitation of projects that must occur in areas with limited communication. The outcome of this applied research would be a system that can be deployed in areas with limited communications and areas with full communication capabilities. A further outcome of this research can be a vendor neutral procurement specification that ADOT&PF as the contracting department could incorporate in future competitive bid activities or even in sole-source contracting efforts.
22 It is suggested that ADOT&PF continue this research and investigate the benefits of tracking other weighed materials, such as borrow, crushed material, surfacing aggregate or waste materials. Remote permanent and temporary pit locations would be the origin for such research, thus providing another accurate portrayal of the system’s capabilities. As with asphalt, using RFID tracking has the potential to reduce the time and cost of manually computing quantities. It is also suggested that ADOT&PF engage in applied research that integrates automatic data capture inputs to the ADOT&PF maintenance and project databases. The near real time data could then be made available to the ADOT&PF project management team and contractors so decisions could be made with more timely and accurate information. The use of the temporal and spatial data can assist claims analysis (i.e. delays). Having direct access to exact wait times, production rates, and day-to-day contractor performance would allow management a greatly expanded knowledge which should enhance the overall management effort.